TradeCityPro | Bitcoin Daily Analysis #7👋 Welcome to TradeCityPro!
Today, we are going to review Bitcoin's futures triggers for the New York session. The market hasn't moved much since yesterday, but we have a risky trigger that might serve as a good opening for today's positions.
⏳ 1-Hour Timeframe
As mentioned, we're observing a long-term range box that started in early February, and currently, Bitcoin is oscillating within an expanding triangle. Yesterday, the price reacted strongly to this triangle, validating it as a critical zone for setting positions.
🔍 Because of this, I've added a risky long trigger at 97,816, which could precede the 98,482 trigger. This is risky because if the price is rejected at 98,482 after breaking 97,816, your stop-loss is likely to be hit. Enter this position with the understanding that you are anticipating the 98,482 break. If this resistance isn't broken, your position might not yield profits.
🔽 For shorts, the 97,110 trigger mentioned yesterday hasn't activated yet. This trigger is still valid for shorts but remember, like the long position at 97,816, it's risky and targets the range box bottom, so manage your risks carefully. The main triggers remain at 98,482 for longs and 95,108 for shorts.
📊 Market volume has decreased significantly, suggesting a sharp price movement is impending. Stay alert and ready to act on the triggers as the market will likely make a decisive move soon.
👑 BTC.D Analysis
As forecasted, if Bitcoin dominance managed to stabilize above 60.71, we expected a further upward correction and deeper pullback, which has occurred. The price broke through this area, pulling back up to 60.95 and forming a significant ceiling.
🧩 If this area is breached, we can take an early sign of a rising Bitcoin dominance, but the main trigger remains at 61.10. The best trigger for a continued downtrend is still 60.48; breaking this could herald the next bearish leg in Bitcoin dominance.
📅 Total2 Analysis
As stated yesterday, breaking 1.24 would have been a cue for a risky short position, but the price has not consolidated below this level and has twice rebounded off this support.
✨ Thus, this level has become a more critical threshold for shorts. Should this area break, it could be a good time to enter a short position, particularly if Bitcoin dominance is also rising, suggesting a potential downturn for altcoins as well.
📈 The main long position remains with the breakout at 1.28, and there are no other significant long triggers in the chart. For risky shorts, levels 1.2 and 1.19 are suitable, with the primary short trigger still at 1.16.
📅 USDT.D Analysis
As mentioned yesterday, a breakout at 4.47 could lead to increased Tether dominance, but I've adjusted this trigger to 4.48 today due to unclear price action around the former level.
🔑 This remains a high-risk trigger, and the potential for it being displaced again is considerable. Be ready to adjust this line yourself if the price near this area shows significant reaction.
⚡️ Still, a definitive bullish signal for Tether dominance will only be confirmed above 4.62, while a decisive bearish turn would be confirmed by breaking below 4.40, which has become a significant support following substantial price reactions. If this level is breached, the target will be 4.24.
❌ Disclaimer ❌
Trading futures is highly risky and dangerous. If you're not an expert, these triggers may not be suitable for you. You should first learn risk and capital management. You can also use the educational content from this channel.
Finally, these triggers reflect my personal opinions on price action, and the market may move completely against this analysis. So, do your own research before opening any position.
TOTAL2

TradeCityPro | Bitcoin Daily Analysis #6👋 Welcome to TradeCityPro!
Today, we're diving into Bitcoin's analysis, focusing on appropriate futures triggers for the New York session.
⏳ Hourly Time Frame
1-Hour Timeframe As mentioned in previous analyses, Bitcoin remains in a crucial range box. Yesterday, we saw a fake breakout of the expanding triangle's upper edge, but the trigger at 98,482 was not activated, and the price did not stabilize above this area but was rejected.
🔍 Currently, our long position triggers remain the same at 99,946 and 101,819. However, a new short trigger has been added. The first short trigger is at 97,110, which is considered very risky and should not hold high expectations.
🔽 If you initiate a short position upon breaking this area, your target could be 95,108. As previously discussed, the main short trigger remains at 95,108. If you open a position at this level, the target could be the bottom of the expanding triangle or the area around 92,702.
📊 The market volume continues to decrease, indicating that a sharper and more significant price movement is imminent.
👑 BTC.D Analysis
BTC.D Analysis Bitcoin dominance has broken the curve trendline, but currently, there is no significant upward momentum observed. If the price breaks and stabilizes above 60.71, we can take this as the first sign of a bullish trend. The main trigger remains at 61.10.
🧩 For a continued fall, an excellent trigger is at 60.48. If this trigger is broken, we can hope for dominance to reach 59.84.
📅 Total2 Analysis
Total2 Analysis As discussed yesterday, if the price pulls back to 1.24, we can open a long position. This scenario occurred, and many altcoins moved upward. However, as mentioned, the target for this position was relatively small because it was opened as a scalp position. The main long trigger remains at 1.28.
🔽 For those who are risk-takers, you can enter a short position if the price breaks 1.24. But be cautious, this trigger is very risky. Other risky triggers are at 1.2 and 1.19.
⚡️ The main short position remains at 1.16. Keep in mind, Bitcoin's dominance shows more signs of falling, so if you are considering opening a short position, Bitcoin might perform better than altcoins.
📅 USDT.D Analysis
USDT.D Analysis Let's look at the Tether dominance. We have an adjustment in the dominance support, which was previously at 4.44 but has been moved to 4.40 due to a strong price reaction yesterday. Currently, the main support for Tether dominance is at 4.40, and breaking this area could validate a long position.
💫 There is a very risky short trigger at 4.47, similar to the 1.24 trigger in Total2. If these two align, you might accept the risk and enter a short position with the minimum risk defined in your strategy. The target for this position is 4.62, while the target for a long position remains 4.24, which is also the main trigger for a trend change.
❌ Disclaimer ❌
Trading futures is highly risky and dangerous. If you're not an expert, these triggers may not be suitable for you. You should first learn risk and capital management. You can also use the educational content from this channel.
Finally, these triggers reflect my personal opinions on price action, and the market may move completely against this analysis. So, do your own research before opening any position.

TradeCityPro | Bitcoin Daily Analysis #5👋 Welcome to TradeCityPro!
Let's dive into today's analysis of Bitcoin. Since yesterday, there haven't been significant changes in the market, and none of our triggers were activated. However, let's explore the upcoming scenarios and identify any new triggers.
⏳ Hourly Time Frame
1-Hour Timeframe As you can see, Bitcoin is currently forming an expanding triangle, which typically doesn't respect resistances or supports very well, making it tricky to take long-term positions while the price remains within this pattern.
🔼 For a long position, the trigger remains above 98,482. Keep an eye out for this break because, as you can see, the trading volume has decreased, suggesting that a sharp price movement is likely imminent. Financial markets exist for speculation, not stagnation, so a decrease in volume usually precedes a significant price move—either upwards or downwards.
📊 Should this long trigger activate, it would be safe to hold a position expecting the price might retest the resistance at 106,000, giving us comfort in pursuing other potential coin positions.
📉 The short position has a significant level at 95,108, now more critical than the 92,702 level. If broken, Bitcoin could start its next bearish leg, with the first target at 92,702 and, upon breaking this, potentially moving towards the lower ranges around 80,000 to 82,000.
🔑 Today, I'm not focusing on the RSI due to the market's range-bound state, making it unreliable for confirming momentum. Thus, I've excluded RSI from both today's and yesterday's analyses.
👑 BTC.D Analysis
BTC.D Analysis As predicted, the dominance fell, confirming yesterday's analysis. After retesting the 61.10 level and following the trendline curve, the next leg down began, targeting the 59.84 area. This movement will help us understand the upcoming market direction based on how the dominance behaves at this level.
👀 If it proves to be a fake-out and the dominance breaks the curve again, retaking the 61.10 trigger, we might see a resurgence in Bitcoin's dominance, suggesting a bullish scenario is less likely.
📅 Total2 Analysis
Total2 Analysis As observed, the Total2 level that was previously active at 1.24 is currently retesting this area. It hasn't fully stabilized above this level, so let's wait for confirmation that this resistance has been broken. If so, we can expect a move towards at least 1.28.
✅ This break of 1.24 was an initial scalp trigger, with the main long-term trigger at 1.28. If breached, it could validate a bullish long-term position on altcoins, given the concurrent fall in Bitcoin's dominance, suggesting a preferable situation for altcoins compared to Bitcoin.
📉 In the event of market downturns, Bitcoin positions are generally more favorable if Bitcoin's dominance continues to fall. However, if considering short positions on altcoins, wait for Total2 to potentially fake this breakout and, if it reverses, enter upon breaking the 1.19 level. If you're a risk-taker, you could initiate earlier at the break of 1.19.
📅 USDT.D Analysis
USDT.D Analysis In the USDT.D index, nothing significant has changed, and for market long confirmations, the 4.44 break remains crucial. Conversely, for short positions during a market downturn, a break of 4.62 would confirm an increase in Tether's dominance.
⚡️ Note that the 4.44 trigger is risky, and a break of 4.24 is the principal confirmation of a trend change in USDT.D.
❌ Disclaimer ❌
Trading futures is highly risky and dangerous. If you're not an expert, these triggers may not be suitable for you. You should first learn risk and capital management. You can also use the educational content from this channel.
Finally, these triggers reflect my personal opinions on price action, and the market may move completely against this analysis. So, do your own research before opening any position.

TradeCityPro | Bitcoin Daily Analysis #4👋 Welcome to TradeCityPro!
Today, I'll be conducting a deep analysis of Bitcoin, often referred to as the king of crypto due to its significant market dominance and cap. We'll be exploring suitable futures triggers for the New York session and examining the effects of the recently released U.S. inflation rates, which have favored the U.S. dollar.
⏳ Hourly Time Frame
As you can see, the long trigger we set yesterday was activated and has already yielded profits. The price approached our target resistance at 98482 but is currently being rejected from this area and is moving back down towards the support level at 95108.
🔍 This 95108 trigger remains robust, and if this area breaks, we can open a position. This support was effective yesterday, as you might have noticed—even though the news favored the U.S. dollar, this support prevented further price decline. Therefore, a break below this could likely initiate the next bearish leg for Bitcoin, with the first short position target at 92802.
📊 Excluding the news release time, market volume has generally been ranging and is progressively decreasing, indicating that a significant move is imminent. For long positions, the 98482 trigger remains suitable. The second long trigger is at 99946, with the primary trend-changing trigger still firmly at 101819.
👑 BTC.D Analysis
As I mentioned yesterday, I observed significant bearish momentum in the BTC.D chart, with the 61.10 support now breached. The next nearest support for Bitcoin dominance is at 59.84.
👀 With Bitcoin's dominance declining, if the market moves upwards, the Total2 triggers I will identify could be more suitable than the long triggers for Bitcoin itself. However, if this breach proves to be a fakeout and dominance returns to its box and moves towards its upper boundary, it could inject strong bullish momentum into Bitcoin's dominance, making a long position in Bitcoin more favorable.
✅ If the market falls and Bitcoin's dominance continues to decrease, Bitcoin positions will likely be more profitable. Conversely, if Bitcoin's dominance rises, altcoins will drop more than Bitcoin.
📅 Total2 Analysis
Moving on to Total2, you can see that despite the decline in Bitcoin's dominance, Total2 has maintained its position better than Bitcoin itself. Notice that Bitcoin has reached its primary support, whereas Total2 has only retracted from a recent high at 1.24.
✨ The ceiling of 1.24 remains a suitable trigger for long positions, though it should be approached as a scalp to a target of 1.28. The main breakout trigger is the breach of 1.28, which would confirm a trend change. For short positions, the risky position at 1.19 and the main position at 1.16 remain valid, targeting 1.1.
📅 USDT.D Analysis
Finally, let’s touch on USDT.D. This index could not maintain its position above its resistance, effectively causing the entire market to hold strong at support levels yesterday, contributing to the rejection of USDT.D from this area.
💥 Our triggers on USDT.D haven't changed significantly. For long positions, breaking 4.44 would be suitable as it would decrease Tether's dominance and potentially favor a market downturn; for short positions in a falling market, 4.62 is optimal, increasing Tether's dominance and potentially leading to a market decline.
❌ Disclaimer ❌
Trading futures is highly risky and dangerous. If you're not an expert, these triggers may not be suitable for you. You should first learn risk and capital management. You can also use the educational content from this channel.
Finally, these triggers reflect my personal opinions on price action, and the market may move completely against this analysis. So, do your own research before opening any position.

TradeCityPro | Bitcoin Daily Analysis #3👋Welcome to TradeCity Pro!
Let's dive into Bitcoin analysis. As usual, I will review the best futures triggers for the New York session. The U.S. inflation report has just been released, so we can consider its impact when opening positions.
⌛️ 1-Hour Timeframe
Yesterday’s analysis activated the short trigger at 97218, leading the price to the first target at 95979, where it found new support at 95108. I hope you took advantage of yesterday’s trigger and profited from the market movement.
🔍 Today, we have valid triggers for opening positions, as an interesting structure has formed for both long and short trades. If 95108 support breaks, you can enter a short position with a target at 92702.
📊 Market volume has been decreasing since reaching 95108, and we need to see which direction volume enters next. If bearish volume increases along with the support break, bearish momentum will strengthen, potentially initiating the next downward leg.
🔼 The long trigger is at 96394, with momentum confirmation coming from an RSI break above 50. This setup is considered risky and should be entered with minimal risk. The main long trigger is at 98482, which has become a strong resistance, and its targets could be 99946 and 101819.
👑 BTC.D Analysis
Yesterday’s BTC.D triggers were not activated, and the dominance is currently ranging.
💥 A curved trendline is visible on the chart. If it breaks, the trigger for confirmation will be at 61.49, signaling an increase in Bitcoin dominance.
✔️ Support at 61.10 is a key level, and considering the current market momentum, it is likely that this support will break, leading to a trend shift.
⌛️ Total2 Analysis
Yesterday’s Total2 short trigger was activated alongside Bitcoin’s short trigger, so if you opened short positions on altcoins, you should currently be in profit.
🔑 Today, we also have valid triggers for trading. The short trigger is at 1.19, but this level is quite risky. The main short trigger is at 1.16. However, as seen earlier, Bitcoin’s trigger is much cleaner, and if Bitcoin dominance drops, a short position on Bitcoin will likely be better than on altcoins.
📈 For long positions, 1.24 is a valid trigger, but the price is still far from it. If this level breaks, we could open a long position with a target at 1.28.
⌛️ USDT.D Analysis
USDT dominance triggers have not yet been activated, but the key levels have been updated. Here are the new triggers:
🔽 If 4.62 breaks (which is already happening and may complete within this candle), USDT dominance will increase, confirming our short positions.
💫 For long positions, the trigger is at 4.44. If this level breaks, USDT dominance could drop to 4.24.
❌ Disclaimer ❌
Trading futures is highly risky and dangerous. If you're not an expert, these triggers may not be suitable for you. You should first learn risk and capital management. You can also use the educational content from this channel.
Finally, these triggers reflect my personal opinions on price action, and the market may move completely against this analysis. So, do your own research before opening any position.

TradeCityPro | Bitcoin Daily Analysis #2👋 Welcome to TradeCityPro!
Let’s analyze Bitcoin and identify suitable futures triggers for the New York session.
⌛️ 1-Hour Timeframe
If you entered a position yesterday on the price pullback to the 97218 zone, you're now in profit. If your position has a risk-to-reward ratio of 2 or higher, I recommend securing some profits. Otherwise, if you want to keep your position open, watch the 98903–99946 range, and if the price gets rejected from this area, secure your profits.
🔍 We also have new trade setups for today, with two triggers for long and two for short, either of which could activate. For a long position, a breakout of 98903 or 99946 is suitable. The 98903 breakout is riskier since we’d be entering a long position within a resistance zone, while the 99946 breakout may be difficult to enter as it might not provide a strong confirmation candle but is a safer long entry.
🔼 The key resistance above these two triggers is 101819, which can be used as a target. A breakout above 64.74 in the RSI would also serve as a momentum confirmation.
📉 For short positions, the first trigger is a breakdown of 97218, which has acted as a strong minor support. If we see a reaction here, this level will be confirmed, and on a second test, we can enter a short position. A breakdown of the 50 level in the RSI would confirm this setup. However, this is a risky trade, so it should be taken with minimal exposure.
✔️ The next key level is 95797, which has seen multiple price reactions. If the price forms a lower high below 101819, the chances of breaking this level increase. The target for this short setup is 92700.
👑 BTC.D Analysis
Yesterday, I mentioned that if Bitcoin dominance stabilized below 61.34, long positions on altcoins would be more logical, which played out as altcoins outperformed Bitcoin.
✨ Today, if BTC.D remains below 61.06, it could indicate a trend shift in higher timeframes. Conversely, if it reclaims 61.34, Bitcoin could once again be the better choice for long positions in a bullish market.
⌛️ Total2 Analysis
Total2 triggered its setup alongside Bitcoin and is now testing the 1.24 zone. The only long trigger at the moment is a breakout of 1.24. However, keep in mind that the primary trigger was at 1.22, and the next major trigger is at 1.28, making any long entry now quite risky. Personally, I wouldn’t take this trade.
💫 For short positions, wait for the price to drop back below 1.22, then use Dow Theory and a break of the newly formed low as a short entry trigger.
⌛️ USDT.D Analysis
Now, let’s analyze USDT.D. This index began its decline after breaking 4.51 and retesting it. The next trigger is at 4.41, and if it breaks, we can expect a further drop to 4.22.
🧩 On the other hand, if it reclaims 4.51 and moves toward 4.64, it could increase the likelihood of Bitcoin’s 97218 short trigger being activated. If USDT dominance rises, the target will be 4.64.
❌ Disclaimer ❌
Trading futures is highly risky and dangerous. If you're not an expert, these triggers may not be suitable for you. You should first learn risk and capital management. You can also use the educational content from this channel.
Finally, these triggers reflect my personal opinions on price action, and the market may move completely against this analysis. So, do your own analysis before opening any position.

TradeCityPro | TOTAL2 BullRun Trigger Identified!👋 Welcome to TradeCityPro Channel!
Let's go together to examine and analyze the Total 2 chart in the Dominance section, which includes all cryptocurrency coins except Bitcoin in its chart.
🌐 Overview Bitcoin
Before starting the analysis, as usual, we wanted to take a look at Bitcoin in the one-hour time frame, but we made an interesting decision with the team guys and decided to analyze Bitcoin for you every day with a poll that we posted in Telegram. Today's analysis was also uploaded before the start of the New York session and you can see it from the link below.
📊 Weekly Timeframe
In the weekly time frame, we were rejected from our ceiling, which is an important point of $1.62 trillion, and this makes the ceiling more and more important for us than ever.
Let me also tell you a teaching point that I just pointed out to you on a candle on the chart, and these candles are mostly made at the market ceiling or a place where At least we are going to get rejected from it and it is an important resistance for us and they are usually red and have a longer shadow than the body from below. I suggest you watch them for a while so I can teach you.
Also, if you are looking for an entry trigger for bull runs and spot purchases and anything else, your best trigger will be on the weekly time frame at 1.62 and after the break, good money will enter the market and our new primary trend will be formed and I will definitely enter myself.
We also had another entry with the resistance level of 662 billion and it was mostly Ethereum, Solana and Link that we tried very hard to break 662 and be with it and I will try just as hard to break 1.62 and enter it. We are currently at the support of 1.13 and in case of a deeper market correction, we will move to the levels of 974 and 817.
📈 Daily Timeframe
On the daily time frame, the total two is very good and this shows that Alt Coins above rank 30 did not make a very deep correction, and if you look at the charts that you see had a deep decline, they are still correcting, and the main reason for the chart being this way is Solana, XRP, BNB, and SUI.
Also, after breaking our good daily trend line and breaking the 974 billion box ceiling, we experienced a very good upward movement and moved to the 1.55 level and the important ceiling, and we actually suffered a heavy rejection, but because it was because of FOMO, we could not count on its resistance, but the pullback and future rejection formed the important resistance price of 1.55.
After forming a daily range box of 1.32 to 1.55, which we had been suffering for a while, and the recent series was very weak, and it caused us to suffer a rejection halfway through and break the 1.32 support in a sharp manner and come to the 0.5 Fibonacci support, which is very important both in terms of Fibo and also in terms of Dow. 50% correction is very important and this could be the place where the price rises
We will probably stay on this support for a while and suffer and then move up and if we lose 1.17 we will go for lower levels like 1.09 and 974 billion but the most important support that should not be lost is 797 billion but there is a long way to go
📝 Final Thoughts
Stay calm, trade wisely, and let's capture the market's best opportunities!
This analysis reflects our opinions and is not financial advice.
Share your thoughts in the comments, and don’t forget to share this analysis with your friends! ❤️

TradeCityPro | Bitcoin Daily Analysis #1👋 Welcome to TradeCityPro!
This is the first analysis in the Bitcoin series on the channel, which will be uploaded daily. In this series, we will analyze futures triggers that can provide us with positions on the same day. Therefore, most of the analyses will be conducted in lower timeframes.
✨ However, in today’s analysis, I will also cover Bitcoin in higher timeframes since this is the first analysis and needs to be comprehensive.
📅 Weekly Timeframe
In the weekly timeframe, we see a strong uptrend where the last leg started from the 54,900 bottom and moved up to the 104,700 resistance. The candle volume has been mostly bullish, aligning with the uptrend.
🔍 Currently, the price is resting below the 104,700 resistance, and the last weekly candle, which closed just yesterday, resembles a rolling pin, indicating indecision among buyers and sellers as the price moved both up and down but ultimately closed in a range.
💥 In RSI, there are two crucial support levels. The first is at 61.85, which RSI is currently near, and if it reacts positively to this level, a new bullish momentum could enter the market. The next support is at 43.90, a critical level for market momentum. As long as RSI stays above this level, bullish momentum remains in the market.
🔼 For the next bullish leg to start, RSI likely needs to enter the overbought zone, attracting more buyers and initiating the next wave. In terms of price action, breaking the 104,700 resistance would be the best trigger for the next move.
⚡️ On the other hand, the price has so far corrected to the 0.236 Fibonacci level near 90,000 and still has the potential for further corrections. If it continues, the next support levels are at the 0.382 and 0.618 Fibonacci zones, which overlap with 81,800 and 70,000, respectively.
📣 Since this series will have daily updates and we will analyze the weekly timeframe after each weekly candle closes, I won’t discuss lower supports or higher resistances until the time is right.
📅 Daily Timeframe
In the daily timeframe, the price is ranging between 91,925 and 106,612. As seen, the price has been rejected from the range high for the second time and has dropped to 96,312.
🧩 Bearish momentum has been decreasing since reaching the 96,312 support, and a rounding formation is gradually forming. A positive aspect is that if Bitcoin establishes a bottom in this zone and moves toward the range high again, it will create a higher low compared to the 91,925 support, increasing the chances of a breakout to the upside.
📊 The volume of the last red candles in the bearish leg has been quite low. In the two recent green candles from yesterday and today, the volume is also very low, meaning the price might soon start its movement. So, it’s best to move to lower timeframes to find a suitable futures trigger.
⌛️ 4-Hour Timeframe
In this timeframe, I won’t analyze much but will instead focus on identifying futures triggers.
🔽 For a short position, the setup is quite clear. There is a solid trigger at 95,798, which the price has tested multiple times, making it a reliable trigger. Since this short position is being opened within the range and near the range low, it should be taken quickly and secured at low risk-to-reward ratios like 2 or 3. It is not an ideal trigger for a long-term trade.
📈 For a long position, the first trigger was the breakout of 97,304, which has already happened, and the price has confirmed above this level. If you haven’t taken a position on this breakout, you can enter on a pullback if a suitable candle forms or if there’s a trigger in lower timeframes. Keep in mind that this trigger is the riskiest, so enter with minimal risk.
✔️ The next long trigger is at 98,937, which is more reliable. If the price stabilizes above this level, we can expect a bullish leg toward the range high.
⌛️ 1-Hour Timeframe
In this timeframe, as seen, the price is pulling back to the 97,304 level while engulfing the previous red candles. RSI is also stabilizing above 64.12. If the candle closes as it is, a long position will be suitable. The key resistance level is at 99,730.
📉 For a short position, the trigger remains similar to the 4-hour timeframe. However, since the price has faked this level in this timeframe, we should wait for another reaction at this area to confirm the actual trigger point.
⭐️ Now, let's analyze the dominance charts. A full dominance analysis will be provided separately. The Total2 analysis will be posted tonight, and the USDT.D and BTC.D analyses will be done tomorrow, but for now, they will be reviewed in the 1-hour timeframe.
⌛️ BTC.D Analysis
In the 1-hour timeframe, we see Bitcoin dominance increasing after reaching the 61.34 bottom, which has contributed to Bitcoin’s recovery following the fake breakdown at 95,798.
👑 If dominance stabilizes above 62%, more money will flow into Bitcoin. In this scenario, if the market moves upward, Bitcoin will rise more than most altcoins, and if the market drops, Bitcoin will decline less than others. The main resistance is at 62.66.
💫 On the other hand, if dominance falls below 61.34, less money will enter Bitcoin. In a bullish market, Bitcoin will underperform altcoins, and in a bearish market, Bitcoin will drop more significantly.
⌛️ Total2 Analysis
In the 1-hour timeframe, the 1.22 level in Total2 overlaps with 97,304 in Bitcoin. However, as seen, Total2 is still below this support and hasn’t confirmed above it yet. The reason is the increasing Bitcoin dominance, causing altcoins to move less than Bitcoin.
☀️ The main resistance in Total2 at this timeframe is 1.28, which is also the key long trigger.
🔽 For a short position, Total2 offers a better trigger than Bitcoin. If Total2 breaks below 1.16 while Bitcoin dominance increases, shorting altcoins will be a better option than Bitcoin.
⌛️ USDT.D Analysis
As seen, the candle has closed below the 4.51 support in this index, and it has more overlap with Bitcoin than Total2.
✔️ The trigger for an increase in USDT dominance is 4.64, which would lead to a market decline. The alignment of this trigger with the short triggers in Total2 and Bitcoin could provide strong confirmation for those trades.
🔑 For a long position, breaking below the 4.40 support in this index would be a good signal. The main support is currently at 4.22, and if this level is broken, the market could begin its next bullish leg.
📝 Final Thoughts
This analysis reflects our opinions and is not financial advice.
Share your thoughts in the comments, and don’t forget to share this analysis with your friends! ❤️

TOTAL 2 repeating the same pattern of cup&handle also a line witrepeating the same pattern of cup&handle also a line with the 50 EMA and 61% Fibonacci level

About to Sell Your Altcoins? STOP & Read This First!!🚀 Hey Traders! Ready for Altcoins’ Next Big Move? 👋
If you’re finding value in this analysis, smash that 👍 and hit Follow for high-accuracy trade setups! 💹🔥
I know many are frustrated and losing hope in altcoins due to the current market conditions. But selling your spot holdings now—right before a major move—could be the worst decision of your trading journey. Before making any rash decisions, read this update carefully! 👇
📊 What is Total2?
Total2 represents the total market capitalization of all cryptocurrencies except Bitcoin (BTC). It helps us gauge the strength and momentum of the altcoin market.
💡 How to Use Total2 in Trading?
📉 If Total2 is falling → BTC dominance is high, and altcoins are struggling.
📈 If Total2 is rising → Altcoins are gaining strength, signaling a possible altseason.
🔥 Altcoin Market Cap (Total2) Looks Bullish!
✅ Breakout Alert! Total2 has broken out from a cup and handle pattern on the weekly time frame and successfully retested it. This setup is a classic bullish signal, suggesting a strong rally could be on the horizon.
🚀 If this pattern plays out, altcoins could skyrocket! Be patient—your altcoin holdings may soon reward you in a big way.
⚠️ Invalidation Level
If Total2 closes below $1 Trillion on the weekly timeframe, the bullish outlook weakens. Until then, the upside potential remains strong!
💬 What’s Your Take?
Are we about to witness an altcoin explosion, or will BTC continue to dominate? Drop your thoughts in the comments! Let’s ride this market together and secure those gains! 💰🔥

TOTAL 3Everything is clear; just look at the past chart. There are two scenarios. In any case, we should see a sharp move in altcoins soon.
My personal opinion is that the blue box scenario will play out within the next 2 to 6 months. If Ethereum rises above $3,000, altcoins will begin their growth.

TOTAL2 - Support Found Above Down Trend Down trend in white has become a support level for price on this Weekly timeframe for this altcoin market
This is also within a small up channel forming
I expect further upward movement in the coming weeks
1T has a big support
BTC & ALTCOINSIn this chart we can see Bitcoin historical Highs , lows , halving years (green->green) and halvings ... we can see some patterns here , not price patterns but sessionality patterns .. for example .. strong probabilty next btc HIGH will be in November/December this year , or we can also see on chart of BTC.D .. we are close to date when BTC.D breaks and fall as much as alts shine .. But all of this was history what about today ? What if , in this one cycle is something different , for example players ... Old good BTC and Crypto OG players now have less power as manipulators , we have some guys from wallstreet also here , Trump and much more .. Macroeconomic was totaly changed ... so what do you think guys ?

$TOTAL2 vs $USM2 RatioIn the crypto world many analysts watch the Money supply called M2 closely to determine the direction of the market. During the last crypto cycle, the CRYPTOCAP:TOTAL2 index (Crypto Market Cap without CRYPTOCAP:BTC ) hit an ATH when the M2 hit 21.75 Tn $. Since then, the M2 Money Supply has been trending down which resulted in a major bear market in the Alt Coin space.
If we look at the chart of CRYPTOCAP:TOTAL2 vs ECONOMICS:USM2 we see that the chart hit an ATH on Nov 21 with M2 peaking in March 22. The ratio chart hit a low on Jan 23 with M2 hitting the cycle low on Mar 23. Since then, the CRYPTOCAP:TOTAL2 vs ECONOMICS:USM2 has shown a steady recovery with an increased money supply. The current level of M2 is still below the peak of March 22. But with increasing M2 we can expect a bull run in the Alt coin market including $BTC. There have been recently some weaknesses in the chart on a short-term basis. Let’s see how the chart develops on a medium-to-long term. Until then watch out for this space. CRYPTOCAP:BTC CRYPTOCAP:TOTAL2 ECONOMICS:USM2

TOTAL2 x TOTAL3 #Altcoins in general have not seen the parabolic run phase yet so we are far from the local peaks of the 2025 bull run!

TOTAL2 / BTC ALTS Should be Close to BottomingWho remembers this chart I posted a month ago on TOTAL2 / BTC ?
This was the one that TradingView shared of mine on 12/31/24
Called the double bottom here. My squiggles are undefeated.
Alts should be close to the end of bleeding.
One last flush I presume (hope) 😂

TOTAL Crypto Cap. Who called 800-pound Gorilla to enter a chatThe influence of Donald Trump on cryptocurrency markets has been a topic of significant discussion, particularly in light of his recent inauguration and the launch of various crypto-related initiatives. His evolving stance on cryptocurrencies, particularly Bitcoin, has led to both volatility and optimism within the market. This overview explores the implications of Trump's actions and statements on the cryptocurrency landscape, focusing on the factors contributing to market fluctuations and the broader economic context.
Trump's Evolving Stance on Cryptocurrency
Historically, Donald Trump has had a mixed relationship with cryptocurrencies. Initially dismissive, he referred to Bitcoin as "based on thin air" and a threat to the U.S. dollar. However, as his US-elections campaign progressed, his views shifted towards a more favorable outlook. In recent pre-elections statements (usual populist election rhetoric), Trump has expressed intentions to position the U.S. as "the crypto capital of the planet", for example.
This shift aligns with a broader trend where economic uncertainty has made alternative assets like Bitcoin more attractive. During Trump's first term, Bitcoin's price skyrocketed from around $1,000 to over $40,000, reflecting increased interest in cryptocurrencies as a hedge against traditional financial instability. Following his reelection in 2024, Bitcoin surged past $100 000, attributed in part to renewed investor confidence driven by Trump's pro-crypto rhetoric and cabinet appointments.
The Launch of Memecoins and Market Volatility
The recent launch of memecoins associated with Trump, such as $TRUMP and $MELANIA, exemplifies the volatility that can arise from his influence in the crypto space. These coins saw dramatic price fluctuations shortly after their introduction; for instance, $TRUMP's market capitalization soared to $14 billion before experiencing a significant crash. This volatility raises concerns about market manipulation and the sustainability of such speculative assets.
Factors contributing to this volatility include:
Market Saturation. The cryptocurrency market is highly competitive, with thousands of coins vying for attention. New entrants can dilute demand for existing coins, leading to price declines.
Lack of Utility. Many memecoins lack inherent utility or clear use cases, making them susceptible to speculative trading rather than long-term investment.
Regulatory Uncertainty. The evolving regulatory landscape can create unpredictability in the market. Trump's administration has indicated support for crypto-friendly policies; however, regulatory frameworks remain unclear.
The United States of TRUMPAMERICA
Trump's presidency coincides with heightened economic uncertainty due to various pro-inflationary factors, including US-centric tariff policies, trade wars and geopolitical tensions.
Despite initial optimism following Trump's election victory, there are concerns about whether his administration can deliver on its promises regarding cryptocurrency regulation and support. While some investors have benefited from short-term price surges attributed to Trump's influence, questions remain about the long-term sustainability of these gains.
Regulatory Developments and Future Implications
The establishment of a crypto task force under Trump's administration aims to create a comprehensive regulatory framework for digital assets. While this initiative is viewed positively by many in the crypto community, it remains uncertain how effectively it will address existing challenges within the market.
Technical Challenge
The main technical graph for CRYPTOCAP:TOTAL Crypto Cap indicates on Bearish trend in development, since "Double Top" technical figure has occurred a day before Mr. Trump entered the room.
The minor RSI (14) chart indicates also that Bullish optimism is getting sluggish so far.
Conclusion
Donald Trump's influence on cryptocurrency markets is multifaceted and continues to evolve. The recent volatility associated with memecoins underscores the speculative nature of digital assets while highlighting the broader impact of political fart on investor sentiment.

UPDATE: Altcoin Market Set to Surge Toward $1 Trillion Should this pattern hold, we could see the altcoin market targeting full Fibonacci extensions, potentially ripping to all-time highs and pushing the market toward a $1 trillion valuation this cycle.
Momentum is building as liquidity returns to the crypto markets, with growing retail interest and institutional capital eyeing opportunities in diverse altcoin sectors. Rotation out BTC is happening as the BTC rally is losing momentum.

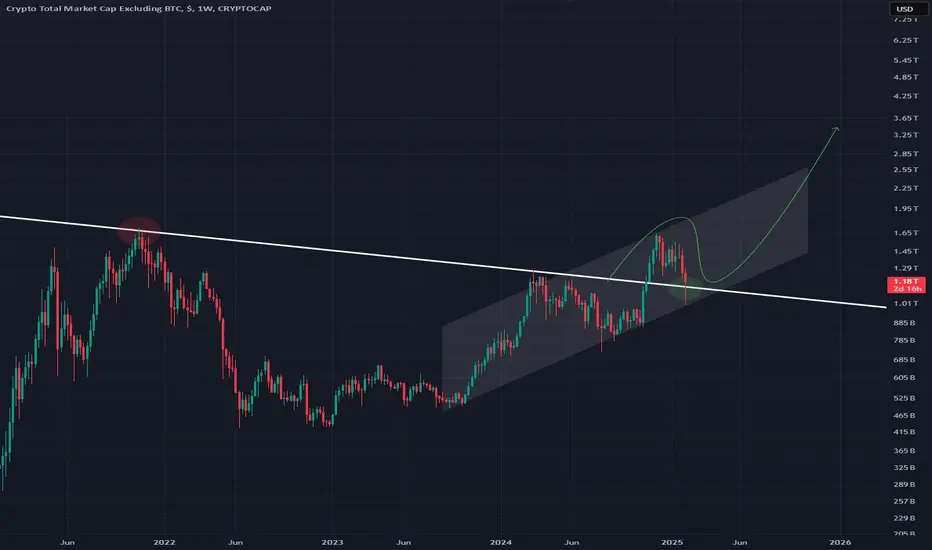
Total Crypto Market Cap Excluding BTC The total cryptocurrency market cap, excluding Bitcoin, is poised for a significant surge in altcoins once it breaks out of this triangle pattern. Expect a substantial upward movement in altcoin prices following the breakout.

Alts market cap TOTAL2-TOTAL3 bull flag#Altcoins market cap TOTAL2 and TOTAL3 1D chart
bull flag formation breakout and retest completed!

Total2 Market Cap vs BTC Market CapToday we are looking at ratio charts. We plot the ratio of Total 2 Market Cap (Total Crypto Market Cap excluding BTC) to BTC Market CAP. This ratio chart is making new lower highs this BTC Halving cycle. There seems to be no bounce from the lows and Alt coin season seems to be elusive. As we move towards the end of the halving cycle there is very little time left for this Alt season. To reach the previous cycle highs of 1.5 in the chart the Alt Coins have to more than double from here and BTC must remain at this price for the rest of the cycle. For this the total Crypto market cap must reach almost 5 trillion USD, which remains unlikely. A better estimate will be the ratio of Total 2 Market Cap vs BTC Market Cap ratio reaches 1.09 which will be 0.618 Fib retracement level. This 0.618 fib retracement repeats in many instances. The same is true for BTC.D. What do you think?

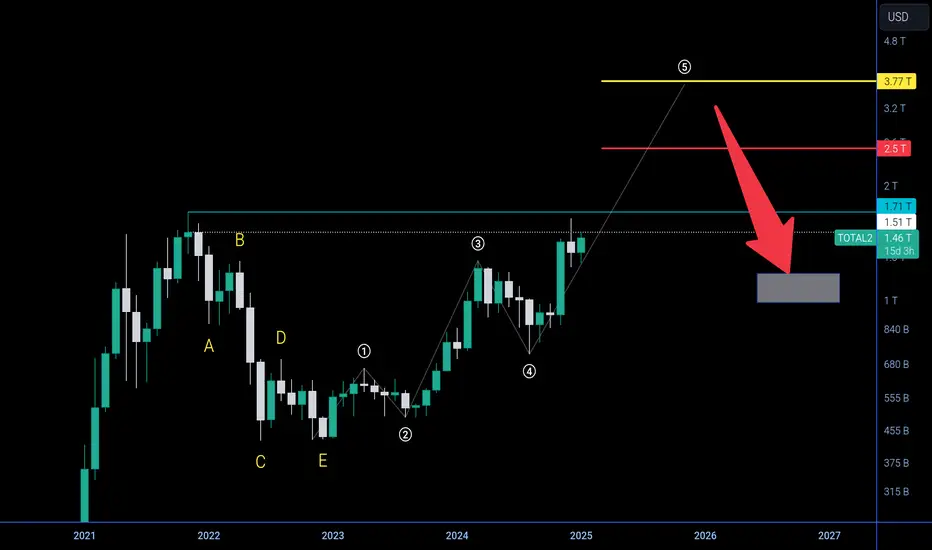
Total market cap 2 - macro analysis ( expect $BTCUSD ) Hi 👋🏻 it's me your " Raj_crypt0 " is back 🔙 🎩
CRYPTOCAP:TOTAL2 ( TOTALMAKETCAP2 ) crypto long run analysis ⏰ was here ..... ❣️
" It's important to close strong monthly above $1.71T " which makes bullish road clear "
🎯 ¹ - $2.5T ( 2.5 trilion dollars )
( When $2.5T was done before APRIL 2025 then , we aim for target 2 , if not it will turn as TOP 🔝 )
🎯 ² - $3.77T ( expecting potential TOP around 4 trillion dollar 💰 )
•
Note >>
don't think 🤔 all coins will complete " BULL RUN " 🔝 target's at index TOP 🎩
It depends on currency some complete " BULL RUN " at 1st target 🎯 some complete 💯 at 2nd target 🎯 INDEX ☝🏻 always show way to get exit and entry on entire portfolio 💰
( Yes 🙌🏻 i provided even " BEAR RUN " target 🎯 also but we can discuss later based on 🔝 )
#Altcoins TOTAL2\TOTAL3\TOTAL #Altcoins TOTAL2\TOTAL3\TOTAL
Crypto will destroy you mentally before rewarding you financially!
Only the strongest minds will win!
