(TOTAL2) Alt coin market cap!!!!!Alt coins are bloody, the market moves based on Demand and Supply
If we go back to our chart, we can see here that there is not much demand in that area, between 600B to 680B.
In our previous data, in that area there was a good upward impulse movement, but now the sellers are more aware.
We can go back to the 400B range of the Alts marketcap, and we can still feel the price drop in some of our altcoins across the market.
be careful when positioning trades on different alt coins. Don't over trade too much. Relax and enjoy different things first to avoid big losses in the market.
PS: 400B support + Moving average 200 ; massive buying zone.
Happy trading!!
TOTAL2

#altcoins will have a blood bath?Here' s the #altcoin #totalmarketcap incl. #ethereum . This chart shows , altcoins' market cap have come to the top of the channel. Declination here is will doom altcoin bag holders. Clear breaking channel with volume and weekly closings is the invalidation. I showed the support levels on the chart. The war is not good for markets, a friendly reminder. Always use stop losses. I don' t say buy or sell , always train yourself and this is NOT FINANCIAL ADVICE.

TOTAL2 - Falling WedgeA large falling wedge structure which is a bullish structure
This will be a break out of a larger long term structure that the falling wedge is encompassed in
The structure on the Weekly is quite flat, we might see Uptober for bitcoin and altcoins.


TOTAL2 - Retesting this Horizontal SupportTitle really says it all, simple support that is trying to be held.
TOTAL2 has been sitting around 500 - 550B for awhile now which is a bullish sign. Patience pays.
This is the 4Hr chart used to get a closer look at this support level.

Structural Similarities - TOTAL2The formation we are seeing now which is a potential bottom is similar in my eyes to what was seen before the massive moonshot on total2 post 2016
will there be a follow up run?
I am very bullish right now on TOTAL2 and cryptocurrency.

Golden Pocket Rejection We dropped down to a swing failure pattern May 12th. (a long wick down). We then sprang back up on the 15th to create a small range for the month of May. The low and high of that range used to pull the fib and find a golden pocket at 1.15 trillion . We have left that range long ago but since rejected from it twice. I wonder if we will retrace to the POC below and continue ranging? My gut says we go down but that doesn't mean anything really.
Now here's the thing. If you zoom out 100% and draw a fib from the lowest low to the highest high you will see the golden pocket is.........1.15 trillion. I cant make this stuff up.

TOTAL2 Hi Folks,
What is TOTAL2?
🔺For our new members:
--Total: It is the data that shows the total value of the entire cryptocurrency market.
--Total2: It is the data that shows the total value of all altcoins (excluding Bitcoin).
🔺Our Total2 data reached a record high of $1.70 trillion during the previous rally, followed by a sell-off wave that led to a drop to a local low of $435 billion.
🔺During this period, we witnessed many altcoins being delisted from the market or experiencing drpos of up to 90% in value, which was quite painful to watch.
🔺Technically speaking, we can say that this data set, which broke the downtrend, exhibited a consolidation performance in the first half of 2023.
🔺While tracking TOTAL2, we should not forget about stablecoins. It would be overly optimistic to say that the money exiting Bitcoin will flow into altcoins because we are currently not in a "bull rally" phase. The money leaving Bitcoin can also enter stablecoins.
🔺In the previous paragraph, I want to convey the following: It is now overly optimistic to say that if BTC.D (Bitcoin dominance) decreases, altcoins will rise. The money leaving Bitcoin may enter stablecoins, which could cause an increase in the TOTAL2 data, but it does not necessarily mean that altcoins will increase.
Things to Know Before Investing
🔺In the second part of this article, we will discuss what needs to be known before making investments.
🔺First and foremost, we are currently in a consolidation zone from a technical standpoint, as you can see on the chart. The decisions of the Federal Reserve (Fed) will directly affect this consolidation process. Especially on the day this article was written, there is an 80% probability of a 0.25 basis point interest rate hike at the next Fed meeting.
🔺Even if the Fed ends the interest rate hike process, experts predict that interest rates will remain high until 2024, and 10-year bond yields are already above 3.50%. While interest rates are at such high levels, it is still too early to expect a significant bull season for risk assets.
🔺As if the Fed alone is not enough trouble, we also have the Securities and Exchange Commission (SEC) going after altcoins. In recent days, the SEC filed lawsuits against both Binance US and Coinbase. However, to understand these lawsuits most simply, it is necessary to look at the Ripple case, which has been fighting against the SEC for years. The outcome of this case is likely to set a precedent.
🔺There is one important thing not to be forgotten: Even ETH was distributed/sold at very cheap prices to raise the necessary funds during its initial sale (approximately 16%). Unfortunately, this harsh reality exists for altcoins, and unreliable projects are prone to failure. Bitcoin, on the other hand, stands apart from altcoins as it never had an initial sale. We will address this topic again in another article.
Technical Data
🔺Altcoins haven't died; they are struggling to survive and providing buy-and-sell opportunities with high-profit margins to investors who use the right channels.
🔺Looking at TOTAL2, we can see that the downtrend was broken in January 2023, and it is consolidating and gathering strength before the next bull rally.
🔺$1.06 trillion is a critical pivot (fib 0.5). If there are closing prices above this level, we can say that the bull market has arrived. Otherwise, it will still present reasonable profit opportunities but will remain a reaction rally.
🔺Additionally, during the 2017-2018 rally, there were around 1,000 (let's leave the exact number to those who remember) altcoins, whereas currently there are over 25,000 altcoins. Choosing the right altcoin is crucial when there is a significant amount of money in the market. The number of slices in the cake has increased at least 25 times.
🔺Currently, the TOTAL2 data is testing the "AlphaTrend Sell Zone" resistance at $540 billion. If there are no closing prices above this level, selling pressure could increase.
🔺While the MACD generates buy signals, the RSI is struggling to break the 50-point resistance on the daily chart. If the RSI can close above 50 points, we can anticipate an acceleration in the upward momentum; otherwise, we expect increased selling pressure.
Bonus Chart 1: BTC.D 1W
🔺Bitcoin dominance continues to increase. Closing prices above 50.15 points can push Bitcoin dominance up to 54 points, which is expected to hinder the strengthening of the TOTAL2 data.
Bonus Chart 2: BTC.D vs ETH.D (Last 1 Month)
🔺In the past month, we witnessed Bitcoin dominance surpassing Ethereum dominance. But why?
🔺In its simplest form, we can say that the applications for spot ETFs for Bitcoin have played a role in this.
Dear reader, if you have read this far, I'm sure you have enjoyed it. You can give me feedback by liking and commenting. And if you happen to click on the share button, you can share this knowledge with people in your circle and together we can become stronger.

TOTAL2Hello
TOTAL2 has broken down an important trendline and all in all shows us that we will have super bearish market.

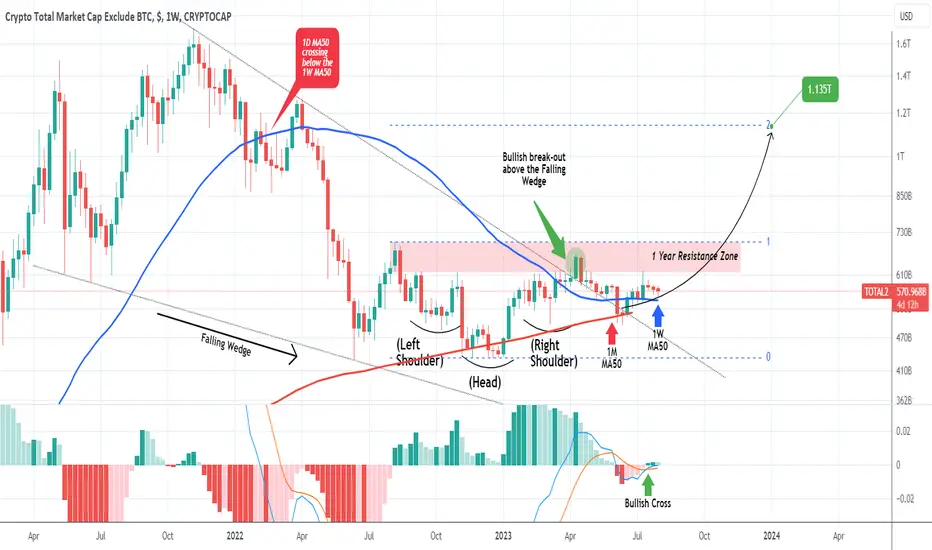
ALT COINS are well supported, waiting for a new High.The alt coin market (TOTAL2) following April's break-out above the Falling Wedge of the Bear Cycle that started in mid 2021, has pulled-back, tested both the 1W MA50 (blue trend-line) and 1M MA50 (red trend-line) as Supports. Currently we are seeing the 1W MA50 holding, having closed the last 6 candles above it. The technical Resistance is the 1 Year Zone within 618 (where the price got recently rejected) and 700.
On the long-term though, the Wedge break-out along with the formation of the Inverse Head and Shoulders (IH&S) pattern, targets much higher and more specifically the 2.0 Fibonacci extension at 1.135T.
Note that in the meantime, the 1W MACD completed a Bullish Cross 2 weeks ago, the first this past year (since August 08 2022).
-------------------------------------------------------------------------------
** Please LIKE 👍, FOLLOW ✅, SHARE 🙌 and COMMENT ✍ if you enjoy this idea! Also share your ideas and charts in the comments section below! **
-------------------------------------------------------------------------------
💸💸💸💸💸💸
👇 👇 👇 👇 👇 👇
Bearish 5-0 on (Total 3 Excluding - LTC and Stablecoins)There is a Bearish 5-0 visible on the Daily on the Total Market Cap Ex- BTC, ETH, LTC, and the two big USD-based Stable Coins; if it plays out, I think Total 3 will make a new low that will likely take it down to the macro 0.886.
We also have some Hidden Bearish Divergence on the RSI to back it up.

The Real Golden Pocket is 1.15 T Total Market full chart 100% zoomed out Fib from low to high = Golden Pocket 618 at 1.15 Trillion.
Guess where we just rejected from? hmmm....

TOTAL 2 ANALYSIS (1D)We see a lot of bullish signals on the chart of altcoins and bitcoin, but total2 says something else.
We should keep an eye on this chart because it is a way forward. The red area is really where total2 can go downhill
After the completion of the e wave of the big D wave triangle, we prepare for the descending wave E
The time frame is daily and time consuming

USDT.D DAILY : MARKET ROADMAPHi guys Hope you well.
UMM , As I said before this chart can show us the roadmap of crypto market . now I expect to go the demand box and then pullback , we have same area in bitcoin and total market cap chart .
use this chart for your trade.
SecondChanceCrypto
⏰25/JUNE/23
⛔️DYOR
Always do your research .
If you have any questions, you can write them in the comments below.and I will answer them.
And please don't forget to support this idea with your likes and comments.

TOTALMARKETCAP :CRYPTOHi Guys Hope you well.
As it was said, the downtrend channel was broken and made a significant growth. Now I am waiting to reach the daily supply area, after which we can move towards the trend again. Just note that due to the dominance of Bitcoin, the status of other altcoins is different from Bitcoin.
SecondChanceCrypto
⏰25/JUNE/23
⛔️DYOR
Always do your research .
If you have any questions, you can write them in the comments below.and I will answer them.
And please don't forget to support this idea with your likes and comments.

Bitcoin Dominance & Total2Bitcoin Dominance Index (BTC.D) - calculated index that shows the ratio of bitcoin capitalization to the rest of the cryptocurrency market. CRYPTOCAP:BTC.D
It directly demonstrates inflow and outflow liquidity into the first cryptocurrency, due to which the investor gets the opportunity to predict a potential “altcoin season”
TOTAL2 - crypto market capitalization excluding bitcoin capitalization. An indicator showing the inflow of liquidity into altcoins.
Correlation
As a settlement index, bitcoin dominance is correlated indicator, and has a number of properties that can enable the investor to predict potential market changes:
Here is example of potential movements between this 3 charts
Hope you enjoyed the content I created, You can support with your likes and comments this idea so more people can watch!
✅Disclaimer: Please be aware of the risks involved in trading. This idea was made for educational purposes only not for financial Investment Purposes.
---
• Look at my ideas about interesting altcoins in the related section down below ↓
• For more ideas please hit "Like" and "Follow"!

TOTAL2 - Daily Inverted H&SInverted head and shoulders structure is completing itself on the daily timeframe for the altcoin market cap (TOTAL2).
The right shoulder has potential to show extremely bullish results as is normal with inverse H&S patterns.

$BTC -Buy Opportunity- Bitcoin is sitting at a good buying opportunity on different perspectives
(long-term investing DCA, mid-term bounce- short term craze) ;
in the midst of TVC:DXY plunging today
Currently trading at Strong Zone of Support :
- S/R area
- Its Support of Golden Zone of 15K low to 31K High (CHoCH uptrend)
-Demand Zone
Looking for CRYPTOCAP:TOTAL2 as well to make some moves ( CRYPTOCAP:BTC.D should be surveyed)
TRADE SAFE
*** NOTE that this is not Financial Advice !
Please do your own research and consult your Financial Advisor
before partaking on any trading activity based solely on this Idea .

TOTAL2 LONG IdeaWe can see a clear Inverse Head & Shoulder Pattern that broke up, the long target is just at MA200 in 4hours chart. We should wait for retest confirmation to open long positions on Altcoins. Remember to manage your risk and Use stop lost in all your positions. I will update this Idea later.

TOTAL2 - Looking at the RSIDrawing channels on the RSI shows that we are nearly due for another up tick
This is the total market cap chart, TOTAL2
Weekly timeframe

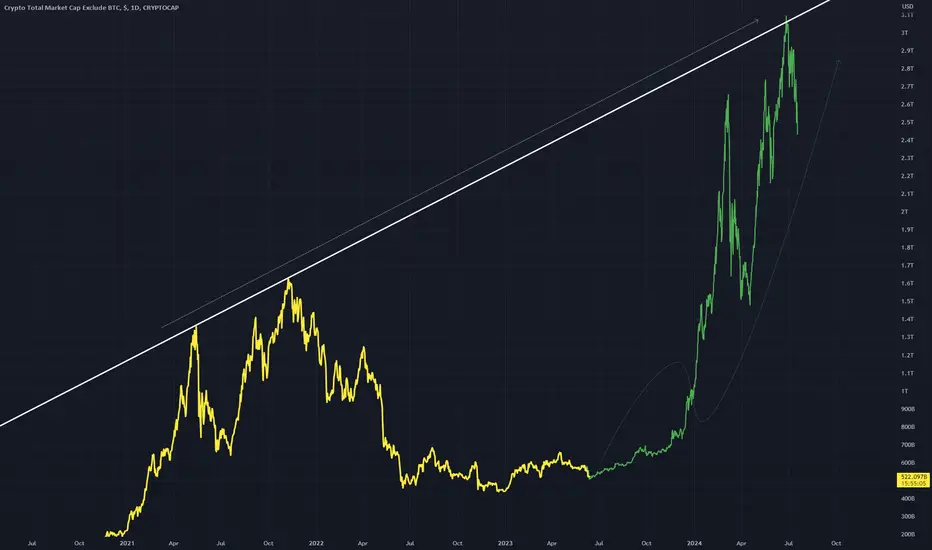
TOTAL2 - Higher High Trend LineDrawing a trend line along the higher high that formed in prior bullrun puts forecasted MCAP at about 3T
The bars pattern might be a bit off but this is a massive move regardless.
BULLISH
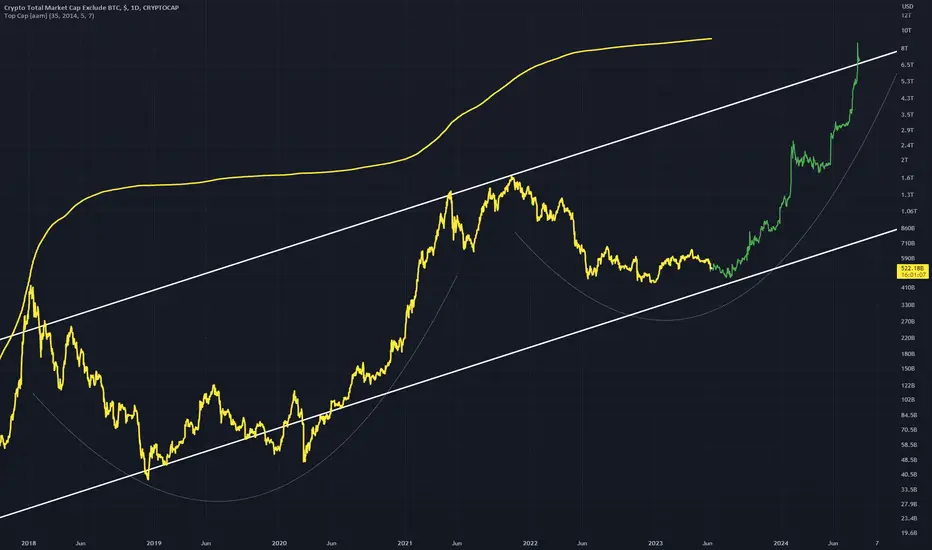
TOTAL2 IdeaIn idea showing a large up move on the market cap chart
I don't think the current market cap is appropriate at all. We are yet to see the top.
The yellow line shows top points, with the last top being hit in 2017.
The last bull run in my mind was a sort of quasi bull run, leading to the one we are about to see.
Expanded Flat -> Triple-BottomTotal2 looks like an expanded flat completing its reversal at the end of a C wave.
It has twice bottomed just shy of the 1.618 for its trend-based fib, and may or may not reach a 3rd bottom near this area before exiting above its neckline.
If it doesn't reach bottom again, it's possible it could perform a move similar to what INDEX:BTCUSD did here:
However, it has so far failed to maintain a breakout if we draw a similar wedge on Total2:
A 1x measured target lines up with its 50% trend-based fib, while the 2x measured target for the triple-bottom lines up exactly with its 0% fib, exactly where total2 reached its ATH.
This would go in line with my theory that movements in DXY could lead to recoveries across multiple markets that end in double-tops.
