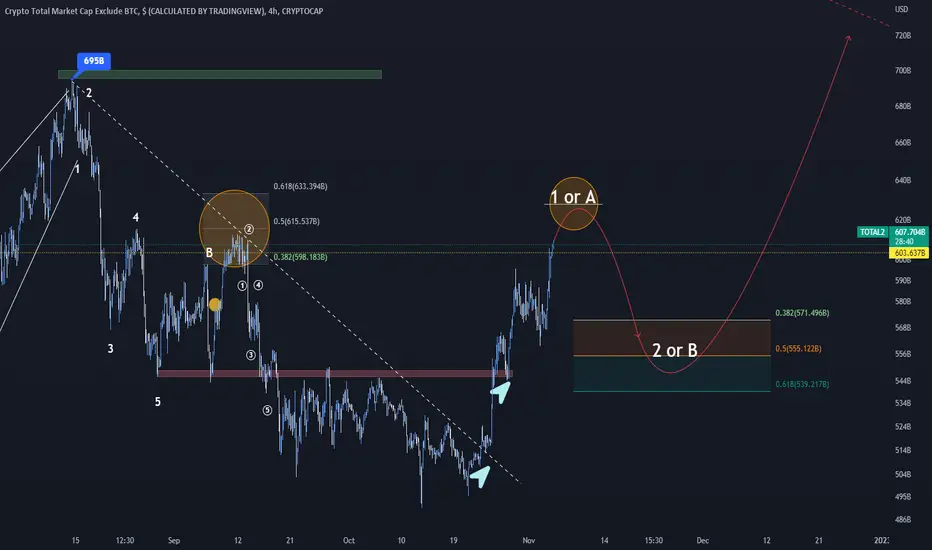
Altcoins channel cross⭐️occurred as predicted in November🚨🚨🚨Altcoins channel cross⭐️occurred as predicted in November🚨🚨🚨
A channel cross can signal the "bottom is in" since we saw lowest low in the red main bear run
We are now in the gray accumulation phase
Let me know your thoughts in the comments🤗
⬇️⬇️⬇️
Likes and Follow for updates appreciated🤗
Disclaimer:
Not financial advice
Do your own research before investing
The content shared is for educational purposes only and is my personal opinion
TOTAL2

Altcoin marketcap total2 usdAltcoin marketcap total2
tether usdt long support
exclude btc bitycoin ether xrp

Daily Bitcoin Update - SPX & ES1 are running out of roomMorning all,
Not a great deal has happened since yesterday. We are still waiting to see if this Inverse Head and Shoulders play out which would see the Bitcoin price move to around $18000. I am not totally convinced that we will see a break higher at this stage.
SPX and ES1 are both trading under heavy resistance being at the top of the patterns. Tick tock for those to see if they can break higher. If they do we might well see a move higher from Bitcoin.
Short positions are still being stacked which goes against the current trading pattern which is looking bullish.
USDT dominance also moves higher suggesting that traders are moving back into the tether safehaven.
At the moment there is no clear direction so we have to wait for Bitcoin to signal its intentions.
If you have any questions let me know.
PLEASE HIT THE BOOST BUTTON IF THIS UPDATE IS HELPFUL
Simon BPOI

Yin or YangWhich path should it take?
For me, with the current nosedive of the DXY, it should be Yang.

Total Crypto cap vs non BTC vs Non BTC & ETHAll #cryptomarket
Total
Vs
#crypto minus $BTC
Total2
Vs minus
#BTC & $ETH = #altcoins
Total3
Things to notice:
Jan 1 #Bitcoin began to weaken (look @ sell volume in that time frame) vs others
#altcoin are much weaker now - Look @ blue lines

TOTAL2 as Altcoins IndexLike If You Like
By last days Falling, TOTAL2 managed to attracting Liquidity in about 462 billion. In next step, I expect to rising to red zone that shown at chart.

altcoin marketcap 1 day total2altcoin marketcap 1 day total2
exclude btc
bitcoin
binance dollar tether usdt

#TOTAL MARKET CAP IMPORTANT UPDATE MUST READ!!Hi guys, This is CryptoMojo, One of the most active trading view authors and fastest-growing communities.
Consider following me for the latest updates and Long /Short calls on almost every exchange.
I post short mid and long-term trade setups too.
Let’s get to the chart!
I have tried my best to bring the best possible outcome to this chart, Do not consider financial advice.
TOTAL MARKET CAP UPDATE
As you can see in the chart or absorb in the chart here TOTAK MARKET CAP is making this falling wedge pattern as same it marked in 2018 and dropped 43% and invalided this pattern that was the last drop of the bull market.
Technically as we all know that this is a bullish pattern if this pattern breaks up out and test successfully then we can accept a bounce technically but if it Breaks down 700 billion support then it may drop almost 40%. Yes same as it was done in 2018.
This chart is likely to help you make better trade decisions if it does consider upvoting it.
I would also love to know your charts and views in the comment section.
Thank you

#TOTAL MARKET CAP 1DAY ANALYSIS BY CRYPTOSANDERSHello dear traders, we here new so we ask you to support our ideas with your LIKE and COMMENT, also be free to ask any question in the comments, and we will try to answer all, thank you, guys.
TOTAL MARKET CAP ANALYSIS UPDATE:-The TOTAL market cap is now back at the mid-June levels. Wait for a daily candle closing for more confirmation. A break below this level is bearish. We may see some sideways movement near the support before the next move.
Sorry for my English it is not my native language.
Hit the like button if you like it and share your charts in the comments section.
Thank you

Total MarketCap BTC ETHtotal marketcap breaks the long term bullish trend . be careful with your money
it means cryptos are exchanging to usd and other currencies. so we will see Red Markets again

TOTAL2 - Developing the Bottom Structure Plotting a bottom along the 4.618 of a strong downtrend Fib Circle
As you can see the price is moving along this thicker green line
I expect the second bottom to occur and consequently a double bottom occurring
Following this double bottom a rise is in order
This is a complementary post to the one below

Total2 ABC Pattern Goes On!As shown on the chart, The Total 2 Chart (Alt-Coins) has a Clean Break-out from 0-B Downward Trendline and after that Breaks the Local High and confirm it with a Clean Pull-Back!
Now The ABC Scenario is the most Likely Scenario to Play Out. at This Moment there is not a great chance for long positions but you can wait for a correction as Leg-B on shown Fibonacci Levels and Fill Your Bags with Crypto to Roll the C - Leg upward movement which will be massive and great Play.
Don't Get into FOMO in these days because it will cause you a loss in your budget but stay in touch and watch the trend for a great buy chance in near futures.
USDTNGN - To drop to 630/$ then rise to 800, 900 & 950/$#Nigerian Naira Rate (Update)
Day after day, the Nigerian currency is losing it’s value. Here is a weekly timeframe analysis. Based on technical analysis, Naira broke it’s major resistance at 630/$ to $710 and pullback is needed to gain momentum for the next run up.
Therefore I expect a fall to 630/dollar before a rise to new price target at 800, 850, 900, 950 per dollar.
Not a financial advice🙅🏼♂️
Share your opinion in the comment section✍️
Please support this idea with a LIKE👍 if you find it useful🥳
Happy Trading💰🥳🤗

[UPDATE TOTAL2] 3 scenarios: A? B? C? It depends on CPI!I'm comfortable with all the 3 scenarios:)
A) Super rally, lower inflation, and then a new inflationary bear cycle
B) Rally, stage 3 and stage 4 of a bear market. New all-time highs in 2026 and 2027.
C) Rally, we go down less than the previous bear markets. More consolidation.

Total 2 be careful with the volatility that could come This zone is specially delicated for how long was the time that the price was lateralizing there , and many indicators are showing bearish divergence so at the end is obviously a strong movement would come in the next days but today and tomorrow the price has higher probabilities to be between the 590/560B .

Total market cap is in the triangle. Let's see if the total market cap can manage to break out of the triangle. In that case we can expect a relief rally.

Total 2 the Crypto Market is doing very bad The Total 2 is in a resistance and we can notice the price doesn't have the enof volume and interest for continue going up

Total Crypto Market Cap Monthly chart looks Amazing!Total Crypto Market Cap Monthly chart
can you see how this is super bullish? Look
at the Ascending Bullish Trendline holding
support perfectly. The DeMark9 Indicator
is showing that there is a super high probability
that the enitre Total Crypto MarketCap is at the bottom.
The 100 Day and the Bull Market Support Band
is at the exact same place on the chart. The
monthly candle only needs to get above and close
above the green line and Bull Market is back in action.
Im looking for us to get there in the coming 30-90 days.

Ascending wedge: The big Altcoin flush out is coming in 2024This feels very plausible, if this happens it's probably the entire space getting regulated similar to what happened to the internet after the dotcom bubble finally reached a melt up point. Prepare for the madness. If this happens bitcoin will not become the new gold standard but instead CBDCs will enslave the world. SDR took over back on August 15, 1971, when President Richard Nixon announced that the United States would no longer convert dollars to gold at a fixed value, thus completely abandoning the gold standard.
Blockchain projects like Ripple Labs and Algorand would become a part of ISO20022 to digitize existing ISO 4217 (XDR) Special Drawing Rights.
"The XDR comes to prominence when the U.S. dollar is weak or otherwise unsuitable to be a foreign exchange reserve asset. This usually manifests itself as an allocation of XDRs to IMF member countries. Distrust of the U.S. dollar is not the only stated reason allocations have been made, however. One of its first roles was to alleviate an expected shortfall of U.S. dollars c. 1970"
Under this scenario: Dogecoin (equivalent to Pets dotcom back in the days), Ethereum (equivalent to Netscape back in the days). Would literally die after 2024.
It's a complete Altcoin flushout and altcoin apocalypse for many.
The new digital Gold, or Bitcoin, would also tank until equivalent to 2003 and would eventually hit new all time high which could be anywhere between 90k to 130k (keep in mind that Gold has only hit 66k per kilogram, so maybe peak is already in for Bitcoin unless Gold hits a new all time historic high). Overtime, Bitcoin and Gold could move together. To think Bitcoin will hit a million dollars under this narrative is not and wouldn't be realistic at all, unless there is hyperinflation in the US amidst a total dollar collapse, something that isn't plausible either, it can maybe hit a 60% low in a few years as other countries in G7 are integrated as global reserves next to the dollar.
This is my honest opinion. The most unpredictable scenario is perhaps the most likely one, and I think this is it. Very concerned about the future of decentralization and what crypto meant. Satoshi would be very disappointed.

Altmarketcap usd 1 weekAltmarketcap usd 1 week
dollar mollar
hadi
to the moon
hedef 2024
dayısı ajan

TOTAL3 is getting even closer to a breakout?look how the Convergence and
divergence with the Price action
and RSI move together...this is an
example of how charts work...we
have never been this oversold...
big things ahead for the ALT coins.

ALT M.CAP UPDATE! WHEN TO GO LONG IN ALTS??Hello everyone, if you like the idea, do not forget to support it with a like and follow.
Welcome to this TOTAL2 aka Altcoin market cap update.
TOTAL2 is forming a falling wedge like structure in 4hr time frame and currently looks like it is going for a 3rd tap of lower trendline of the wedge. Once it is reached near the lower trendline ($495-$500B) we can open some long positions with a tight stop loss. Longing here is more risky and less rewardable.
Hope this chart helps you to take better trade decisions.
If you like this idea then do support it with like and follow.
Also, share your views in the comment section.
Thank You!

Total Crypto Market Cap Monthly chart looks to have hit bottom.Total Crypto Market Cap Monthly chart
can you see how this is super bullish? Look
at the Ascending Bullish Trendline holding
support perfectly. The DeMark9 Indicator
is showing that there is a super high probability
that the enitre Total Crypto MarketCap is at the bottom.
The 100 Day and the Bull Market Support Band
is at the exact same place on the chart. The
monthly candle only needs to get above and close
above the green line and Bull Market is back in action.
Im looking for us to get there in the coming 30-90 days.
