What Happens If I Am Late? (Trading Strategy For Beginners)It can happen that for whatever reason you couldn't buy when the market was trading at bottom prices. What then? Am I too late?
It is unwise to buy at any random price and even less with 10X cross leverage. I've seen people doing just that and buying at the top of the range. While it is never too late in relation to the overall market cycle, it can be late for a certain pair.
The time to buy is near support. If bottom prices are not possible, the best option is to wait. Say you miss Bitcoin at $78,800 and prices start to advance. When prices are moving up at $84,000 and rising you can just wait. But if prices peak at $88,000 and then retrace to $84,000, consolidate as a higher low this becomes a second entry. The same when Bitcoin retraced from $95,000 and moved to the $91,000 - $93,000 range. This range becomes a second entry.
Rather than rushing and buying when prices trade, say at $106,000, at the top of the move, we wait for a retrace. If this isn't possible we simply look for another pair.
It is never too late because it depends on what strategy we are using, our Cryptocurrency Trading Plan, and trading style. If you are doing leverage it will depend on the chart setup and the amount of leverage you are using. If you are doing spot, it depends on your goals more than anything because buying can be done at any given time based on the long-term.
It is unwise to rush into Ethereum at $2,500 because you missed $1,600. And you say, "I didn't have any money and I didn't want to miss out." With 10X? What if you lose everything on a flash crash, are you missing out now?
The thing is, that all the pairs are the same when it comes to profits potential. We are looking for a win. So if a pair has a low probability of producing a successful trade, it is no good regardless of the name.
Patience is key.
You can use the comments section to ask questions.
It is not about "breaking the trading rules," it is about your money.
Have you considered what would happen if the market flash crashes just to liquidate you and those in a similar position to yours and then moves up?
You didn't want to miss out, but this not missing out can result in a major loss. It is better to plan and take action based on a strategy rather than rushing, the market is not going away.
Opportunities are endless, and every single day I will be sharing new charts. Some pairs are trading near support and at bottom prices, those are always the best because of the lower risk.
Low risk vs a high potential for reward.
Plan ahead.
Namaste.
TOTAL2

TradeCityPro | Bitcoin Daily Analysis #94👋 Welcome to TradeCity Pro!
Let’s go over the Bitcoin analysis and major crypto indexes. As usual, I’ll cover the New York futures session triggers for you.
⏳ 1-Hour Timeframe
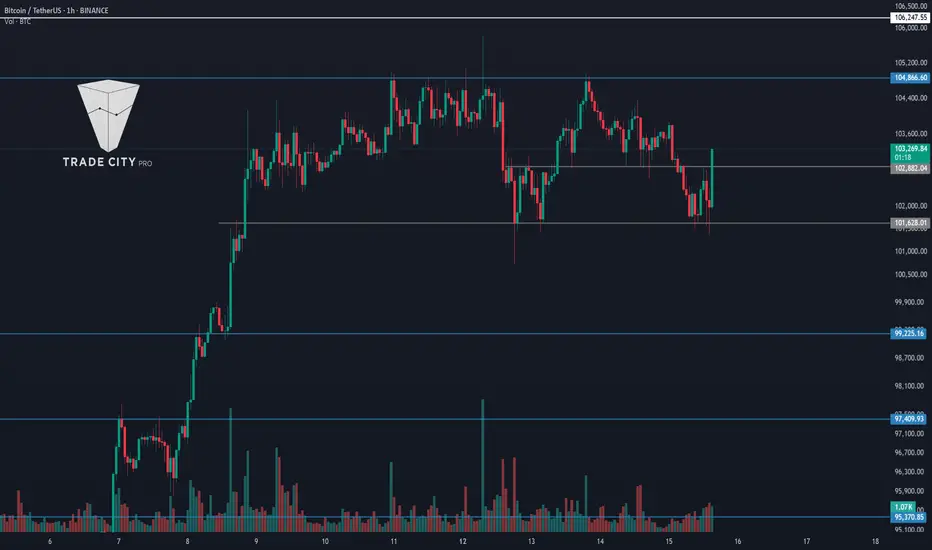
As you can see, yesterday the price was rejected from the 104204 level and formed a lower high compared to 104800. Currently, there's a strong chance the short trigger will activate, so let’s review those triggers.
🔽 For a short position, the area where the price is currently consolidating—102882—is a suitable trigger. If this level breaks, the price could drop to 101628.
📊 One note about this trigger: the zone between 102882 and 101628 is a major support range. Every time the price has entered it, it’s formed long wicks and exited with strong bullish candles.
✨ So, if we enter a position based on this trigger, the volatility of the candles increases the chance of getting stopped out. On the other hand, using a large stop loss isn’t ideal either, since these trades go against the main trend and work better with a tight stop to hit the target faster.
💥 The next trigger is the break of 101628, which seems more reasonable. Breaking this level confirms a deeper correction and opens the path toward levels like 99225.
✔️ For a long position, if the price prints a higher low above 101628, we can confirm a bullish bias with the break of 104204. A higher low indicates strong bullish momentum, allowing us to use a slightly riskier trigger.
⚡️ However, if the price falls to the bottom of the box and then returns to the top, the main long trigger becomes a breakout above 104800.
🔍 Today, most of the market volume is on the sell side, and red candles are getting solid volume, so a correction to the box bottom seems likely. Either way, we have to wait for the triggers to activate.
👑 BTC.D Analysis
Bitcoin Dominance continues its bullish move after breaking the descending trendline. Yesterday, it printed a higher low and broke 63.30, reaching 63.61, and is now consolidating below that level.
🔔 If this level is broken too, we’ll have the first confirmation of a trend reversal in dominance. Full confirmation will come after BTC.D holds above 63.95.
📅 Total2 Analysis
Let’s move to Total2. Yesterday, the 1.19 trigger activated, and the price dropped to 1.17. The reaction to 1.18 wasn’t strong or clean, so I’ve adjusted the support level to 1.17.
📉 Today, we can open a short position if 1.17 is broken. For a long, if the price moves above 1.19, we can go long on altcoins that trigger accordingly.
📅 USDT.D Analysis
Now looking at Tether Dominance. Yesterday, it reacted to 4.70 and is now forming a higher low, heading back toward that level.
☘️ I see strong bullish momentum on the chart, and I believe the probability of breaking 4.70 is high. If it breaks, USDT.D could move up to 4.82.
❌ Disclaimer ❌
Trading futures is highly risky and dangerous. If you're not an expert, these triggers may not be suitable for you. You should first learn risk and capital management. You can also use the educational content from this channel.
Finally, these triggers reflect my personal opinions on price action, and the market may move completely against this analysis. So, do your own research before opening any position.

Rounded Top Above 200MA A chart for the altcoin market showing a rounded structure forming above the 200MA on this daily chart
The 200MA will likely act as support and allow price to move higher
Still bullish for alt coins

TradeCityPro | Bitcoin Daily Analysis #93👋 Welcome to TradeCity Pro!
Let’s dive into the analysis of Bitcoin and key crypto indices. As usual, in this analysis, I’ll go over the triggers for the New York futures session.
⏳ 1-Hour Timeframe
Yesterday I mentioned the 102882 trigger for opening a position. The price made a bullish leg upward but failed to reach the 104866 resistance and is now moving back down.
🔍 If a lower high is formed compared to 104866 and the price approaches the 101628 support, we can open a position upon a breakdown of that level.
✨ The RSI oscillator is moving below the 50 zone, and with the selling volume coming into the market, the likelihood of forming a lower high than 104866 increases.
💥 Confirmation for a short position on the 101628 break could come from RSI entering the Oversold zone. Volume must also rise significantly, as the overall trend is still bullish, making short positions very risky. If you open one, make sure to secure profits quickly.
📈 For a long position, our trigger is still the 104866 breakout—no major change from previous days. The main resistance remains at 106247.
👑 BTC.D Analysis
Bitcoin dominance continued its upward movement to 63.30 yesterday and is now moving downward again. A breakdown of 62.65 would confirm the continuation of the downtrend in dominance.
🔼 For BTC.D to turn bullish again, it needs to break above 63.30 and could start another bullish leg if that happens.
📅 Total2 Analysis
This index didn’t move much higher yesterday due to the rise in Bitcoin dominance. It failed to reach its previous highs and is now near the 1.19 support.
📊 We can define a key support zone between 1.18 and 1.19. A breakdown of this zone could signal the start of a deeper correction.
📅 USDT.D Analysis
A range has formed between 4.51 and 4.69, and this index is consolidating within it.
🔑 A breakout in either direction could give us a trade setup. Breaking above 4.69 confirms a bullish move, while breaking below 4.51 signals a bearish trend and potential market rally.
❌ Disclaimer ❌
Trading futures is highly risky and dangerous. If you're not an expert, these triggers may not be suitable for you. You should first learn risk and capital management. You can also use the educational content from this channel.
Finally, these triggers reflect my personal opinions on price action, and the market may move completely against this analysis. So, do your own research before opening any position.

TradeCityPro | Bitcoin Daily Analysis #92👋 Welcome to TradeCity Pro!
Let’s dive into today’s analysis of Bitcoin and key crypto indices. As usual, I’ll walk you through the futures session triggers for the New York session.
⌛️ 1-Hour Timeframe
As you can see in the 1-hour timeframe, the price has broken below the 102886 support and dropped to 101628, where it found support and is now making its way back toward the 102886 level.
✨ If the 102886 level is broken again, we could open a long position targeting the main recent high of the market at 104886.
🌩 The 104886 zone is a very significant level, and breaking it could initiate the next bullish leg for Bitcoin. However, the all-time high resistance at 106247 remains a solid barrier, forming a key supply zone between 104886 and 106247.
✔️ Since this zone is a major area of supply, it’s best to already be in a position before price reaches it. There’s a strong chance of a sharp move, and the breakout may not provide a clear confirmation candle, making it difficult to catch an entry in real time.
🔽 For short positions, our current trigger is the 101628 level. A breakdown here could begin a deeper correction. Key support levels to watch are 99225 and 97409.
👑 BTC.D Analysis
Moving on to Bitcoin dominance—yesterday, the trendline we had drawn was broken, and now dominance is heading toward 63.12.
🧩 The break of this trendline doesn’t indicate a trend reversal just yet. The bearish momentum in this current leg has been strong, and for a full reversal, we would need to see a higher high and higher low form on higher timeframes.
🔔 For now, the next corrective zones for dominance are at 63.61 and 64.10.
📅 Total2 Analysis
Let’s look at the Total2 index. Like Bitcoin, it has undergone a correction and has reached the 1.18 support level.
🎲 The current short trigger is the 1.18 level, and a breakdown here would confirm a deeper correction.
🔼 For long positions, the 1.24 and 1.26 levels are suitable triggers.
📅 USDT.D Analysis
Now let’s analyze Tether dominance. The index has corrected to the 4.69 level.
☘️ If 4.69 is broken, the market could undergo a deeper correction toward 4.82. On the other hand, if the price gets rejected from this level, the likelihood of a move back down to 4.51 increases.
❌ Disclaimer ❌
Trading futures is highly risky and dangerous. If you're not an expert, these triggers may not be suitable for you. You should first learn risk and capital management. You can also use the educational content from this channel.
Finally, these triggers reflect my personal opinions on price action, and the market may move completely against this analysis. So, do your own research before opening any position.
TradeCityPro | Bitcoin Daily Analysis #91👋 Welcome to TradeCity Pro!
Let’s dive into the Bitcoin and major crypto index analysis. As usual, I'll go over the key triggers for the New York futures session.
⏳1-Hour Timeframe
As you can see, Bitcoin made a bullish move yesterday after breaking above 102,882 and reached as high as 104,866.
✔️ After hitting 104,866, the price failed to break this resistance and got rejected, pulling back to retest 102,882 with a wick.
✨ As long as the price stays above 102,882, I consider the market momentum bullish. I still hold my long position opened around 85,000 and plan to open another one if we break 104,866.
📈 So the best long trigger is a clean breakout above 104,866. The next resistance is 106,247, which makes the 104,866 breakout a bit riskier due to proximity to that major supply zone.
🔽 For short setups, the first trigger is again 102,882. If the price forms a lower high below 104,866, a breakdown of 102,882 could justify a risky short.
📊 Personally, I’m not opening any shorts yet since higher timeframe trends are bullish. My first valid short trigger would be a breakdown of 101,628.
👑 BTC.D Analysis
Bitcoin dominance continues to fall and has now reached the 62.07 support level and is reacting to it.
💫 If 62.07 breaks, we could see another bearish leg down to 61.34.
🔼 For BTC.D to flip bullish, we first need to see the descending trendline break and then look for confirmation and a long trigger from that.
📅 Total2 Analysis
After breaking through 1.24, Total2 moved up to 1.26 and is now pulling back to retest 1.24.
🧩 If 1.24 holds and the price breaks above 1.26, there’s a strong chance it continues toward 1.31. This would confirm a long setup for altcoins.
🔔 For short positions, the only valid trigger for now is a breakdown of 1.18.
📅 USDT.D Analysis
Tether dominance faked a breakdown below 4.51 yesterday but has now bounced back above it.
💥 Currently, we should wait for the price to retest 4.51 again and reassess that support. If it breaks down cleanly, we’ll get confirmation of bearish momentum for USDT.D, which would support a bullish trend in the broader crypto market.
❌ Disclaimer ❌
Trading futures is highly risky and dangerous. If you're not an expert, these triggers may not be suitable for you. You should first learn risk and capital management. You can also use the educational content from this channel.
Finally, these triggers reflect my personal opinions on price action, and the market may move completely against this analysis. So, do your own research before opening any position.

TOTAL2 - Broadening StructureA structure that allows continuation upwards on this daily timeframe
Price has become very bullish
It has been sitting at 1T for too long, extension is likely
This is an ascending broadening structure

TradeCityPro | Bitcoin Daily Analysis #90👋 Welcome to TradeCity Pro!
Let’s dive into Bitcoin and major crypto indices analysis. As usual, I’ll walk you through the key triggers for the New York futures session.
⏳ 1-Hour Timeframe
As you can see, the price has found support at the 101,628 level and is now moving back up toward the 104,866 resistance.
⭐ The first trigger for a long position was the breakout of 102,882, which confirmed the activation of a double bottom pattern and could’ve been a good entry point for a long.
✔️ The next key triggers are at 104,866 and 106,247. If you don’t already have a position open, you can enter on a breakout above these levels—but keep in mind it’s risky since there’s a strong supply zone nearby.
💥 From the RSI oscillator, a breakout above 57.41 can serve as confirmation of bullish momentum. In that case, you can take on more risk in long positions.
📉 For short positions, the first trigger is the breakdown of 101,628. If the price sets a lower high below 104,866, you can consider entering a short on the break of 101,628.
👑 BTC.D Analysis
Moving on to Bitcoin dominance—yesterday, dominance made a fakeout to the downside but came back above 62.65.
⚡️ To continue its downtrend, we can use 62.65 as the bearish trigger again. For a bullish confirmation, the next trigger is a breakout above 63.61.
📅 Total2 Analysis
Total2 had a pullback to 1.18 and is now heading back toward 1.24.
✨ We’ll confirm bullish continuation on a breakout above 1.24, and this can be used as a trigger for long positions.
🔽 For shorts, if the price prints a lower high under 1.24, a risky short could be considered on a breakdown below 1.18.
📅 USDT.D Analysis
Now looking at Tether dominance—like I mentioned yesterday, we were watching the 4.51 level for confirmation. That level held as support and blocked further Bitcoin upside.
🔔 Currently, a breakdown below 4.51 would confirm bearish continuation. If 4.70 breaks to the upside instead, we get confirmation of a deeper market correction.
❌ Disclaimer ❌
Trading futures is highly risky and dangerous. If you're not an expert, these triggers may not be suitable for you. You should first learn risk and capital management. You can also use the educational content from this channel.
Finally, these triggers reflect my personal opinions on price action, and the market may move completely against this analysis. So, do your own research before opening any position.

TradeCityPro | Bitcoin Daily Analysis #89👋 Welcome to TradeCity Pro!
Let’s dive into the Bitcoin analysis and key crypto indexes. As usual, in this analysis I’ll go over the futures triggers for the New York session.
⏳ 1-Hour Timeframe
In the 1-hour timeframe, as you can see, Bitcoin is still below the 104866 resistance level and is ranging underneath this zone.
💥 Today, an important news update came from Trump: a deal has been made between China and the U.S., and the two countries have agreed to reduce tariffs for 90 days.
✔️ The impact of this news was that Bitcoin made a wick toward 106247 but didn’t reach it, pulled back, and is now again below the 104866 area.
✨ At the moment, the 104866 level is a suitable trigger for opening a position, but be aware that there’s a significant resistance zone at 106247. Personally, I won’t open a position just on the break of 104866 because it's very close to the ATH zone, and the probability of entering a corrective phase is high.
⚡️ If a correction begins, the first support level for price is at 102391. If the RSI stabilizes below 50, the likelihood of a correction increases.
🔽 As for short positions, we should wait until the market shows a trend reversal.
👑 BTC.D Analysis
Now let’s look at Bitcoin dominance. Yesterday, the dominance chart made a slight upward correction and is now breaking below the 62.65 low.
🧩 If the downward move in dominance continues, altcoins could make another leg upward. The next support for dominance is at 62.17.
📅 Total2 Analysis
Now for the Total2 analysis. The 1.24 area, which was our long trigger, is being broken—and if it confirms, the price could rise up to 1.31.
⭐ This confirmation, along with the drop in Bitcoin dominance, could give us good long setups on altcoins.
📅 USDT.D Analysis
Now to Tether dominance. This index hasn’t triggered yet and is currently sitting at the 4.51 support. If this index also confirms a bearish move, the risk of opening long positions will be much lower.
💫 The next support level for Tether dominance is at 4.37.
❌ Disclaimer ❌
Trading futures is highly risky and dangerous. If you're not an expert, these triggers may not be suitable for you. You should first learn risk and capital management. You can also use the educational content from this channel.
Finally, these triggers reflect my personal opinions on price action, and the market may move completely against this analysis. So, do your own research before opening any position.

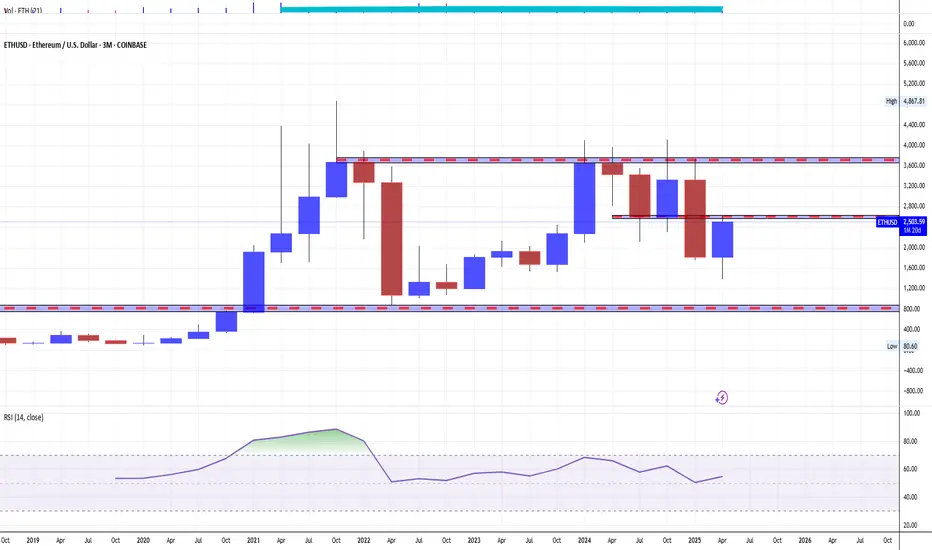
Crypto Markets: “Sell in May, and Go Away” — What Does It MeanThe historical pattern known as the “Sell in May, and Go Away” seasonal divergence was popularized by the Stock Trader’s Almanac, which stated that investing in stocks represented by the Dow Jones Industrial Average from November to April and switching to fixed income for the other six months “has delivered reliable returns with reduced risk since 1950.”
What is “Sell in May, and Go Away”?
“Sell in May, and Go Away” is a well-known saying in finance. It is based on the historical underperformance of stocks over the six-month period from May to October.
According to Fidelity Investments, the divergence has been most pronounced in recent years, with the S&P 500 (SPX) gaining an average of about 2% from May to October from 1990 onwards over the next 30 years, compared with an average of about 7% from November to April.
The Halloween Indicator, 'Sell in May and Go Away': Everywhere and All the Time*, a research paper examining stock markets outside the US, found the same pattern, calling the seasonal divergence trend "surprisingly resilient."
Key Takeaways
👉 "Sell in May and go away" is a saying that refers to the historically weaker performance of financial markets from May to October compared to the other half of the year.
👉 Investors can try to capitalize on this pattern by switching to less risky assets from May to October, based on historical data.
Seasonality in investment flows may persist as a result of year-end bonuses from the financial industry and businesses, perhaps helped by the mid-April deadline for filing U.S. income tax returns.
Whatever the underlying fundamentals, the historical pattern was made more pronounced by the October stock market crashes of 1987 and 2008.
Final Points
👉 The problem with historical patterns is that they do not reliably predict the future. This is especially true for well-known historical patterns. If enough people became convinced that the “Sell in May and Walk Away” pattern would persist, it would essentially begin to disappear immediately. All the early sellers would try to sell in April and bid against each other to buy back the assets before everyone else in October.
👉 At the same time, certain considerations regarding the development of geopolitical events in the period from May to October 2025 reasonably give reason to think about the prospects of such a scenario for the next 6 months.
* The Halloween Indicator, 'Sell in May and Go Away': Everywhere and All the Time
>> Ben Jacobsen Tilburg University - TIAS School for Business and Society; Massey University
>> Cherry Yi Zhang. Nottingham University Business School China; Massey University - School of Economics and Finance.
--
Best wishes,
@PandorraResearch Team 😎
TradeCityPro | Bitcoin Daily Analysis #88👋 Welcome to TradeCity Pro!
Let’s dive into the analysis of Bitcoin and key crypto indexes. As usual, in this analysis I want to review the futures triggers for the New York session.
⏳ 1-Hour Timeframe
In the 1-hour timeframe, as you can see, Bitcoin has formed a slightly better structure and it seems to be undergoing a trend-aligned correction.
✔️ A trend-aligned correction happens when the market enters a corrective phase, but the sellers are so weak that they can’t even stop the price from rising during the correction, and the price gradually moves upward.
🔑 In this case, since the market is in a corrective phase, if we enter with a tight stop loss, we are likely to get stopped out due to the nature of corrections. So it's better to open positions with a wider stop loss so it doesn't get triggered easily.
📊 One thing to note on the current Bitcoin chart is that we are very close to its most important resistance at 106247. This zone is a very strong supply area, and I think breaking through it won’t be easy.
⚡️ So for now, I suggest not opening any new positions on Bitcoin and instead using dominance charts to open positions on altcoins.
📈 If you already have an open position, I recommend keeping your Bitcoin position open, because if 106247 breaks, your position could become highly profitable.
👑 BTC.D Analysis
Let’s move on to Bitcoin dominance. Yesterday, after breaking the 63.61 level, there was another downward leg down to the 62.65 area, and altcoins made another upward move.
⭐ Currently, the dominance is correcting and has risen to the 63.29 area. I think it’s going through a slight correction since its drop was sharp and needs a bit of a breather.
💥 However, if the 62.65 low gets broken, we can take it as confirmation of the next bearish leg, and if that happens, we can again open positions on altcoins.
📅 Total2 Analysis
Now to the Total2 analysis. Yesterday, this index got rejected from the 1.24 top and slightly corrected, but it hasn’t reached the 1.17 area which overlaps with the 0.236 Fibonacci level, so we still haven’t confirmed the start of a correction.
✨ In my opinion, as long as we stay above the 0.382 level, the uptrend remains strong. Only after breaking below this area will we confirm the start of a deeper correction.
🔼 For continuation of the trend, breaking above 1.24 would allow us to open positions on altcoins.
📅 USDT.D Analysis
Now to Tether dominance. This index also broke below 4.63 yesterday and dropped to 4.51, and is currently correcting.
🧩 To get confirmation from Tether dominance, a break below 4.51 would signal that we can open long positions on altcoins.
🎲 The simultaneous break of 4.51 and 1.24 could be a strong confirmation if dominance continues to decline.
❌ Disclaimer ❌
Trading futures is highly risky and dangerous. If you're not an expert, these triggers may not be suitable for you. You should first learn risk and capital management. You can also use the educational content from this channel.
Finally, these triggers reflect my personal opinions on price action, and the market may move completely against this analysis. So, do your own research before opening any position.

TradeCityPro | Bitcoin Daily Analysis #87👋 Welcome to TradeCity Pro!
Let’s get into the analysis of Bitcoin and major crypto indices. As usual, I’ll review the triggers for the New York Futures session.
⏳ 1-Hour Timeframe
On the 1-hour timeframe, Bitcoin moved sideways yesterday as I mentioned, and after the RSI exited the Overbuy zone, it corrected down to the 102391 area.
🔍 This was a very minor correction, mainly due to the RSI leaving the Overbuy zone. Currently, the oscillator has reset, and if it re-enters Overbuy, we can confirm the start of bullish momentum.
✨ Now the candle has closed above the 103642 area, and if the price stabilizes above this level, it could move toward the main resistance at 106247.
📊 In my opinion, the price will move toward 106247 and then enter a correction because the breakout of 103642 was accompanied by increased volume, and if this volume continues, the probability of this move increases.
📉 If the correction starts from the current level, the first support we have is 102391, and after that, there is no solid support until 99337.
🧩 The reason I’m not using Fibonacci to find support zones is that the price hasn’t confirmed the start of a correction yet, and a proper top hasn’t been formed. I’m waiting for that top and confirmation of the correction before identifying key correction levels.
✔️ For now, only these two support levels are important, and as long as the price is above 99337, the trend remains bullish.
📈 For opening a position today, the Bitcoin trigger at 103642 has been activated and is currently getting a pullback. If you get confirmation from this pullback, you can enter a position — but be careful, there's a very important resistance at 106247 and that zone is highly significant.
👑 BTC.D Analysis
Let’s move to Bitcoin dominance. Yesterday, dominance had a slight correction and pause, and today it broke the 63.61 area and is moving toward the 63.23 support.
⚡️ It seems there’s strong bearish momentum in dominance, and if it continues to drop, I believe it could easily break 63.23 and move further down.
📅 Total2 Analysis
Let’s check out Total2. Yesterday, the 1.17 trigger for this index also activated, and you could open positions on altcoins.
💥 The next resistance we currently have is the 1.22 area, and considering the drop in Bitcoin dominance, this index can easily move toward that resistance.
🔔 At the moment, I can’t give you any trigger on this index — you can only enter based on confirmation from individual coins.
📅 USDT.D Analysis
Now let’s look at Tether dominance. This index has also continued its move and after a short pause, broke below 4.65 and is moving downward.
🎲 For now, the trend in dominance is bearish, which pushes the market upward.
❌ Disclaimer ❌
Trading futures is highly risky and dangerous. If you're not an expert, these triggers may not be suitable for you. You should first learn risk and capital management. You can also use the educational content from this channel.
Finally, these triggers reflect my personal opinions on price action, and the market may move completely against this analysis. So, do your own research before opening any position.

TOTAL 2 ANALYSEThe longer BTC dominance continues to decline, the more likely it is that Total 2 will break through key resistance levels.
For now, I’m anticipating a retest of the highlighted area, which would support a logical continuation to the upside, in line with the H4 analysis on BTC dominance.

TradeCityPro | Bitcoin Daily Analysis #86👋 Welcome to TradeCity Pro!
Let’s move on to the analysis of Bitcoin and major crypto indices. As usual, in this analysis I want to review the futures session triggers for New York.
✔️ Yesterday the market made another bullish leg and has now reached the 103642 resistance. There’s a chance we might enter a correction phase because the move has been very sharp and I think the market needs a rest.
⏳ 1-Hour Timeframe
As you can see in the 1-hour timeframe, we had a bullish move that continued after a pullback to the 99337 zone, climbing all the way to 103642.
💥 The RSI trigger I gave you also got activated and yesterday you could open a momentum-based position. I personally already have a long on Bitcoin from near 88000, so I didn’t open another one yesterday.
⚡️ Currently, RSI is exiting the Overbuy zone, and if that happens, the chance of entering a correction phase increases. As long as the price is above 99337, the main market momentum is still bullish and we’re not confirming a trend reversal just yet due to this strong momentum.
📈 Over the past few weeks, I emphasized a lot that you should definitely have at least one long position open, and not to open short positions unless a trend reversal is confirmed. I hope you’ve used the analyses and opened proper positions on either Bitcoin or altcoins.
📊 Today, it’s a bit late to open new positions because I think the market has made its main move and now we’re waiting for a correction phase to start. However, if you don’t have a position, you can enter a very risky trade on the breakout of the 103642 level.
🚨 This position is very risky and I personally won’t open it because we’re near the ATH and I think even if Bitcoin moves up to 106247, it’ll likely take a breather and won’t go straight up.
🔼 In any case, if you want to open a long position, I personally suggest waiting for a new structure to form and then look for a trigger. Otherwise, the only current trigger we have is 103642.
📉 As for a short position, you definitely know by now that with this strong bullish momentum, I’m not going to give you a short trigger. You have to wait for a proper structure for short entries.
👑 BTC.D Analysis
Let’s go to Bitcoin dominance. Yesterday dominance finally made a bearish move. It was a very sharp and one-sided drop to the 63.61 level without any corrections.
🧩 Currently, dominance is very bearish and altcoins have moved up strongly. Especially Ethereum, which after a long time made a sharp bullish move. I think as the market starts to correct, dominance will also move up and correct.
⭐ For altcoin entries, I personally wait for dominance to make a short-term upward correction and if it continues the second leg downward, I’ll enter altcoins.
📅 Total2 Analysis
Let’s move on to Total2. This index also had a sharp bullish move and after breaking 1.05, it managed to climb to 1.17.
🔔 I’ve talked a lot about the 1.05 zone and repeatedly told you to make sure you have a long position if it breaks. With that trigger activated, the Total2 uptrend has started and reached the 1.17 resistance.
✨ Currently, the only available trigger is the breakout of the 1.17 zone, and if it’s broken, we can enter another position.
📅 USDT.D Analysis
Let’s move to USDT dominance. Yesterday the 4.82 trigger was activated and dominance continued to fall. I also emphasized the 4.99 breakdown a lot and once again, I hope you’ve used the analysis and opened a position.
👀 Currently, the price has reached the 4.65 zone, which is very important and could trigger a correction. But if this zone breaks, we can open short positions.
💫 Overall, today if you notice, all the charts we analyzed seem to have made enough moves and now it’s time for a correction. However, if their triggers are activated and you don’t already have a position, you can still enter.
❌ Disclaimer ❌
Trading futures is highly risky and dangerous. If you're not an expert, these triggers may not be suitable for you. You should first learn risk and capital management. You can also use the educational content from this channel.
Finally, these triggers reflect my personal opinions on price action, and the market may move completely against this analysis. So, do your own research before opening any position.

The 4 Crypto Dominance charts and 4 x TOTAL charts -ALT ?
There are some charts we should always refer to in times where we feel change may be upon us.
The chart above are
Bitcoin Dominance ( BTC.D ) - Ethereum Dominance ( ETH.D )
Others Dominace ( OTHERS.D) and USDT Dominance ( USDT.D) ( I use USDT as it remains the largest Stablecoin by market cap)
The RED line in these Daily charts is the 50 day SMA
In most of my posts recently, I have been mentioning how Strong BITCOIN is remaining while under a Lot of resistance.
But we really should not forget the rest of the market. THE ALTS
The Fabled ALT Season has been running away from us, making many wonder just what is happening.
To explain, while BTC.D remains high, it shows us that the Money remain invested in Bitcoin.
When this Dominance Drops, in the past, it has signalled the rise of investment into ALTS.
Called ROTATION, the money rotates from one asset to another.
Due to the corporate investment in Bitcoin, this rotation has not happened.
BUT IS IT ABOUT TO ?
Let look at a few things
BTC.D has been rising continuously for Months now, It is way above that 50 day SMA. PA could fall a Long way before the support of that 50 SMA is required and I notice as I type, that is is beginning to drop. It's local support may help
ETH.D has begun to Rise but we need to pay attention to this as it could get rejected once again by the 50 SMA. Ethereum has had a very hard time this cycle and has yet to show any sustained recovery
OTHERS.D - Now OTHERS is the one I watch most. Others is the Top 125 Coins MINUS the Top 10 by market cap. This shows us the Mid to Low cap Alts coins.
This is also rising right now but once again, we need to wait and see if it breaks through the 50 SMA that has rejected it many times.
The USDT.D has been dropping. This shows that USDT has been rotated into other assets. Bullish but I have to say, that as I write this, I have just noticed that this has begun to rise also though only on a 1 hour chart so maybe just Noise but it is worth watching.
So, on these dominance charts, we see a potential start to a rotation but with the likely hood of rejection of the 50 SMA, It could be the First step of a bigger move.....But with potholes in front.
The Next Logical thing to do is to look at the TOTAL market Cap charts, to compare this dominance.
This chart shows us the Daily charts for
TOTAL Crypto market Cap - TOTAL2 ( minus BTC )
TOTAL3 ( Minus BTC & ETH ) - OTHERS ( Top 125 coins Minus top 10 by Dominace )
SMA;s in chart are RED= 50, BLUE = 100, GREEN = 128, YELLOW = 200
The TOTAL is the ONLY one that has PA above all the SMA's, potentially offering Support on many fronts. It has also had the most sustained Rise. Hence the high level of Dominance in the Market.
TOTAL2 is above the 50 SMA that has rejected it previously and is about to hit into the 100. We need to see if this will be rejected or not.
Remember how the ETH.D is also facing rejection off the 50SMA - ETH is under pressure
TOTAL3 is above the 50 and appears to have broken through the 100. This is VERY Bullish for the ALT coins and could show us some potential for a continued rise as sentiment continues to turn positive. But we should watch that 200 as a potential problem
OTHERS has the largest and strongest rise and again, is above the 50 and appears to have broken through the 100. This chart has the largest gap between current PA level and the next SMA that may reject it. This is the same on the Others.D chart
SO, in conclusion, The potential for a Rotation does exist but it is going to be hard fought. There is the possibility of a HIGH volitle state for the next few days, possibly Weeks.
If you are going to rotate out of Bitcoin, Be VERY CAUTIOUS until at least the next SMA have been claimed on both sets of charts.
The nest bets are on the Mid to lower Cap ALT coins.
BUT I will say this. I cannot See BITCOIN Selling off to invest in ALTS. I also see Bitcoin continuing higher against the USD.
IF we get an ALT season now, It will be Quick, Volatile and possibly with Quick Pump and Dumps on most ALTS.
The larger ALTS will survive this better than the Meme, small caps in my opinion
For me, the ROTATION that creates an ALT Season will occur with the rotation of money from ALT to ALT and NOT BTC to ALT
What ever you do, Remain in Peace and Safety

SHITCOIN index to 11X - No crying in the CASINO!I see grown men on my timeline expressing despair, claiming that altcoins are finished!
Come on, get a grip!
Volatility is simply the cost of chasing the highest potential returns in the most speculative market the world has ever seen.
Yet, many are unwilling to wait just one more year.
They’re turning into Bitcoin maximalists, hesitant to promote their favourite coins and reluctant to introduce friends and family to their preferred ecosystems.
This is just ridiculous.
Take a look at that chart.
I mean really study it.
It shows a stunning continuation pattern of an inverse head and shoulder.
Is that bearish or bullish?
You decide.
Embrace the cost of those future returns.
The Others index going to Trillions of dollars.
Means many millionaires will be freshly minted.
From memes to mansions.

TradeCityPro | Bitcoin Daily Analysis #85👋 Welcome to TradeCity Pro!
Let’s move on to the analysis of Bitcoin and key crypto indices. As usual in this analysis, I’ll review the futures triggers for the New York session.
📰 Yesterday, the U.S. interest rate decision came out, which remained unchanged and didn’t have much impact on the market—this was expected for some time. Now that the news had no real effect, the market can continue its previous trend.
⏳ 1-Hour Timeframe
As you can see in the 1-hour timeframe, after the news came out yesterday, the price ranged a bit and then moved upward, triggering the 97409 level. I hope you entered a position with that trigger because I had emphasized it strongly.
✔️ Currently, the price has reached the 99337 zone and is stabilizing above it. If this holds, the next resistance level is 101965.
💥 The RSI oscillator is also in the Overbuy zone, which is helping the price maintain its bullish momentum. There’s a resistance at 75.77 on the RSI, and if that breaks as well, we could see a very sharp move in the chart.
📊 Buy volume has been strong in this leg and aligns with the trend. If volume starts decreasing, divergence will appear, and we’ll get the first sign of trend weakness. Just remember—weakness doesn’t mean trend reversal.
📉 As for short positions, I think by now you know my trading style. In a market like this, where momentum is strongly bullish and price is breaking resistance one after another, I don’t think opening a short position makes sense. We should wait for proper structure to form before considering a short.
👑 BTC.D Analysis
Moving on to Bitcoin dominance—yesterday the 65.28 zone was broken and price moved up near the top of the channel, but then reversed and has now dropped to the midline of the channel.
🔑 Currently, the dominant trend is still bullish, but short-term momentum is bearish, and there’s a good chance it drops further to 64.91.
⚡️ Since the higher timeframes are still bullish, we could see bullish momentum return at any time. Technically, the 64.91 zone is the next major support.
📅 Total2 Analysis
Let’s look at Total2—finally, the 1.05 trigger was activated, and Total2 started moving upward. I had strongly emphasized this trigger as well, and I hope you took advantage of it.
🧩 Price has now reached the 1.07 level, and if that breaks, it could move up to 1.1.
🔼 If this bullish move turns out to be a fakeout, the next valid triggers for short positions are a break of 1.03 and then 1.01.
📅 USDT.D Analysis
Now to Tether dominance—this index also broke the 4.99 level and is now trending downward.
🔍 If this move continues, we could see a drop to around 4.82. That would allow the market to continue its upward movement even further.
❌ Disclaimer ❌
Trading futures is highly risky and dangerous. If you're not an expert, these triggers may not be suitable for you. You should first learn risk and capital management. You can also use the educational content from this channel.
Finally, these triggers reflect my personal opinions on price action, and the market may move completely against this analysis. So, do your own research before opening any position.

TOTAL2 - Move Down SimilaritiesSimilar situations within green rectangle
Prior move down found support and moved upward
I think this will be the same for the current retracement hence the green bars pattern upwards
Lets see how high it goes

TOTAL2 + TOTAL3 + OTHERSALTSEASON is the essence of the market and is inevitable!
TOTAL2 + TOTAL3 + OTHERS 💹

TradeCityPro | Bitcoin Daily Analysis #84👋 Welcome to TradeCity Pro!
Let’s dive into the analysis of Bitcoin and major crypto indices. As usual, I’m going to review the New York futures session triggers for you.
⏳ 1-Hour Timeframe
As you can see in the 1-hour timeframe, yesterday after news of tensions between India and Pakistan, Bitcoin moved upward and made a sharp rally to the 97409 zone, returning once again to this high.
📰 This news created fear in the market, and the buying that occurred was driven by fear and news impact. In my opinion, this bullish leg won’t be sustainable in the long term unless the price stabilizes above the 97409 level and starts a new upward leg.
✨ If the 97409 level is broken, we can enter a long position since it aligns with the current bullish trend, and we can position ourselves for the breakout with a wide stop-loss.
✔️ But make sure your stop-loss is wide and placed below the market’s main support because a significant resistance is being broken, and there's a high chance of volatility before the market actually moves upward. A tight stop-loss may get triggered before the actual rally begins.
💥 A momentum confirmation for today’s long position could be RSI entering the Overbuy zone, and if that happens, the chances of breaking 97409 increase significantly.
📉 For a short position, we should wait and see how the news impact plays out in the market. If it turns out to be driven by FOMO, naturally in the next few days, the price may move back down, and we could enter short positions on breaks of levels like 95370 or 93626.
👑 BTC.D Analysis
Let’s move to Bitcoin Dominance. Yesterday, dominance stabilized above the 64.91 level and managed to move up to 65.25.
🎲 Currently, Bitcoin is a much better option for long positions since dominance is rising, and even breaking 65.28 would confirm another bullish leg in dominance, potentially pushing it toward the top of the channel.
📅 Total2 Analysis
Let’s analyze Total2. Yesterday, this index faked a breakdown below 1.01 and simultaneously moved upward with the news, now reaching the 1.03 zone. A break of this zone could confirm a bullish move toward 1.05.
⭐ The main trigger for a long position remains the break of 1.05, and I strongly recommend being positioned if that level is broken.
🔽 For a short position, you can still enter on a break of 1.01 — I still think it’s a valid trigger.
📅 USDT.D Analysis
Now for USDT Dominance: yesterday, this index also faked a move above the 5.20 level and has since dropped to 5.04.
💫 Activation of the 5.04 trigger could be confirmation for a long position and a sign of USDT dominance starting to decline. The main trigger remains the break of the 4.99 bottom.
❌ Disclaimer ❌
Trading futures is highly risky and dangerous. If you're not an expert, these triggers may not be suitable for you. You should first learn risk and capital management. You can also use the educational content from this channel.
Finally, these triggers reflect my personal opinions on price action, and the market may move completely against this analysis. So, do your own research before opening any position.

TradeCityPro | Bitcoin Daily Analysis #83👋 Welcome to TradeCity Pro!
Let’s dive into the Bitcoin analysis and key crypto indices. As usual, I want to review the triggers for the New York futures session.
🔍 Today, I’ll provide the analysis in the 4-hour timeframe, since not much has changed on the 1-hour chart compared to yesterday, and it's better to take a slightly longer-term look at the chart.
⏳ 4-Hour Timeframe
As you can see in the 4-hour chart, we have an upward leg that started from the 84,000 zone and extended to 97,108. Currently, it's ranging between 93,626 and 95,370.
✔️ The main market top lies at 97,108, but the price has formed a range slightly lower, with 93,626 acting as support.
⚡️ There's a strong divergence visible in the RSI — while Bitcoin has formed three consecutive higher highs, RSI has printed lower highs. This divergence was activated when RSI broke below 50, and the price corrected to 93,626.
📊 In my opinion, the market has now digested the divergence, but the impact it had was a correction down to this level. If 93,626 breaks, deeper corrections could follow.
✨ The 93,626 zone overlaps with the 0.236 Fibonacci retracement and forms a PRZ. If this level breaks, we can open a short position. I open this kind of trade in lower timeframes as a scalp and take quick profits, since it’s counter-trend.
🔽 The maximum short-term target I expect for this trade is the 91,945 area. It's possible that the price corrects further or even reverses trend, but it's not logical in my strategy to hold these kinds of trades longer.
🔑 The key supports ahead are 91,945 (which overlaps with 0.382 Fibonacci), and further down are the 0.5 and 0.618 Fibonacci levels.
📈 For a long position, breaking 95,370 is currently the best trigger. You can also enter on a break of 97,139, but there's strong resistance at 98,828 that could halt the upward move.
🔼 If the price corrects and reaches 91,945, you can consider a long entry based on the price’s reaction to the supports I mentioned.
👑 BTC.D Analysis
Let’s move on to Bitcoin dominance. On the 4-hour chart, there’s an ascending channel where price is moving, with multiple touches. Right now, it’s testing resistance at 64.91.
☘️ If this level breaks, dominance could move up to the top of the channel. There’s also a very important static resistance at 65.59. If price reaches this area, we need to watch its reaction.
📅 Total2 Analysis
Now onto Total2. Similar to Bitcoin, it had a bullish leg, but corrected more deeply — down to the 0.382 Fibonacci retracement, and now it’s at the 1.01T support.
⭐ If this zone breaks, the next supports are at the 0.5 and 0.618 Fibonacci levels. There’s also a strong support at 980B, and the major bottom is at 932B.
📉 For a short position, breaking 1.01T is suitable. For a long position, a bullish reaction from this same area is a good trigger. The main long trigger is the break of 1.05T.
📅 USDT.D Analysis
Let’s move to Tether dominance. This indicator has reached a major top at 5.19. If this level breaks, it can move upward.
👀 If it breaks, the next resistance is 5.37. This move would coincide with a market correction or drop.
📊 To confirm a bearish Tether dominance (bullish market), rejection from 5.19 is a good trigger. The main trigger is still the break of 4.99.
❌ Disclaimer ❌
Trading futures is highly risky and dangerous. If you're not an expert, these triggers may not be suitable for you. You should first learn risk and capital management. You can also use the educational content from this channel.
Finally, these triggers reflect my personal opinions on price action, and the market may move completely against this analysis. So, do your own research before opening any position.

ALT COIN SEASON IS JUST WEEKS AWAY, HOPE YOU HAVE YOUR BAGS FULLHey Traders,
We’ve been watching this Bitcoin Dominance (BTC.D) chart closely — and it’s heating up again!
For those unfamiliar, BTC Dominance tracks the percentage of total crypto market cap that belongs to Bitcoin. When BTC.D rises, it typically means altcoins are underperforming compared to BTC — either due to their market caps falling, or BTC’s increasing. When it drops, altcoins are gaining ground.
While this chart won’t tell you whether markets go up or down, it’s critical for spotting where to diversify and when. It’s a must-have tool in your crypto trading utility belt.
⸻
Why This Chart Matters Now:
We’re nearing the top resistance trendline of a long-term triangle formation that dates all the way back to 2017. This line has rejected BTC.D multiple times in the past — and we’re back to test it again, hovering between 63% and 66% dominance.
Each of these rejections previously led to a drop in BTC Dominance — which triggered powerful altcoin seasons.
⸻
Key Bearish Signals:
• Bearish Divergence on the MACD
• MAJOR Bearish Divergence on the RSI
(Just like before previous alt seasons!)
• TOTAL2 (the white line representing all altcoins) looks poised to spike if history repeats.
Altseason Clue: When BTC.D forms bearish divergences on these indicators, it’s often followed by a surge in altcoin market cap — a key early signal we may be close to another one.
⸻
BUT… This Isn’t 2021 Anymore:
Let’s be real — the market has changed. Solana-based launchpads like Pump.fun and Jupiter DEX have revolutionized how easily tokens are created and traded. That’s new capital flow and speculative behavior we didn’t see last cycle.
Plus, the geopolitical landscape is shifting fast. With President Donald J. Trump calling for crypto regulation frameworks within 180 days, we may soon see an influx of institutional money — but it could come with strings attached.
⸻
Final Thoughts:
A breakdown in BTC.D could mean a major rotation into alts — but don’t bet the farm.
Markets could still dump. We may even skip altseason altogether this cycle.
However, this chart gives you a crucial edge — so use it wisely. Know your tools. Zoom out. Plan ahead.
As always — stay sharp, stay safe, and stay profitable out there.
— Savvy

TradeCityPro | Bitcoin Daily Analysis #82👋 Welcome to TradeCity Pro!
Let’s dive into the analysis of Bitcoin and key crypto indicators. As usual, I’ll walk you through the futures triggers for the New York session.
⏳ 1-Hour Timeframe
As you can see, yesterday the price stabilized below 95370 and completed a downward leg to 93626, reacting exactly to the level I pointed out in the previous analysis.
✔️ I mentioned earlier that you could enter a short position after breaking 95370 — but remember, this position is against the higher timeframe trend, so the downward move will likely end once it hits the first support, since the market momentum remains bullish on larger timeframes.
💥 Currently, the price has reacted to 93626 and seems to be resting from the previous downward move. I believe a new range box may form between 95370 and 93626 — if that happens, I’ll go long on a break above 95370.
🔽 For short positions, given the bearish momentum in this timeframe, we can look to re-enter on a break below 93626 in the next retest.
📊 Watch volume and RSI today. The volume of red candles has been much higher than bullish ones, which increases the chance of a deeper correction. If you’re shorting, keep a tight stop-loss, take profits quickly, and treat it as a scalp trade.
📈 For long positions, since it’s against the short-term trend, you’ll need a wider stop — but if the correction ends and a new bullish leg begins, the trade may stay open longer.
🧩 As for RSI: as long as it stays below 50, market momentum is bearish. A break below 30 and entry into oversold increases the likelihood of more downside.
👑 BTC.D Analysis
Bitcoin dominance broke 64.77 yesterday and retraced to 64.60. If this downward move continues, we could see early signs of a trend shift.
✨ Important note: dominance has been in an uptrend on higher timeframes, so a break of 64.60 only confirms a short-term correction. Don’t take it as a trend reversal just yet.
💫 If dominance continues to drop and the market rises, altcoins could outperform Bitcoin. Conversely, if dominance rises again, Bitcoin will rally more than altcoins.
📅 Total2 Analysis
Total2 broke below 1.03 yesterday, retested it, and now looks set to continue downward. The next support is at 1.00 — if you’re already short, consider taking profits at that level.
☘️ We’ll get full trend reversal confirmation with a break below 1.00. For long positions, the 1.05 breakout is extremely important. I strongly recommend not missing that trigger if it happens.
📅 USDT.D Analysis
USDT dominance stabilized above 5.10 yesterday, moving further away from 4.99, and is now testing 5.19. A break above 5.19 would be a strong signal that a deeper market correction is starting.
🔑 On the flip side, a break below 4.99 is still the best and most important trigger to confirm the market’s return to a bullish trend.
❌ Disclaimer ❌
Trading futures is highly risky and dangerous. If you're not an expert, these triggers may not be suitable for you. You should first learn risk and capital management. You can also use the educational content from this channel.
Finally, these triggers reflect my personal opinions on price action, and the market may move completely against this analysis. So, do your own research before opening any position.
