TOTAL2

Alt Market Cap Analysis - upcoming opportunitiesHello buddies, how are you?
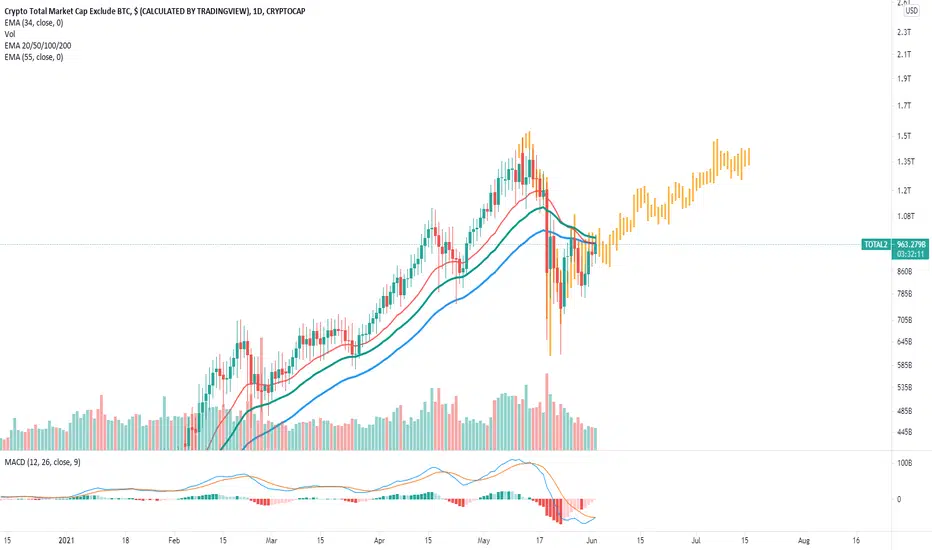
No need to explain about Alts for what happening over the past couple of days. We had seen huge red candles on the overall market. But most of us did not even imagine that the market will fall that much. So presenting you my thought on the current Alt market cap is what am seeing right now.
- In the chart, you can spot Pitchfork which I drew from the recent top. It was presenting index can be in short term or maybe long term downtrend.
- You can closely look into the pattern, every resistance and support line was working well, price action in this pattern was so much accurate.
For now....
- In the chart, you can see one dotted trendline which was the retest point of the index before moving upward and one red trendline named 'trigger line', yes the index broke this red trendline and the current price action is above this trendline. And what is that means is the price(index) has broken its downward momentum. Technically we may see an index at the green line soon which will be the C point of a pitchfork. If the index followed this pattern as it did in the past then there's a high possibility of relief in the alt market cap. As always we trade on possibilities so make sure you keep in mind every factor of the market and trade accordingly.

TOTAL2/BTCUSDTOTAL2/BTCUSD has reached its previous ATH and correction is happening right now. Short term bearish possibility.

TOTAL2 - Alts still look very bullish!Yo, dawgs
At a chart you can see capitalisation of total coins, except of Bitcoin, on a weekly TF.
Even after massive drop, we maneged to hold 20MA (yellow line), that is main indicator of bullish trend.
Also, I draw fib circle, that may help you navigate in trend dynamics.
Technically, we can drop even low, to the red line, and still be in main bullish trend, but that would be bad. Very bad.
Fundamentally, I don't think we will have growth as in 2017 in 130k %, because those growth was based on manipulation vs BTC pairs and ICO scams.
If BTC dominance won't fly to the moon, I think we can reach +-5T this cycle.
That's all, folks.

ALTCOINS Following Fractal from Previous Dump IdenticallyThis is bullish for a re-gearing of the crypto market back onto bullish trajectories. This 51% selloff in BTC and larger selloff in alts is following this fractal pattern beautifully - Expect some days to be choppy, but all in all, up and to the right.
As you can see we're about to have a bullish cross on the Daily MACDs and we are testing resistance on the Daily EMA ribbons.
We just had a bullish cross on the 4H EMA 20 coming above the EMA 55. The 1H EMAs are all bullish now. Crypto is staging its next assault.
Which is why you should be stocking up on the MOST fundamentally sound projects with near-term catalyst like DOT. DOT is my favorite token at this moment. Please see my analysis here on recent happenings in DOT and its ecosystem:
A possibility TOTAL2Altcoin market
Both rejected from key fib areas
will the most recent recover the same?
Assuming this scenario implies a large move afterwards, which I also hope occurs

Alts looking heathly?? Alt season again??Whats up C3 Fam! This is the total marketcap of everything excluding BTC. We have formed a W pattern on the daily chart, waiting for it break resistance and turn support ! ( YELLOW LINE )

TOTAL2 - Alt Season Bull ScenarioWe are seeing a pennant and inverse head and shoulders on 4h time frame of Total Altcoin Market Cap. Powerful reversal setup. Meanwhile, US Dollar Index $DXY is at support in an environment where inflation is a huge fear. I expect a breakdown of the Dollar, leading to one final huge rush into assets as peak inflation fear erupts.


BTC/USD (Found Weekly Support?)💎Technical Analysis Summary💎
BTC/USD
-Bitcoin printed its 1st green candle after the strong sell-off
-The price found support at a previous weekly key area
-This is a good sign of strength as the bears failed to create lower lows
-I'm not saying BTC will no longer dump or trade lower
-But the probabilities to see a good upside pullback increases
-If the bulls will attempt to push the price higher
-I think 45k-49k dollars is a strong resistance area
-So if you are looking for a buying oppurtunity
-Please make sure to have a trading plan
-And an exit strategy if the trade becomes invalid
-Have a nice trading week everyone!
⚠️Please always read the description⚠️
Thanks for donating 💰 via Tradingview coins TiborVrbovsky 🙏🎉
``````````````````````````````````````````````
If you need help🙋 don't hesitate to
Send me a message here PolarHusk 😊
``````````````````````````````````````````````
Trading Involves High Risk ⚠️
Not Financial Advice 💸
Please Exercise Risk Management 💱
``````````````````````````````````````````````

Total2 alt coin market capAltcoin market cap looking alright.
Breaking trend resistance level while making higher low next best resistance is 990T.
If we close bullish Monday into Tuesday expect a green week for altcoins to slowly recover.
Important for the market to hold Sunday low!
always secure some profit on the sideline.

Make or break bulls TOTAL2Altcoin market,
this is the point where bulls need to stage a reversal
if not the larger Head and Shoulders structure will result

i see ALT season starting 2nd half of july we are currently doing wave b of correction, once the correction is complete instant millionaires will be made
THIS SUMMER THEY WILL RISE

patienceIt may be a grueling summer, watching the entire market chop around as nation states play around; "crypto isnt legitimate." "Crypto is legitimate" Blah blah blah... until finally there is another crisis on our hands. oh no liquidity drying up, oh no inflation, oh no what do we do. Crypto offers many solutions to the next manufactured crisis.
