Has Bitcoin become a "SAFE" asset ? These charts show that......
After we heard the US Federal Reserve hold rates yesterday, Markets Fell some.
And Bitcoin joined them for a couple of hours but Look now.
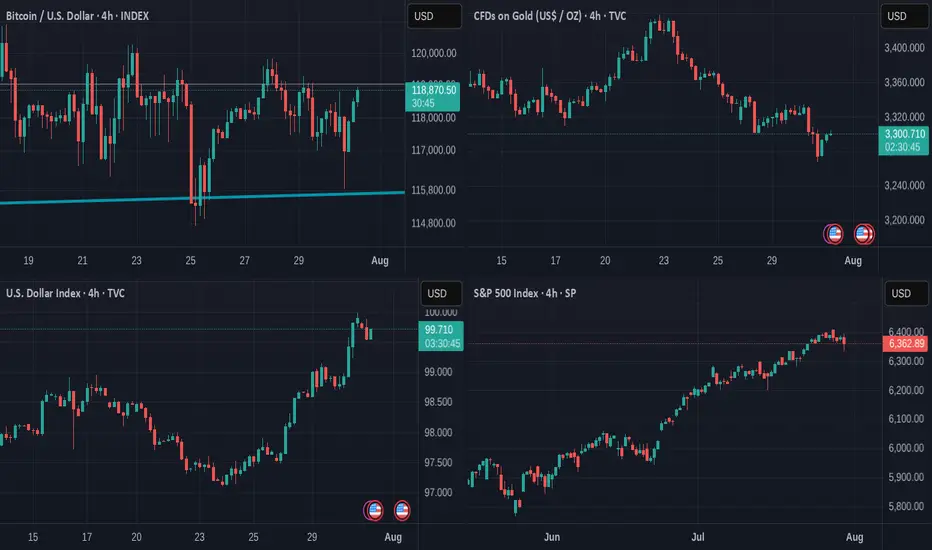
While the $ falls, the S&P Falls, GOLD is the traditional haven of safety and we can see how it Rose in Value over the last 12 hours
The $ has Fallen over the last 8 hours
S&P Stalled for the last 24 hours
And the STRONGEST positive moves over the last 12 hours were from BITCOIN rising, though it is taking a breather for the moment.
SO, has it become a SAFE HAVEN ?
Put it like this. Bitcoin has NOT lost value like it used to when under pressure.
We have yet to see what would happen once it reaches its cycle Top. Will it retreat as it has historicaly...
But for now, it does seem to be a strong store of Value and remains with potential and likelihood of further rises.
The TOTAL CRYPTO MARKET CAP chart below
This shows us that the investor market seems Very confident in the Crypto Market,,Just going from strength to strength.
The TOTAL 2 Market Cap chart shows us something very interesting.
The TOTAL2 chart is the Total Market Cap MINUS BITCOIN
Compare the 2 charts and you will see how the TOTAL chart has risen way over its previous cycle ATH but the TOTAL2 is currently being rejected off its previous ATH line.
This clearly shows us that BITCOIN is the strength in the Crypto Market.
It is the same story on the TOTAL3 chart ( TOTAL minus BTC & ETH )
It is the same on the OTHERS chart ( Top 125 coins minus top 10 by market Cap )
BITCOIN CARRIES THE MARKET
These are early days but the Future of Bitcoin does seem VERY good
So far this cycle, the largest retrace was -31%
This drop was NOT a sharp Drop over a short period of time. It was an expected and controlled drop over 112 days.
But the zoomed out version of that chart tells us something VERY GOOD
PA has risen above and Tested and held that line of resistance that had rejected PA at Cycle Top ATH in 2017 and 2021.
That is a HUGE move and we wait to see if we Hold and move higher away from this line.
SO, Is Bitcoin a Safe Haven ?
It is certainly looking more and more like it.
PA is secure, has held position well and is in Price discovery...slowly and with caution...but always moving forward.
The traditional 4 yeat Cycle would end in late Q4 this year and so we have to wait and see what happens then.
But Bitcoin PA has moved into New ground on so many fronts now.
The traditinal BEAR market may not appear, in which case, YES, Bitcoin could become a New SAFE HAVEN
Buy Bitcoin
Hold Bitcoin
Total2marketcap
TOTAL 2 Analysis (6H)The TOTAL2 chart — representing the altcoin market cap excluding Bitcoin — currently shows signs of weakness. A double top formation has emerged and is actively playing out. In addition, a micro trend change of character has clearly appeared, further validating short-term bearish pressure.
Technical Observations:
Price recently retested a broken support level and failed to reclaim it — a typical bearish confirmation.
In such scenarios, it’s common for the price to decline at least the depth of the double top formation.
However, it’s important to note that macro trend indicators still remain bullish, so entering aggressive short positions is not advised. Instead, consider setting alerts at the key reversal zones marked on the chart — these levels are likely to trigger a strong rebound.
If TOTAL2 breaks above the $1.23T resistance, this double top analysis becomes invalid.
— Thanks for reading.

$TOTAL2 and $USM2: Correlation never broken. What now? Today we dive into the world of crypto. We are looking into the recent rally in the Altcoins including CRYPTOCAP:ETH and §Sol and try to understand the reasons behind it and what is means for the future. CRYPTOCAP:TOTAL2 depicts the total market capitalization of all the Altcoins except CRYPTOCAP:BTC but including stable coins. When in doubt, zoom out. Today we are looking at the monthly candle stick charts for the CRYPTOCAP:TOTAL2 vs the $USM2. ECONOMICS:USM2 is the total M2 money supply from all the sources not only the banks but also other forms of cash within the economy. M2 money supply generally goes up and the economy grows and the Govt and Fed Balance sheets grow.
ECONOMICS:USM2 is primarily responsible for the increase in stock and asset prices. Crypto is no exception to it. Whenever the M2 Money supply goes up the Altcoins usually goes up. During the last Crypto cycle, the Altcoins peaked @ 1.7T $ in Nov 2021 and the ECONOMICS:USM2 peaked a few months after that in March 2022 @ 21.71T $. When the ECONOMICS:USM2 fell to 20.66T $ the Altcoins market suffered a bear market and lost 75% of the value. So, the question comes what happens to the CRYPTOCAP:TOTAL2 chart when the M2 money supply is expanding. We have clearly saw a recent surge in the Altcoin market but still below the ATH. Currently CRYPTOCAP:TOTAL2 at 1.16T $ is still below the 0.618 Fib retracement level plotted on the last cycle from top to bottom. Still CRYPTOCAP:TOTAL2 must cover a lot of ground and grow by 50% to reach its previous cycle top. In those cases, the ECONOMICS:USM2 must go up also by 1-2T $ to support such a jump in the $TOTAL2. But what will CRYPTOCAP:BTC do in that case?
Verdict : CRYPTOCAP:TOTAL2 can only go above $1.7T $ if ECONOMICS:USM2 expands by 1-2T $. Watch out for CRYPTOCAP:BTC in that case.

The 4 Crypto Market Cap charts and SMA's comparedTop Left TOTAL CRYPTO MARKET CAP
Top Right TOTAL 2 CRYPTO MARKET CAP ( Minus Bitcoin )
Bottom Left TOTAL 3 CRYPTO MARKET CAP ( Minus BTC and ETH )
Bottom Right OTHERS CRYPTO MARKET CAP ( Top 125 coins Minus Top 10 by dominance )
50 SMA RED
100 SMA BLUE
128 SMA GREEN
TOTAL Cap is the ONLY one that has broken above the 2021 ATH and has subsequently dropped back under but is still "touching the line" with a Wick up from the current candle.
It can also be seen how it is only the TOTAL chart that has remained easily above the 50 SMA since late 2023. The toer charts can be seen to have needed to bounce of it in 2024
The TOTAL 2 & 3 charts have very similar Candle moves and 50 SMA use.
To me, this is telling us about the Higher Cap ALT coins.
The fact that both TOTAL 2 ( Minus BTC ) and TOTAL 3 ( Minus BTC and ETH ) are similar shows me the little impact of ETH on price rise. These Charts are held up by the Higher ALT coins like SOL, INJ, SUI, XCN, HBAR to name a few. Most of these are still less than 100% gains over the last 12 months.
But what the slight Difference there is between the two charts does show us that ETH is a burden. It is dragging the TOTAL 2 chart down lwoer than the TOTAL 3 and that difference, though small on a monthly chart, is VERY SIGNIFICANT
OTHERS tells a huge story of how the Mid to Lower Caps are paying the price of Bitcoins adoption by Corporations and the fact that, as a result of these Corporations HOLDING, Bitcoin Dominance remaining High. The money that has once been used to Feed the ALT Market is static.
OTHERS is also the only chart that has fallen below its own 50SMA
That is not Bullish and very clearly shows how the Crypto Market has now matured and the absolute Tidal wave of New, worthless, useless ALT coins are failing.
This does not mean that will continue but I am inclined to believe that while we have such uncertainty in the world, the utter risk of investing in something with no use or history and security does not appeal to many.
To many extents, this could be seen as the beginning of the " Dot Com" Bubble burst for Crypto, where the best Coins / Projects are adopted and the rest, well, fall aside......
We shall see

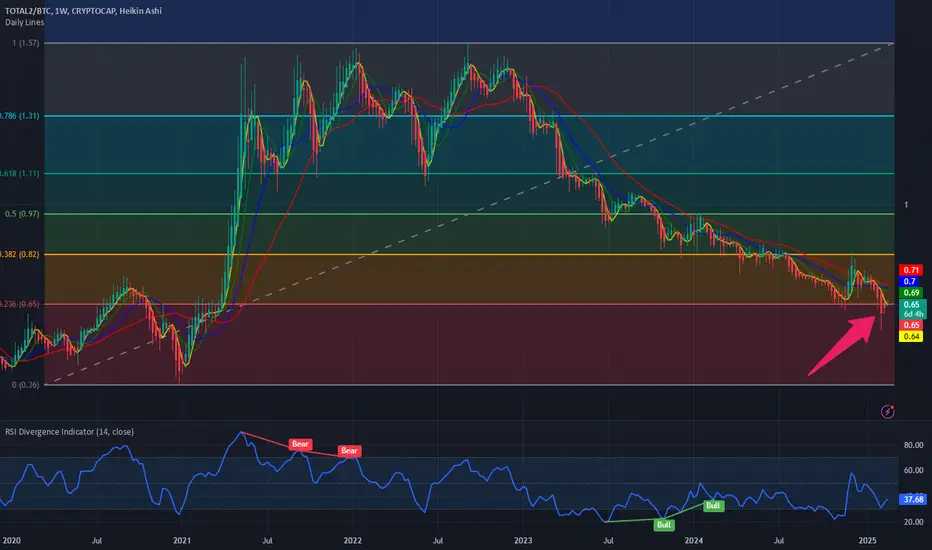
New ratio chart: $TOTAL2/$BTCToday we are looking at a new ratio chart where we plot the CRYPTOCAP:TOTAL2 (Crypto market cap without Bitcoin) vs CRYPTOCAP:BTC market cap. As we see from the chart the ratio chart as we see is making lower lows and lower highs. ALTCOINS are bleeding against the CRYPTOCAP:BTC in this Crypto market cycle. The long-awaited ALTCOIN rally is still missing in this crypto market cycle.
With TVC:US10Y holding onto the 4.5% level there is very little respite from the pressure on the ALTCOIN market. The recent meltdown of the meme coin market is also adding pain to the $CRYPTOCAP:TOATAL2 Market cap.
If we plot the Fib retracement level from the top to the bottom in the ratio chart, then we see that the chart is @ 0.236 level. The chart pattern is not bullish, and it is still below the 0.236 Fib level. The chart is bearish and maybe the Ratio CRYPTOCAP:TOTAL2 / CRYPTOCAP:BTC touches 0.36. May be by then the CRYPTOCAP:BTC.D @ 66% as predicted in my blog on 9th Feb 2025.
$BTC.D is at key Fib Retracement level. More upside-expectedThe most important story of this Crypto cycle has been the relentless strength of CRYPTOCAP:BTC against other crypto. The index CRYPTOCAP:BTC.D which measures the dominance of BTC in the total Crypto market in terms of Market Cap hit its low in Dec 2021 when CRYPTOCAP:BTC.D hit a multi-year low of 39%. That means only 39% of the Total Market Crypto can be attributed to $BTC. But since then, the Fed quantitative tightening began and most of the cryptos faced a meltdown. Even though CRYPTOCAP:BTC faced a bear market in CRYPTOCAP:USDT terms but still it fell less than the average Crypto. Since then, the CRYPTOCAP:BTC.D chart has made a bullish double bottom and then made new higher lows and higher highs. If we plot the Fib retracement levels on the CRYPTOCAP:BTC.D weekly chart we saw recently that the Dominance chart stalled around 0.5 and 0.618 Fib levels. Since then, the Dominance chart has been making new highs and broken past the 0.618 . The next key level is 0.786 which will take the dominance to 66.12% percent. Watch out for my blog when CRYPTOCAP:BTC.D reaches the key level for more insights.

$TOTAL2 vs $USM2 RatioIn the crypto world many analysts watch the Money supply called M2 closely to determine the direction of the market. During the last crypto cycle, the CRYPTOCAP:TOTAL2 index (Crypto Market Cap without CRYPTOCAP:BTC ) hit an ATH when the M2 hit 21.75 Tn $. Since then, the M2 Money Supply has been trending down which resulted in a major bear market in the Alt Coin space.
If we look at the chart of CRYPTOCAP:TOTAL2 vs ECONOMICS:USM2 we see that the chart hit an ATH on Nov 21 with M2 peaking in March 22. The ratio chart hit a low on Jan 23 with M2 hitting the cycle low on Mar 23. Since then, the CRYPTOCAP:TOTAL2 vs ECONOMICS:USM2 has shown a steady recovery with an increased money supply. The current level of M2 is still below the peak of March 22. But with increasing M2 we can expect a bull run in the Alt coin market including $BTC. There have been recently some weaknesses in the chart on a short-term basis. Let’s see how the chart develops on a medium-to-long term. Until then watch out for this space. CRYPTOCAP:BTC CRYPTOCAP:TOTAL2 ECONOMICS:USM2

TOTAL2 Index Set to Surge Towards $2.5 Trillion!CRYPTOCAP:TOTAL2
📈Which side you pick?
Bulls or Bears
This chart shows the gravity points for the TOTAL2 index. It also describes the potential targets and their different probabilities of realization. The nearest zones within this structure are highlighted in green.
After TOTAL2 broke above 1.29 trillion dollars, and with Bitcoin Dominance (BTC.D) decreasing, a very likely scenario for TOTAL2 is reaching the 2.5 trillion-dollar level.
⚡️Target:
2.5T

Total 2 Altcoin Marketcap Total 2 AltCoin ~ 1W
#Altcoin Season Super Cycle will start after this resistance block is successfully penetrated. you will see a super cycle increase in AltCoin.

TOTAL2 MARKETCAP ALTCOINTOTAL 2 ~ 1W
#Altcoin season it's still very early. Don't say you sold your AltCoins for only a small profit.
AltCoin's MarketCap is around $2T - $3.5T, Currently around $1.61T.

A Look Again At RSI The RSI is beginning to print very bullish horizontal movement that is the print of a bull market
The left hand side of this pattern is already printed, with the white vertical line being the middle of the pattern, now what is emerging is the right hand side of this larger structural pattern on the RSI, also indicative of a bull market.
Early 2025 is going to be very bullish.
Little white circle is where we are now corresponding to the last pattern if they evolve relatively the same.

#ALTSEASON is Coming! Don't Fall for the TRAP!I'll keep it brief—it’s all in the chart. TOTAL2 is simply retesting after breaking above the 50-weekly EMA, a historically strong signal for timing altseasons. The falling wedge pattern should break in the coming weeks with an impulsive move.
Current price action seems like a shakeout, pushing out weak hands right before the major rally everyone’s been waiting for.
This is not financial advice—DYOR—but IMHO, this is the worst time to give up. Being out of the market is riskier than holding, no matter how down your altcoin bags are.
Cheers!
Hit the like button If you like it, I'll be sharing more altcoin charts soon. Stay tuned!
#PEACE

Could Altcoins Rise This Weekend? Here's What We're Watching!Hey everyone! If you're enjoying this analysis, a thumbs up and follow would be much appreciated!
Total2 (Altcoin Market Cap) Update:
Total2, which tracks the total market capitalization of all cryptocurrencies excluding Bitcoin, appears to have broken out of a falling wedge pattern in the 4-hour timeframe. The price is also holding above the 50-day Moving Average (50MA), which can be a sign of support.
Expecting a good bounce in Alt M.cap up to $1.12T in the next few days. Keep a close eye on your favorite Alts this weekend.
What are your thoughts on Total2's current price action? Do you see a bullish pattern? Share your analysis in the comments below!
Thanks!

TOTAL2 bullish#TOTAL2 chart (top 125 #altcoins) bouncing on daily EMA200 support level... I expect no big corrections on Alts anymore, a few percent at most...
It's a good moment to start DCA, and prepare your portfolio before Q3...

ALTCOIN market UPDATEALTCOIN market UPDATE
yuh pretty obvious cycles going on here
could it be this easy?
bloody hope so LOL

TOTAL2 - Monthly Strong Bull Phase BeginsIn each circle the alligator indicator can be seen to be stretched out or "open"
When in a state like this bull action is most common
This is the Monthly timeframe so patience is required for big gains, regardless we will be seeing more green days than red.
BULLISH

TOTAL2 update; ends sooner than you thinkTOTAL2 update; ends sooner than you think
now some months have passed we can see reasonably clearly where we are at since the last analysis right at the start of the macro move up.
obviously black swan etc can ruin this or it just does it differently this time. prob not though tbh and if there is a black swan id bet its around those dates. the events tend to fit the chart for some odd reason not the other way around.
leaning towards the early version. im seeing mid april on a lot of other fractals. basically double tops or just slightly higher last highs then splat.
or it just keeps marching up and up and we all get raris and citadels.
im good with either.
lfg
gl

ALTCOINS recovery is around the cornerHi traders
Altcoins are dimping way more than Bitcoin therefore let's have a look at TOTAL2.
TOTAL2 is in a downtrend but when we zoom out , we can see that in fact , it's just a consolidation inside the channel and long process of building the market structure.
It looks like we can see another crash (20 -25 %) in the altcoins market overall. Some altcoins will dump 20 % from current levels and some altcoins will go down probably even more, but it doesn't look like a market cycle phase when you want to short crypto s coins forever .
Chart shows opposity. We are in an accumulation phase on altcoins and dips are for buying.
In my opinion the problem is with increasing number of altcoins that exist .
As we analyze the Total2 (all altcoins' market cap) , but there are continually new coins coming to the market, it will be impossible for some altcoins to recover fully (and history shows that only few altcoins recover fully and make new all time highs), therefore it's recommended to choose altcoins wisely.
Anyway, once the accumulation phase is finished, we will see a mark-up phase where we would target 0.618 fib level (1,20T).
When it's gonna happen? Probably not in 2023. Patience is a key.
Long story short:
* If you wanna short, do so. But keep in mind that downside is limited
* DCAing into altcoins once (and if) we get the next altcoins crash may be a profitable strategy if you play it with a long-term horizon.
* Choose your altcoins wisely
* Be patient. Buy low, hold and sell high (0.618 fib leve)
What do you think?
Share your opinion!
Good luck

CONSERVATIVE ALTCOIN MARKET CAP PREDICTION WITH DATESThis is my conservative Total2 (no BTC included) altcoin market cap prediction for a minimum all-time high.
Following the past trend, we can expect a high around ~$2.9 trillion . This is +156% from our current price and only a +75% increase from the all-time high prior to the last high in 2021. The expected date is an estimate taken from the number of days from the 2nd last ATH to the last ATH.
The data is only a single set and should not be taken as fact in the slightest. However, if we use it as an estimate, we will reach a new ATH on October 27, 2025 , which is 609 calendar days from today.
This is a strictly TA breakdown of the Total2 market cap. With full transparency, I think it is realistic that we will see a greater move than this. We may see this trend line only as resistance before breaking even further above $2.9T. I have no time estimate for this.
Everyone knows we now have Bitcoin institutionally adopted. ETFs have exceeded inflow expectations and could lead to greater ATH's than predicted, which could be an indicator for the same moves for altcoins.

Will the runs on TOTAL2 be comparable? Similar curved bear market recoveries allowing for a massive move up in the first situation
Will this second move up be like the first?
Im very bullish

TOTAL2 ScenariosLooks like there are 2 scenarios currently. The third one is breaking down, which woudl be a huge surprise. Low probability even tho the pattern usually breaks to the downside.

#ALTCOINS are about to surge higher than your expectation!#TOTAL2 : Altcoin market cap retraced to the local trendline support we plotted a few hours back. Continuation is highly likely from here.
Now isn't the time to be scared of the dip; these are opportunistic moments.
My plan: I don't want to buy in aggressively right now. Instead, I'll ladder in partially in case we hit the lower support of $630 billion.
#CryptoNews 📈

TOTAL2 Crypto Market Cap Bearish StophuntCurrently, there is a Bearish 12H and daily stophunt on the TOTAL2 market Cap, which is TOTAL minus BTC.
TOTAL2 is not showing a 3day Bearish stophunt like TOTAL is showing..
Stay tuned; likely to be a bloody weekend, but it may present us with some opportunities.
