#altcoins will have a blood bath?Here' s the #altcoin #totalmarketcap incl. #ethereum . This chart shows , altcoins' market cap have come to the top of the channel. Declination here is will doom altcoin bag holders. Clear breaking channel with volume and weekly closings is the invalidation. I showed the support levels on the chart. The war is not good for markets, a friendly reminder. Always use stop losses. I don' t say buy or sell , always train yourself and this is NOT FINANCIAL ADVICE.
Total2marketcap

$BTC - The Struggle Continues - #Bitcoin's Uptrend still intact in terms of Price Action,
coming from the Lows of 15K .
Concerning is the fact that despite Bitcoin trending Bullish on regards of
Market Structure (series of HH & HL ) ;
it is trending so,
within a Rising Channel (i.e bearish flag).
Ahead of this current uptrend is the Golden Zone Fibbonaci Level
awaited to be faced as Resistance in the midst of a Critical S/R Zone.
Both of this targets should be flipped from Resistance to Support(retested)
in order for Bitcoin to be headed higher,
to trigger the price interest at 50k-65k ; W(tf) *OB a
(see the updated idea attached below)
Until further confirmations, CRYPTOCAP:BTC is likely to be headed to at least 35.000$
in the short term time frame.
Key S/R and Golden Zone may very well be the next stoping point to open shorts
TRADE SAFE
*** Note that this is not Financial Advice !
Please do your own research and consult your Financial Advisor before
partaking on any trading activity based solely on this Idea.

TOTAL2 Hi Folks,
What is TOTAL2?
🔺For our new members:
--Total: It is the data that shows the total value of the entire cryptocurrency market.
--Total2: It is the data that shows the total value of all altcoins (excluding Bitcoin).
🔺Our Total2 data reached a record high of $1.70 trillion during the previous rally, followed by a sell-off wave that led to a drop to a local low of $435 billion.
🔺During this period, we witnessed many altcoins being delisted from the market or experiencing drpos of up to 90% in value, which was quite painful to watch.
🔺Technically speaking, we can say that this data set, which broke the downtrend, exhibited a consolidation performance in the first half of 2023.
🔺While tracking TOTAL2, we should not forget about stablecoins. It would be overly optimistic to say that the money exiting Bitcoin will flow into altcoins because we are currently not in a "bull rally" phase. The money leaving Bitcoin can also enter stablecoins.
🔺In the previous paragraph, I want to convey the following: It is now overly optimistic to say that if BTC.D (Bitcoin dominance) decreases, altcoins will rise. The money leaving Bitcoin may enter stablecoins, which could cause an increase in the TOTAL2 data, but it does not necessarily mean that altcoins will increase.
Things to Know Before Investing
🔺In the second part of this article, we will discuss what needs to be known before making investments.
🔺First and foremost, we are currently in a consolidation zone from a technical standpoint, as you can see on the chart. The decisions of the Federal Reserve (Fed) will directly affect this consolidation process. Especially on the day this article was written, there is an 80% probability of a 0.25 basis point interest rate hike at the next Fed meeting.
🔺Even if the Fed ends the interest rate hike process, experts predict that interest rates will remain high until 2024, and 10-year bond yields are already above 3.50%. While interest rates are at such high levels, it is still too early to expect a significant bull season for risk assets.
🔺As if the Fed alone is not enough trouble, we also have the Securities and Exchange Commission (SEC) going after altcoins. In recent days, the SEC filed lawsuits against both Binance US and Coinbase. However, to understand these lawsuits most simply, it is necessary to look at the Ripple case, which has been fighting against the SEC for years. The outcome of this case is likely to set a precedent.
🔺There is one important thing not to be forgotten: Even ETH was distributed/sold at very cheap prices to raise the necessary funds during its initial sale (approximately 16%). Unfortunately, this harsh reality exists for altcoins, and unreliable projects are prone to failure. Bitcoin, on the other hand, stands apart from altcoins as it never had an initial sale. We will address this topic again in another article.
Technical Data
🔺Altcoins haven't died; they are struggling to survive and providing buy-and-sell opportunities with high-profit margins to investors who use the right channels.
🔺Looking at TOTAL2, we can see that the downtrend was broken in January 2023, and it is consolidating and gathering strength before the next bull rally.
🔺$1.06 trillion is a critical pivot (fib 0.5). If there are closing prices above this level, we can say that the bull market has arrived. Otherwise, it will still present reasonable profit opportunities but will remain a reaction rally.
🔺Additionally, during the 2017-2018 rally, there were around 1,000 (let's leave the exact number to those who remember) altcoins, whereas currently there are over 25,000 altcoins. Choosing the right altcoin is crucial when there is a significant amount of money in the market. The number of slices in the cake has increased at least 25 times.
🔺Currently, the TOTAL2 data is testing the "AlphaTrend Sell Zone" resistance at $540 billion. If there are no closing prices above this level, selling pressure could increase.
🔺While the MACD generates buy signals, the RSI is struggling to break the 50-point resistance on the daily chart. If the RSI can close above 50 points, we can anticipate an acceleration in the upward momentum; otherwise, we expect increased selling pressure.
Bonus Chart 1: BTC.D 1W
🔺Bitcoin dominance continues to increase. Closing prices above 50.15 points can push Bitcoin dominance up to 54 points, which is expected to hinder the strengthening of the TOTAL2 data.
Bonus Chart 2: BTC.D vs ETH.D (Last 1 Month)
🔺In the past month, we witnessed Bitcoin dominance surpassing Ethereum dominance. But why?
🔺In its simplest form, we can say that the applications for spot ETFs for Bitcoin have played a role in this.
Dear reader, if you have read this far, I'm sure you have enjoyed it. You can give me feedback by liking and commenting. And if you happen to click on the share button, you can share this knowledge with people in your circle and together we can become stronger.

TOTAL 2 ANALYSIS (1D)We see a lot of bullish signals on the chart of altcoins and bitcoin, but total2 says something else.
We should keep an eye on this chart because it is a way forward. The red area is really where total2 can go downhill
After the completion of the e wave of the big D wave triangle, we prepare for the descending wave E
The time frame is daily and time consuming

TOTAL2 - Daily Inverted H&SInverted head and shoulders structure is completing itself on the daily timeframe for the altcoin market cap (TOTAL2).
The right shoulder has potential to show extremely bullish results as is normal with inverse H&S patterns.

TOTAL2 - Finding Its Altitude First Bull run -> 420B
Second Bull Run -> 1.6T
Third Bull Run - ?
These curves each show the journeys to the moon, it looks as if the curve pattern repeats.
I have made a post like this in the past linking it below
This is the altcoin market cap

ALTCOINS are bullish - TOTAL2 with weekly bullish divergencesAltcoin market with a weekly bullish divergence looks bullish overall and we expect the uptrend continuation in the mid-term.
We are not looking for shorts now.
When we get a pullback, it's a buy the dip opportunity.
How deep the pullback can be? The price may retest the key support again but most likely it will create a higher low and confirm its bullishness . Breaking (and closing below) the key support would be an invalidation of this trading idea.

ALT M.CAP IS AT RESISTANCE! RISKY TO LONG ALTS HERE!!Hello everyone, if you like the idea, do not forget to support it with a like and follow.
Welcome to this TOTAL2 aka ALT MARKET CAP update.
TOTAL2 is forming a channel in daily time frame and currently hovering below the resistance line. We need a clear breakout of this resistance line to go long in Alts. Longing anything at resistance is more risky.
BTC is also entered into the resistance zone of $28k-$30k level. From here we might see a decent pullback in the market. Also, we have an FOMC meeting this week.
All these scenarios make this week more interesting and crucial. Don't buy anything here either wait for a pullback or wait for the clear breakout.
If you like this idea then do support it with like and follow.
Also, share your views in the comment section.
Thank You!

Total2 update...Imagine the smell of support on the supply zone...
Means a big Altcoin season coming up, when this happens...

Crypto total market cap 45 % drop soon. Be ready!Total crypto market cap broke bearishly as Bitcoin did.
We expect a short term bounce and getting rejected at the strong resistance.
Final target for bears: 585 - 600 B
After that we expect the real accumulation face and the new bull market to start.
P.S Don´t get overexcited with a short-term bounce

#ALTCOIN MARKETCAP is Flashing Important Signal.Have a blessed Sunday to you all.
ALTMACP broke to the upside.
I am just skeptical about it for one reason, the confirmation candle closed in the red.
Unless we get a candle closing in green above the same, expect manipulation.
Be careful about holding the maximum portion of your portfolio in ALts.
Alt/BTC pairs will bleed.
I prefer holding BTC and a few alts with fundamental advantages like VRA is 230% already, HFT has started its run( Chart coming soon), and many other Gems APT did 4x.
So follow me if you want to know the next potential 50x coins!
DYOR, This is not financial advice.
Do show your support if you like my work.
Thank you
#PEACE

Yin or YangWhich path should it take?
For me, with the current nosedive of the DXY, it should be Yang.

ALT M.CAP IS FORMING A BULL FLAG!!Hello everyone, if you like the idea, do not forget to support it with a like and follow.
Welcome to this TOTAL2 aka Altcoin M.cap update.
Total2 is forming a bullish flag like structure in 4hr time frame. Currently, it is trying to break the flag here. If it succesfully breaks the flag then we might see some more 15-20% bullish rally in Altcoins. In case of a rejection, we have an important support at around $550B which must held.
Keep an eye on this.
If you like this idea then do support it with like and follow.
Also, share your views in the comment section.
Thank You!

#TOTAL MARKET CAP TECHNICAL ANALYSIS!!Hi guys, This is CryptoMojo, One of the most active trading view authors and fastest-growing communities.
Consider following me for the latest updates and Long /Short calls on almost every exchange.
I post short mid and long-term trade setups too.
Let’s get to the chart!
I have tried my best to bring the best possible outcome to this chart, Do not consider financial advice.
TOTAL MARKET CAP UPDATE
As you can see in the chart or absorb in the chart here TOTAK MARKET CAP is making these two patterns.
first symmetrical triangle pattern which is a semi-bullish pattern, here we need a breakout or breakdown to confirm this pattern.
The inverse head and shoulder pattern is a bullish pattern but here we need to break out the nice line of this pattern to conformation this pattern.
This chart is likely to help you make better trade decisions if it does consider upvoting it.
I would also love to know your charts and views in the comment section.
Thank you

TOTAL2 - Recovery FormationSimilar scenarios can be seen to the earlier green rectangle period
This green period was the result of a breakout from a falling wedge (recovery formation)
The green rectangle period we are approaching now also follows a recovery formation, however a different one, an inverted H&S
This rise will lead to another retest of the strong downward resistance in white
Daily timeframe

#ALT MARKET CAP is on the run! 15% Rally ahead!Welcome to this quick update everyone,
Altcoin Marketcap is bouncing after printing a higher low.
The index reversed on 18th June 2022 with a low of $430.955 Billion Marketcap.
Currently its trading inside a rising channel and to cpmleyte it needs to print another higher high which gives us our short term target of $573 Billion, almost 15% from current level.
THERY TO KEEP IN MIND:-
Since this is a rising channel which is generally bearish in nature and often considered as a bearish continuation pattern unless broken to the upside.
This is a very interesting scenario here. BTC has been surprising us since the last few months and ALT MARKCAP breaking to the upside after printing a bearish pattern could be another surprise while the whole crowd is completely bearish.
This is just a theory. The chart along with multiple indicators are showing possibility of a 15% rally in this index which will eventually push the altcoins 20% to even 50%.
So take your trade decisions accordingly.
INVALIDATION:- A CANDLE CLOSE BELOW THE RECENT Higher low of $461 billion will invalidate this chart.
DYOR before taking any trade decisions based on this chart.
Do hit the like button and share your views in the comment section.
Follow me for more quality updates.
I don't post much , I only do when it's needed.
Thank you
#PEACE

ALTS MARKET CAP UPDATE Hi guys, This is CryptoMojo, One of the most active trading view authors and fastest-growing communities.
Consider following me for the latest updates and Long /Short calls on almost every exchange.
I post short mid and long-term trade setups too.
Let’s get to the chart!
I have tried my best to bring the best possible outcome to this chart, Do not consider it as financial advice.
ALTS MARKET CAP is making these two patterns in which one is bearish and one is bullish .
ALT MARKET CAP is forming bearish pennant in 4hr timeframe
If pannent broken downside then is ready for another 30% bearish wave.
TOTAL MARKET CPA is forming this symmetrical triangle also So let’s wait for a sustain break down or breakout will confirm the next move of the TOTAL MARKET CAP.
Let's see how the market will react in few hours.
Stay tuned
This chart is likely to help you make better trade decisions if it does consider upvoting it.
I would also love to know your charts and views in the comment section.
Thank you

TOTAL2 - New lows Soon - alts bleed 45%Higher low, higher low and again higher low. Clear Ultra bearish scenario. Alts about to bleed additional 35-45% where they will bottom and a mini alt season will start.
Buy in alts when this charts bottom and compare to BTC.D where it should be at 49% => HIGH BUY
TOTAL 2 following my strategy to the tick.
Thanks me later, cheers!

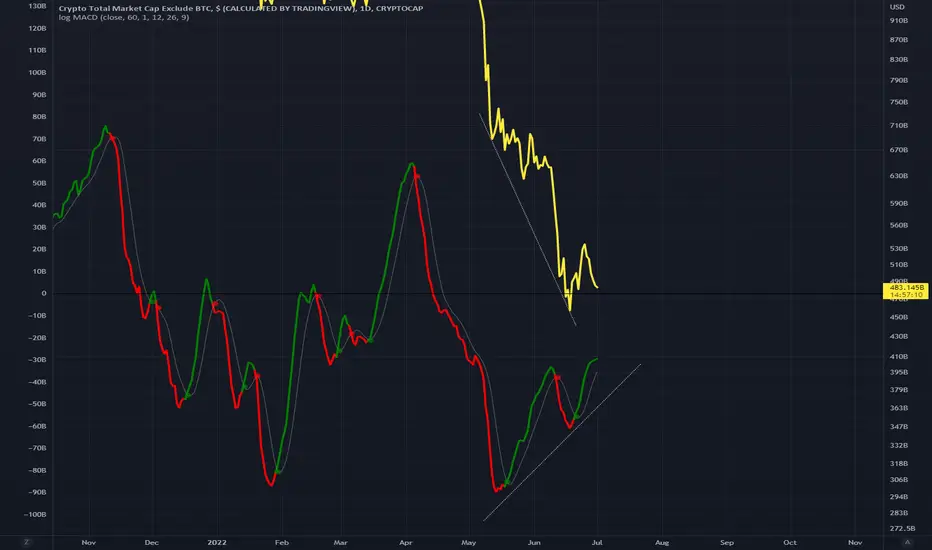
TOTAL2 - Daily Bullish DivergencePrice prints lower lows
While indicator prints a higher low
This is a Classic Bullish Divergence
Daily timeframe
#ALT MCAP $500 billion at critical level.
ALT MCAP is moving towards the 100 MA support around $500 billion mcap.
This is an important level to hold.
A green close above this level could trigger a bullish rally across the market, until it happens we are short-term BEARISH.
Be careful.
Let me know what you think in the comment section. Do hit the like button if you like me to post these small updates.
Thank you
PEACE

TOTAL2 Where will it recover? The 200MA is a strong point of support right now on the Weekly timeframe for the alt coin market cap
This will likely be the point of recovery from this current bearish action
Get the alt coins while they are cheap!!

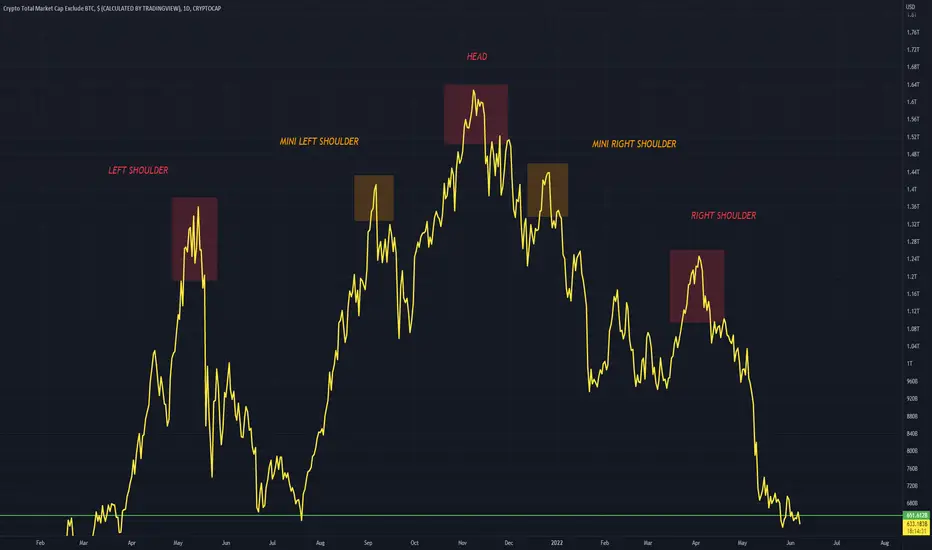
TOTAL2 Completed H&S PatternThe altcoin market (TOTAL2) has completed a H&S pattern
While also including simultaneously a mini left shoulder and a mini right shoulder
A visually appealing pattern to view
TOTAL2 (Altcoin Market) Bearish SentimentUsing two different Fibonacci Circle plots we can see price being rejected at purple and inversely being supported as orange
Currently price is in the middle of the purple fib ring, this allows a bearish conclusion to be made
Bearish action is plotted by Bars pattern in red (just a guess of how it will undergo)
Once price reaches orange again resumption of a bull market is possible (green)
Bitcoin will recover before altcoins
