$BTC $ETH & Altcoin data, Memecoins running, what it mean?Important short term🧵
$BTC RSI not showing good signs, NEG divergence
#BTC HAS BEEN LEADING the rally but it's weakening
We've posted on this $TOTAL 3 doing ok
#memecoin running usually @ end of runs
#bitcoin MUST hold support levels
MUST hold number is 18kish
---
2
$DXY running & RSI over 50 again
BAck to #crypto
$Total = ALL including $BTC & $ETH
Not showing recent strength of Total 3 = #altcoin
They all still have a ways to go to break down trend
Although #BTC HAS done it on it's own
#bitcoin has been LEADING until now
Rest time?
---
3
$BTC broke downtrend not long ago & struggled
24k has been issue = MAJOR RESISTANCE &
NECKLINE for Inverse Head & Shoulder = BOTTOM
Now $ETH RSI looks ok
However HUGE resistance @ 1700 area
#ETH hasn't broken downtrend
---
4
$BTC is to $DJI = $ETH is to $NDX
#DJI broke out before #NDX did
Very likely #BTC broke already & #ETH will follow
We'll likely take another month or so to realize the bottom
$TOTAL 2 = No #bitcoin, includes #ethereum & #altcoin, looks ok
We'll see how all pans out
Gnight
Total3
TOTAL3 = Altcoin Crypto is moving better than BTC atm = LIKEY!Please see profile
This is re-post
$DJI almost went green since post
$NDX went HIGHER
$BTC sells but fresh buying came in
#bitcoin battle ensuing
#BTC breaks 24, hopefully with volume we should see MORE than 10% pop, maybe even fill gap
*******
#Crypto #altcoins pumping $Total 3

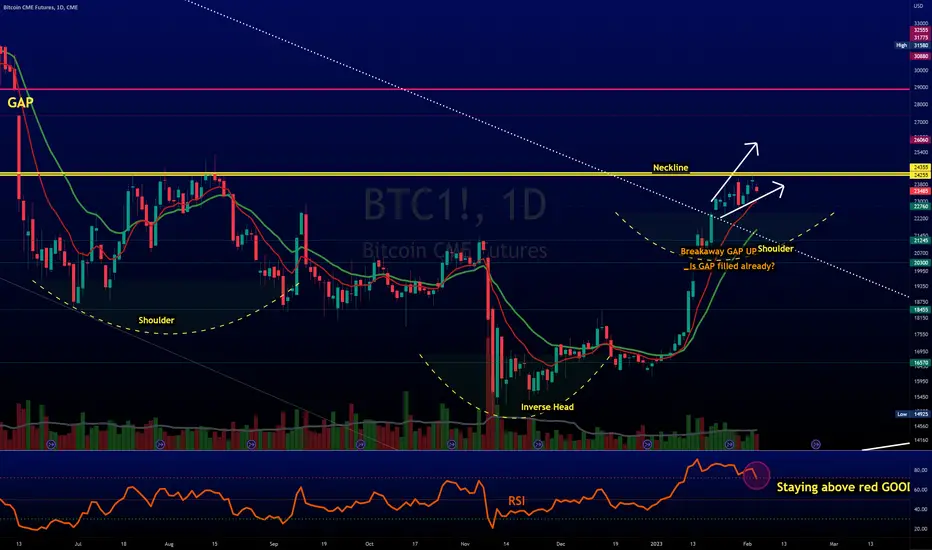
$BTC bearish engulfing light volume - Now what?1
Said MANY TIMES 24k would be HARD for $BTC
#BTC high = 24080
DAMAGE DONE:
Short up trend broken
Bearish engulfing but LIGHT volume
STILL IN PLAY:
Breakaway Gap
Inverse Head & Shoulder
RSI above overbought, red dotted line
#bitcoin playing out as expected
Rest of #crypto?
---
2
#Bitcoin BULLISH WEEKLY CROSSOVER soon?
Bearish crossover happened DEC 22
$TOTAL 3 = #crypto #altcoins - hasn't looked as strong as #BTC
RSI been going lower but currently resting @ red moving avg, holds = good
1 last thing
$BTC 4Hr hasn't traded under avg's since Dec 30

Total vs Total2 vs Total3Let's compare $TOTAL = all #crypto
vs NO $BTC with $ETH = $TOTAL2
vs NO #BTC or #ETH > #altcoins = $TOTAL3
Not much change between T & T2, although T looks a bit better
However, T3 is beginning to show lil more spunk
Could we be setting up for MORE #altcoin moving?
We'll see soon

TOTAL3 Market Cap ( Exclude BTC & ETH )TOTAL3 is pretty well ALL ALT COINS but does include BNB and al its BNB Chain coins.......(maybe time to NOT call BNB an ALT anymore but thats another convo )
This Daily chart shows us how PA has been stuck in a descending channel since around May '22 and how, repeatably, PA has hit Top trendline and been rejected.
And here we are again
Shorter Acting StochRSI is oversold so may offer some support but over all, MACD ( longer MA) is above 0 but not yet Overbought, so, should fundamentals come in with Good News, we have the ability to lift through that line of resistance.
A descending channel has a high chance of breaking trend, the longer it stays in it......but it replies on fundimentals and investment to make that happen.
There is a strong chance, Markets may well just wait now till the FED in the USA ( A Group of PRIVATE Bankers) decide how they are going to approach the issue of interest Rates.
The very idea of Crypto becoming a World wide financial service will get rid of this "Centralised Financial model" where One group of people can control Everyone else.
But that another story, meanwhile, Take care, have a plan and act upon it....PA may well Drop before it goes up again,

$TOTAL vs $BTC part 2$Total vs $BTC
You can also compare how TOTAL3 is lagging compared to Total, Total2, and BTC
Fact that #BTC is testing long term downtrend SHOWS #BITCOIN is LEADING the charge
Yes, #altcoin are ripping BUT BTC is leading move BY STRENGTH, mkt cap
Bitcoin hasn't really done this last 2 times
Next couple days = IMPORANT
Need Volume & Breakout
#crypto

$TOTAL vs $BTC part 1$Total vs $BTC
You can also compare how TOTAL3 is lagging compared to Total, Total2, and BTC
Fact that #BTC is testing long term downtrend SHOWS #BITCOIN is LEADING the charge
Yes, #altcoin are ripping BUT BTC is leading move BY STRENGTH, mkt cap
Bitcoin hasn't really done this last 2 times
Next couple days = IMPORANT
Need Volume & Breakout
#crypto

TOTAL 3 Ex BTC & ETH - CautionI see a lot of people jumping up and down about ATLS running but this chart shows a level of caution should remain
That 200 SMA has rejected PA harsly before and may well do so again - However, on the 4 hour chart, PA is being supported well by the 50
But, may not be enough....
Once PA gets through this 200, than I am all in
Untill then, please remain cautious

$TOTAL looks good - $BTC LEADS = VERY GOOD SIGN$TOTAL = ALL #CRYPTO including $BTC + $ETH
This index looks good
Volume lacks but majority of ppl were decimated
These are players who still have $, movers, smart $
#TOTAL3 = #altcoins, no #BTC or #Eth
This index is weaker
Shows how STRONG #bitcoin has been = VERY GOOD

TOTAL vs Total2 vs Total3 shows GOOD signs $BTC leadingTotal #crypto mkt cap
vs
Without #BTC
vs
Without #bitcoin & #ETH (just #altcoin)
This is GOOD because it shows $BTC is PUSHING
More BOTTOMING signs for #cryptocurrencies
Compare the charts to $total2 and $total3

TOTAL3 ( ex BTC & ETH) Crypto Market CapPA coming under pressure here and is bumping into the 200 SMA for first time since April '22
It is also running along upper trendline of long term channel AND at same time, now hitting the longer term resistance from Off ATH
This is a crucial time for ALTS
They have already begun a slight pul back in Markets while BTC PA appears to be hanging on for now.

CRYPTO TOTAL MC TARGETS!- As we can see every time there has been a BITCOIN HALVING event it has triggered a BULLRUN!
- The peak of the next bullrun will be around 12-18 months after the BTC HALVING EVENT!
- The time to buy is NOW!
- SMART MONEY (big banks, institutions and wall street traders) They are currently buying right now!
- COMMON SENSE buy low sell high!
- Where are DUMB MONEY (90% of the public / retail investors) they will not buy now, they will buy at the TOP of the cycle!
- WHY? simply because they do not understand how this market works, humans are very emotional, if we eat our favourite food we feel happy, excited and are satisfied if we get a parking ticket we become sad, angry or upset!
- This is the same shit that happens in these markets, another point to make is 90% of the public are BRAINWASHED, they simply follow the heard like sheep, they listen to the media not knowing that the TV was designed to: TELL A VISION, the media manipulates the average investor to believe that buying crypto now is risky, but when the markets peak, they start to throw positive news on the markets which excites new investors and they buy the top of the market without doing any research or understanding how the market works!
- Then when they lose money they always call CRYPTO A SCAM LOL its comical!
- NOT FINANCIAL ADVICE, PLEASE DO YOUR OWN RESEARCH, ONLY INVEST WHAT YOU ARE WILLING TO LOSE!

Crypto market capitalization in 2023Market capitalization in 2023 remains positive.
Will we have a bullish rally, contradicting the disciples of Nostradamus?

Total 3 - I think Altcoins havae bottomed!!!Giant wedge from the top, we just hit the bottom of it, I think altcoins are about to rip faces along with the rest of the markets. Hard to believe now in the depths of the bear market but the best thing to do is to just play the charts. Still need confirmation but I'm getting excited.

TOTAL 3 with thought process of bullish and bearish ideasTOTAL 3 need a support bounce to help the ALT coins
if it breaks below 307 it will be very bad for the ALT coins
what we really need is the price action to get a
support bounce ( bullish retest ) of 336
Price Prediction
not financial advice
this is for entertainment purposes only
always DYOR

TOTAL = All Crypto + BTC & ETH stopped @ Resistance $TOTAL = ALL #cryptomarket STOPPED cold
$TOTAL2 = NO #BTC, yes #ETH no much push
$TOTAL3 = No #bitoin or #Ethereum = #altcoin WEAK
#crypto #altcoins showing more weakness & $ETH is not as strong as $BTC, although none showing much

Total3Total 3 Market Cap is approaching the Phase E of Wyckoff Distribution where the price will soon break the support and continue the downtrend.
The Target is $150b which can be seen as obvious support on the weekly.
This is the beginning of the 50-60% drop most alt coins will experience.

Total Crypto cap vs non BTC vs Non BTC & ETHAll #cryptomarket
Total
Vs
#crypto minus $BTC
Total2
Vs minus
#BTC & $ETH = #altcoins
Total3
Things to notice:
Jan 1 #Bitcoin began to weaken (look @ sell volume in that time frame) vs others
#altcoin are much weaker now - Look @ blue lines

Total3 Altcoin marketcap 1 week (Others)Total3 Altcoin marketcap 1 week
line 1 week weekly
altmarket bull run
go 2024
others eu


ALTS and Predictive ModelsAnyone who follows me knows that I sometimes color outside of the lines regarding my application of tools for predictive means BUT, they sometimes work. Again, I use TOTAL3 because of my personal aversion to ETH and all things ERC20. I've NEVER had good experiences with that and prefer faster, cheaper methods to move around the crypto space (ahem . . XML . . yatta yatta )
Some reasons to support my rationale here :
1. Historical price action
2. A still highly speculative nature to crypto and the ridiculous parity it has with the S&P (standard piss)
3. More talk re: centralized CBDC's and the belief that the globalists would love to just push the delete button on everyone's personal wealth ("You will own nothing and be happy" . . F.U. Klaus)
4. At least one more flash wick liq before moon
The time frames might not be 100% but I think are reflective of larger market forces real word possibilities.
I like high, conservative probabilities and use DCA strategy ALWAYS, never shoot my wad even if it means missing massive gains. I'd rather make smaller, consistent gains than risk losing 1/2 my port on an overly leveraged position, not worth it and I've seen too many traders get liq'd never to return again. Makes for a much friendlier public chat here, despite if having gone into the trough in a massive way.
As always, this isn't investment advice, simply analysis for you to do your own research.
Stay frosty my friends!

ALT Coins & Predictive Models IIIf you go back to my previous idea for TOTAL3, you'll see that I had "eye-balled" a pitchfork (downward) to show a channel that I figured we would eventually take. I may not have gotten 100% accuracy on that fork but it was obvious (to me anyway) that we had some serious correction coming. That fork has proven itself after all.
So welcome to the next leg of the bear market, even if the plunge protection teams get in there and attempt to prop things up, bear markets are NECESSARY and deep corrections are EXACTLY what we need in order to shake weak projects, weak hands, hopium, hype and all the scams from our midst.
What has value is worth paying for and owning, the rest will vanish (assuming a free and generally un-tampered market, which we don't really have)
Enjoy the interim relief rally here but don't hold your breath for 90k Bitcoin and ETH, it still pretty much sucks, it's expensive, slow to transact and mostly a pain in the arse to work with.
* * * Not Investment advice * * *

Total 3 bullish pattern emerges This fractal pattern from 19-20 has so far repeated perfectly. The only move left is the explosion upwards into new highs. The whole move is now being followed by a spike in volume . Let's keep an eye on it and see where it goes.
This is not investment advice and you shouldn't take it as such. It's an observation and it's for educational purposes.
Thank you
'WeAreSat0shi
