Total Crypto Market Cap Monthly chart looks Amazing!Total Crypto Market Cap Monthly chart
can you see how this is super bullish? Look
at the Ascending Bullish Trendline holding
support perfectly. The DeMark9 Indicator
is showing that there is a super high probability
that the enitre Total Crypto MarketCap is at the bottom.
The 100 Day and the Bull Market Support Band
is at the exact same place on the chart. The
monthly candle only needs to get above and close
above the green line and Bull Market is back in action.
Im looking for us to get there in the coming 30-90 days.
Total3

TOTAL3 is getting even closer to a breakout?look how the Convergence and
divergence with the Price action
and RSI move together...this is an
example of how charts work...we
have never been this oversold...
big things ahead for the ALT coins.

#TOTAL3 #CRYPTO Market Cap to lose over $100 bIllion DollarsWe are in the process of breaking down any hour now!
Inverted chart is shown.
(In my view --- just an educated opinion by a experienced market speculator)
This would account for it being a near 50% haircut on the #crypto market excluding #BTC & #ETH
This last down move could be sickeningly violent and really push out many participants unfortunately.
We all can't make it speculating, that would imply a fake market.
Profit come from other peoples money unfortunately.
What #ALTS are you holding, and i will scan the chart for you upon request.

Are you ready for Alt season?Watch for a break of the pink line with conviction. Once it breaks I think we'll see a rapid rise in alts. NFA, DYOR.
What are you favorite alts / charts right now?

#TOTAL MARKET CAP TECHNICAL ANALYSIS!!Hi guys, This is CryptoMojo, One of the most active trading view authors and fastest-growing communities.
Consider following me for the latest updates and Long /Short calls on almost every exchange.
I post short mid and long-term trade setups too.
Let’s get to the chart!
I have tried my best to bring the best possible outcome to this chart, Do not consider financial advice.
TOTAL MARKET CAP UPDATE
As you can see in the chart or absorb in the chart here TOTAK MARKET CAP is making these two patterns.
first symmetrical triangle pattern which is a semi-bullish pattern, here we need a breakout or breakdown to confirm this pattern.
The inverse head and shoulder pattern is a bullish pattern but here we need to break out the nice line of this pattern to conformation this pattern.
This chart is likely to help you make better trade decisions if it does consider upvoting it.
I would also love to know your charts and views in the comment section.
Thank you

Total Crypto Market Cap Monthly chart looks to have hit bottom. Total Crypto Market Cap Monthly chart
can you see how this is super bullish? Look
at the Ascending Bullish Trendline holding
support perfectly. The DeMark9 Indicator
is showing that there is a super high probability
that the enitre Total Crypto MarketCap is at the bottom.
The 100 Day and the Bull Market Support Band
is at the exact same place on the chart. The
monthly candle only needs to get above and close
above the green line and Bull Market is back in action.
Im looking for us to get there in the coming 30-90 days.

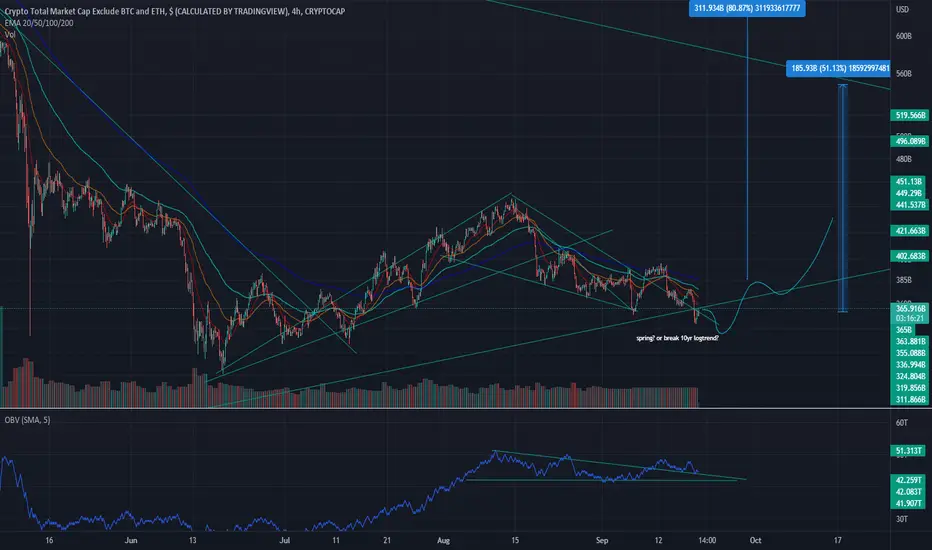
TOTAL3alts mcap no ethereum
looking like a spring to back above trendline
should see some alt releif coming 2 months or so?
otherwise its a long way down under that line..
potential for 50% ish from here if we can stop the selloff..
total total crypto market cap has managed to squeeze outside of the weekly bull channel and is now back-testing it from below;
it's also beneath the 55 monthly exponential moving average.
---
is this a trap?
or are about to see a -50% raid before a true bottom is in?
find out next month.

#TOTAL MARKET CAP LOOK BULLISH!!Hi guys, This is CryptoMojo, One of the most active trading view authors and fastest-growing communities.
Consider following me for the latest updates and Long /Short calls on almost every exchange.
I post short mid and long-term trade setups too.
Let’s get to the chart!
I have tried my best to bring the best possible outcome to this chart, Do not consider financial advice.
TOTAL MARKET CAP UPDATE
As you can see in the chart or absorb in the chart here TOTAK MARKET CAP is making these two patterns.
first symmetrical triangle pattern which is a semi-bullish pattern, here we need a breakout or breakdown to confirm this pattern.
The inverse head and shoulder pattern is a bullish pattern but here we need to break out the nice line of this pattern to conformation this pattern.
This chart is likely to help you make better trade decisions if it does consider upvoting it.
I would also love to know your charts and views in the comment section.
Thank you

TOTAL3 looks prepped for a launch anytime?TOTAL 3 weekly chart:
The Long yellow rectangle support box may
be the most important support in the entire
Market as a whole. When there is around 19,000
Alt-coin projects relying on BTC holding and this
huge monster support box holding, this is Do or
Die...Im confident in the coming 300 days,
we will see all time highs in the TOTAL 3 market.
The Green $2.674 Trillion is my Super bullish
prediction coming from measurements. and the
smaller yellow rectangles are the falling bearish
support boxes....lets hope we dont see the candles
fall lower. The RSI has never been this OVERSOLD, we honestly should be moving up
bc we are in uncharted territories and sentiment should change.

TOTAL 3 weekly still looking bullish overallTOTAL 3 weekly chart:
The Long yellow rectangle support box may
be the most important support in the entire
Market as a whole. When there is around 19,000
Alt-coin projects relying on BTC holding and this
huge monster support box holding, this is Do or
Die...Im confident in the coming 300 days,
we will see all time highs in the TOTAL 3 market.
The Green $2.674 Trillion is my Super bullish
prediction coming from measurements. and the
smaller yellow rectangles are the falling bearish
support boxes....lets hope we dont see the candles
fall lower. The RSI has never been this OVERSOLD, we honestly should be moving up
bc we are in uncharted territories and sentiment should change.

Crypto Currencies go to DownTrendWhen you look at TOTAL3 chart, you can see a divergence between RSI and TOTAL3. and another thing is TOTAL3 breaks a short term up-trend line and it looks that it want to goes down and touch long term up-trend line.
CRYPTOCAP:TOTAL3

TOTAL3 is looking very bullishTOTAL 3 weekly chart:
The Long yellow rectangle support box may
be the most important support in the entire
Market as a whole. When there is around 19,000
Alt-coin projects relying on BTC holding and this
huge monster support box holding, this is Do or
Die...Im confident in the coming 300 days,
we will see all time highs in the TOTAL 3 market.
The Green $2.674 Trillion is my Super bullish
prediction coming from measurements. and the
smaller yellow rectangles are the falling bearish
support boxes....lets hope we dont see the candles
fall lower. The RSI has never been this OVERSOLD, we honestly should be moving up
bc we are in uncharted territories and sentiment should change.

TOTAL3 weekly is getting even more bullish!look how the Convergence and
divergence with the Price action
and RSI move together...this is an
example of how charts work...we
have never been this oversold...
big things ahead for the ALT coins.

ALTS WILL PUMP SOON AFTER A LITTLE PULLBACK!!Hello everyone, if you like the idea, do not forget to support with a like and follow.
Welcome to this Alt M.cap AKA Total3 update.
Alt m.cap is trading inside a symmetrical triangle in the daily time frame and currently facing some resistance as the triangle's upper trendline. I'm expecting some pullback from here. I'm not opening any long positions now. Either I'm waiting for a pullback or if it breaks out from here, I'm taking some long positions.
Let's see how this goes.
If you like this idea then do support it with like and follow.
Also, share your views in the comment section.
Thank You!

Total analysisIn the long-term time frame, we are in the bullish channel.
We see the bearish Rising Wedge pattern in 1 day time.
There is a possibility of falling to 715B $.

TOTAL3 is getting primed for a launch again!TOTAL 3 still intact and RSI is showing a tic
upward and this is a great sign. Price still remins
in the gold consolidation box.

ALTCOINS BULLISH RALLY AHEAD IF? Hello everyone, if you like the idea, do not forget to support with a like and follow.
Welcome to this Total3 market cap update. Total3 generally indicates the market cap for all Altcoins excluding BTC and ETH.
Now let's get to the chart.
Total3 is forming an inverse head and shoulder pattern here where the breakout of the neckline is still pending.
Once it breaks the neckline we will see a pretty good rally in Altcoins.
I'm expecting a bullish rally in Alts in the month of July and August. All i"m waiting for is to break this neckline. Let's see how it goes.
What do you think about this?
Do you also think that we might see a good rally in Alts in the month of July and August?
Share your views in the comment section.
If you like this idea then do support it with like and follow.
Thank You!

TOTAL3 is getting even more bullish!look how the Convergence and
divergence with the Price action
and RSI move together...this is an
example of how charts work...we
have never been this oversold...
big things ahead for the ALT coins.

TOTAL MARKET CAP long-term update:must read!! Hi guys, This is CryptoMojo, One of the most active trading view authors and fastest-growing communities.
Do consider following me for the latest updates and Long /Short calls on almost every exchange.
I post short mid and long-term trade setups too.
Let’s get to the chart!
I have tried my best to bring the best possible outcome in this chart, Do not consider it as financial advice.
TOTAL MARKET CAP
Total market cap formed this big rising wedge pattern but it is yet breakout currently is lying on the lower support of this big wedge pattern as long as the lower support, we can expect a bounce from there. RSI is in the oversold range and we have 200ma as local support.
If it breaks the lower support or 200ma support then the chart will be invalided.
If you look closely at the first cycle and compare it to subsequent cycles, you will find that the beginning of 2021 was great for TOTAL MARKET CAP because it grew by almost 500% in 2 swings.
If you look at the second cycle, the price has risen at first, but later you realize that this is a trading range. In the trading range, there is a difference between the buyer and the seller.
After the failure of the trading range, the price enters a downward trend for a while and falls about 70%. You may think that this is too much and it is no longer possible for the price to return. In fact, this is not the case. It is necessary for the price and health of the market, although this decline did not happen easily, but it can be recovered from here.
Stay tuned
This chart is likely to help you in making better trade decisions if it did consider upvoting this chart.
Would also love to know your charts and views in the comment section.
Thank you

Washing machineAltcoins are an incredibly dangerous market
Lucrative when you get in early
Punishing if you get in late
Regardelss of the quality of the team or particular project
These things are a speculative gold mine if properly understood but extremeley dangerous if misunderstood
Required understanding includes human/market psycology on a multiple timeframes and an understanding of physical systems, networks and financial tools aswell as a grasp on exponential and logscale maths, drastic % swings.
Beyond this as an investoor you should be careful when and how you approach this early marketplace, understand the halving cycles, the bull bear market portfolios/ the ratio of btc/eth/alts and the speculative frenzy that is the time to take profits.

TOTAL 3 weekly chart is sitting the biggest support in history.TOTAL 3 weekly chart:
The Long yellow rectangle support box may
be the most important support in the entire
Market as a whole. When there is around 19,000
Alt-coin projects relying on BTC holding and this
huge monster support box holding, this is Do or
Die...Im confident in the coming 300 days,
we will see all time highs in the TOTAL 3 market.
The Green $2.674 Trillion is my Super bullish
prediction coming from measurements. and the
smaller yellow rectangles are the falling bearish
support boxes....lets hope we dont see the candles
fall lower. The RSI has never been this OVERSOLD, we honestly should be moving up
bc we are in uncharted territories and sentiment should change.

TOTAL 3 TARGET 1 METTarget 2 is about to play out, called this months ago.
Hope this shows you the influencers are mugging you off when they are teaching you how to trade :)
Market Psychology is the most important thing, emotional intelligence.
@mohanee for the great scripts :-)
