Crypto Total Market Cap (Excluding BTC) Weekly Chart Analysis
The chart reveals a multi-year symmetrical triangle pattern, with a decisive breakout above the resistance trendline. This signals a potential shift toward sustained bullish momentum.
The breakout aligns with increased market activity (volume not visible but inferred), indicating robust participation and validation of the upward move.
The price action is comfortably above the weekly 50 EMA (yellow line), acting as a dynamic support and confirming the strength of the bullish trend.
$1.39T (previous resistance now flipped into support).
Minimal resistance ahead until the psychological $2T zone, with the potential for all-time highs.
If the breakout holds, the measured move from the triangle's base suggests a target range of $2.5T—$3 T, marking substantial upside potential.
Continued consolidation or retest above $1.39T could trigger an extended altcoin rally, propelling the market to new highs.
Bearish Scenario:
Failure to sustain above $1.39T might lead to a retrace within the triangle, stalling bullish momentum.
Disclaimer: This analysis is for informational purposes and is not financial advice. Always stay updated with market movements and adjust your trading strategies as needed.
You can DM us for information on any other coin.
@Peter_CSAdmin
Total3

TOTAL 3 is ready to BLOWUSDT, recognized as the first stablecoin, did not achieve widespread adoption even as late as 2017. Had it been more prevalent, I would have incorporated USDC and DAI into this analysis.
Nonetheless, I trust that you will find this chart beneficial for the upcoming #Altcoin season.
The total market capitalization of USDT relative to that of Bitcoin reveals a distinct correlation.
This relationship has historically indicated significant technical peaks characterized by bearish divergence, as well as bullish divergence at market bottoms, as observed in the RSI versus ratio score.
Additionally, we have established a clear target level to pursue.

ETH | ALTCOINS | All Time High NOT IN - Here's WhyToday as I looked at the Ethereum chart, I noticed that unlike BTC - a new ATH has not yet been formed. Interesting, I thought to myself, since ETH usually moves quite closely with BTC.
That is until I pulled up my trusted 3 (Bitcoin, Bitcoin Dominance and TOTAL3) and overlayed Ethereum. A key insight emerged from watching past behavior, leading me to the conclusion that the All Time High for Ethereum is still coming (and likely soon).
Don't miss yesterday's update on an Alt that can still see great increases:
_________________
COINBASE:ETHUSD CRYPTOCAP:BTC.D CRYPTOCAP:TOTAL3 BITSTAMP:BTCUSD

Total3 chart breaking up from inverse head & shoulders patternThis is the chart that is every altcoin except for ethereum. Bitcoin is also not factored in. We can see it appears to have broken upward from the inverse head and shoulders pattern and the breakout target should be around 1.27 trillion. We also currently have the potential for a cup and handle to be formed with an even bigger breakout, but I want to see an actual handle forming first before I post a target for anything like that. *not financial advice*

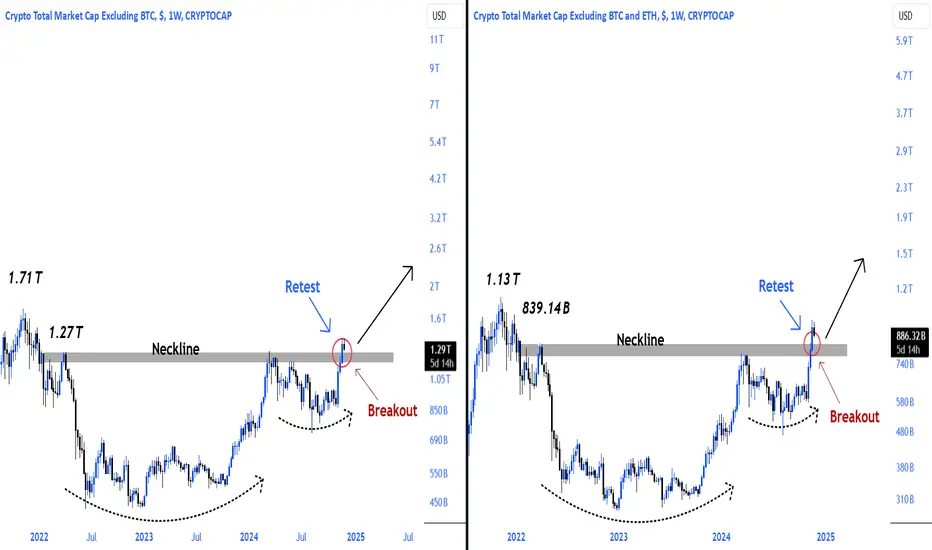
Alts market Cap TOTAL2 and TOTAL3 retest done!#Alts market cap TOTAL2 and TOTAL3 handle cup neckline area and major resistance area were retested.
TOTAL3: 839.14B breakout and retest
TOTAL2: 1.27T breakout and retest
#Altcoins hard send is coming!

BTC ATH | Bitcoin Dominance | Alt Season Interesting insights can be gather from the Bitcoin dominance chart and the altcoin chart (TOTAL3).
You can see some interesting patterns when you overlap them, and monitor for previous "fractals" or patterns.
Some of the key insights you can gain from this combo:
👉 The BTC peak / ATH, or not
👉 The end of Altseason
_________________________
COINBASE:BTCUSD CRYPTOCAP:BTC.D CRYPTOCAP:TOTAL3

Alts market cap Total2 and Total3 retest week#Alts market cap TOTAL2 and TOTAL3 retest after successful weekly major breakout!
#Altcoins will send hard after Retest!
$TOTAL3 & $OTHERS Alt Season Breakout vs $BTC.D !!!If you’re still wondering whether Alt Season is here or not, this is the only chart you need to see to prove it is.
BTC.D has been going down while CRYPTOCAP:TOTAL3 has broken previous ATH with CRYPTOCAP:OTHERS lagging a bit behind.
This shows the rotation from CRYPTOCAP:BTC -> Mid Caps -> Small Caps
Monetary policy, more importantly rate cuts, have signaled “Risk On”, and the market has responded accordingly.

#Altcoins run it back!#Alts market cap TOTAL2 and TOTAL3 breakout and closing was made on a weekly basis at the level corresponding to the March April 2022 and March April 2024 major resistance area and also the handle cup formation neckline area.
#Altseason is approaching!

When is the best time to buy Altcoins?The short answer is... Now, this year into early next year.
Although I would expect a lot of similarities this market cycle, I would also expect some differences.
So let's start with the yellow diagonal line with the up trend. This line was originally drawn through the BTC price action. Look at how it actually works perfectly with the TOTAL3, PERFECT!! So, according this chart the alt cycle big moves won't come until 2024 around the September time frame.
If we pay attention we will notice a separation From the the BTC market cap to the TOATL3 market cap that opens up during the bear market. We can also see it also mimics the bitcoin market cap until it finally closes the gap in the final stage. Solid yellow line is the BTC market cap & the candles are the TOTAL3.
The bars between moves
88 BARS is from top to top
57 BARS is from top to the start of the final wave (double bottom)
36 Bars is from when it breaks the up trend to
Not market on chart.
62 bars from the breakdown of the trend line to breakthrough back above it would but it in early February of 2025, pretty much right on schedule.
This chart is on the 2 time frame so each bar equals 2 weeks..
The indicators below are TDI and RCI 3LINES.
Here is where some of the differences might come in to play.
we'll look at the TDI first. I want you to keep in mind that I have zoomed in this indicator to show the moves more clearly. In 2019 the RED line (fast moving line) made a fairly big move up and broke through the top of the channel. It then dropped below the middle line (Yellow) and went sideways until it's next move again piercing the top of the channel although not as high into the inevitable
COVID Crash. Comparing to this bear market the TOTAL3 has made a move off the assumed bottom but it wasn't as strong as the move in 2019 as shown by RED line. Also this time the RED line seems to have found support on top of the Yellow line showing more strength in the correction phase. If it does n=hold I would expect the next move to be higher than the initial one which would be different from the last bear market. I also think this will continue all the way up.
RCI 3LINES RED FAST / BLUE 2ND FASTEST / GREEN SLOW
The all important Blue line has crossed up on the green line. Once the red line turns back up, the move will follow.
All in all it is good time to start to accumulating your altcoins of choice. Keep in mind although they do move together for the most part, they all have they own cycles as well.
Thank for looking. Let me know what you think down below.
WeAreSat0shi

Total 3 The chart illustrates the total cryptocurrency market cap, excluding Bitcoin and Ethereum, currently consolidating within a descending channel, often recognized as a bullish flag pattern. This pattern emerges after a strong upward movement, suggesting the potential for further gains once the consolidation phase concludes. The market is fluctuating between two red trend lines, which represent the upper and lower boundaries of this flag.
Key levels of support and resistance are highlighted on the chart. The resistance level, around 783 billion USD, has been tested previously but remains unbroken, causing the market to pull back. On the downside, the chart identifies a strong support zone near the 550 billion USD marked in blue. This area has consistently served as a critical support level, making it a pivotal point to monitor for any potential bounce.
The overall sentiment expressed is one of optimism, a massive bull run for altcoins. The ongoing consolidation within the bullish flag is viewed as a temporary phase before a likely breakout to the upside. After a confirmed breakout from the bull flag which could confirm the continuation of the upward trend and potentially signal the beginning of a new altseason. This indicates that the market may be on the verge of a significant move, and traders are advised to monitor these key levels for possible trading opportunities.

Altcoins Hit Major Resistance: What’s Next for TOTAL3? 🚨 Altcoins Hit Major Resistance: What’s Next for TOTAL3? 🚨
📊 Altcoin Season 1st Milestone Reached – But Can We Push Higher? Or a correction is first? 🌟
The Total3 Chart (Altcoin Market Cap Excluding BTC & ETH) has finally reached the long-anticipated 600B–938B range, a critical resistance zone that’s been in focus for over a year. 🚀 After breaking out of a descending channel and delivering strong bullish momentum, altcoins are now at a make-or-break level. Let’s dive into the key areas to watch next! 👇
🔑 Key Insights:
938B Major Resistance: Total3 has climbed steadily to this key level, but it must break and flip this resistance into support to sustain the rally.
Channel Breakout: After months of consolidation within a descending channel, altcoins made a clean escape, sparking a rally to the current resistance.
Potential Scenarios:
1️⃣ If the breakout succeeds, the next bullish target is 1.33T, opening the door for explosive altcoin growth.
2️⃣ A rejection could lead to a retracement back to 600B support, providing fresh entry opportunities for the next leg up.
⚠️ Why This Matters: This is not the time to FOMO! 📉 While the altcoin market has shown incredible strength, the risk of correction remains high unless we see a strong breakout. If this resistance holds, short-term pullbacks could offer better buying opportunities.
Strategy Alert:
Bullish above 938B, targeting 1.33T.
Watching for a rejection to add positions closer to support levels.
📈 What’s Your Play? Let me know in the comments if you’re eyeing any altcoins to ride this potential breakout or waiting for the next dip! Stay tuned for further updates.
One Love,
The FXPROFESSOR 💙

I bet you are not watching this chart of TOTAL3#ALTSEASON Update🚀
Let’s dive into some detailed alpha!
Take a look at this (Total3-USDT-USDC)/BTC chart. It clearly indicates that #Altcoins could bleed by a maximum of 20% further from current levels in CRYPTOCAP:BTC pairs. However, this doesn’t necessarily mean they’ll lose value in USD terms if #BTC continues to pump, which seems likely in the coming weeks.
Following this, altcoins are expected to start outperforming BTC and will likely peak when this chart reaches around 0.56, with another possible top at 0.91.
PS: The altcoin market is highly fragmented this cycle. Not every altcoin will pump equally or peak at the same time. However, overall, the altcoin market could potentially achieve a top near the 0.91 level, which represents a 3x increase from current levels.

TOTAL2 - Bullish Breakout, Alt Season Could Be Upon UsTotal Crypto Market Cap excluding Bitcoin. Alts may be ready to explode!

#Altseason parabolic run loading!Alts bullish season is loading with an upward break and retest of the bullish arm cup formation
#Alts market cap #total3 are looking ultra bullish!
#Altcoins are generally still in hibernation!

TOTAL 3 - Crypto Total Market Cap excluding BTC and ETHVery technical. A global trend, followed by a correction to the 0.618 Fibonacci level and the global order block, which is also the PoC (Point of Control) of the entire trend movement. We're clearly moving within a kind of wedge.
We haven't been fans of technical analysis for a while, but part of it will always stay with us. I think this is one of those moments when, after it plays out, people will look back and say: "How obvious it was."
There are two options here: either one more update of the lows on altcoins or a correction upwards. Two scenarios, but globally, it doesn't change anything.

very lil TA skills Altcoin 3 optimistic guess from here As of now I still have very little TA skills, and on this optimistic version of my guess/prediction from here, I just used the same few revelations I came across when I did my first ever btc chart (finding a parallel channel that fits previous price action, and then just duplicating the the parallel channel and stacking it, to get a basic blueprint of an overlay of potential resistance and support lines), combined with TA techniques from free Crypto Crew University youtube videos and an aggregate of other youtubers here and there, and I'm probably using some wrong but yea, this is my 'bullish' and optimistic guess/prediction as a first full cycle 'retail' hodler.
If i'm not going on what I want to happen, my bearish feeling and guess/prediction would be, a 25%-35% sell off before or after thanksgiving, and either going back up shortly after and keep running through 2025 or worst and what it feels like, toping out around the 10th-14th of December.
Feel free to tell me what will likely happen if you are an experienced TA chartist.

Parabolic #Altseason loading!#Altcoins matket cap #Total3 is on the verge of a big breakout!
#Alts are on the verge of a big breakout like before the 2021 mega bull season!

#Altcoins parabolic run coded!As of q4 2024 #Alts run has generally started!
God candles that will turn into #altseason will be inevitable!

TOTAL3: alt seaon is coming soonIt looks like the MACD is about to cross on the 1W time frame, signaling the potential start of an altseason soon.
The chart speaks for itself.

ALTCOINS TOTAL3 Altcoins have struggled in the last 5-6 months since BTCs slowdown.
Some alts are down 80% from their highs but are now displaying a promising pattern for the bulls. The chart shows the daily support that intersects 3 points that make a head and shoulders pattern. This H&S pattern is an important reversal structure that if gets completed would signify the bottom of the downtrend and the beginning of an uptrend.
Since this H&S reversal TOTAL3 has flipped the 1D 200EMA and is now at diagonal resistance. Should this resistance be broken and accepted above as well as the WEEKLY S/R then the next target is DAILY RESISTANCE. This would be great for smaller can alts especially the newer projects that have not experienced a Bullrun yet.
In terms of a trade setup. I would place an SL below the local low as this would be a trend break and could signify a further sell-off.
Take profits @ DAILY RESISTANCE, $720B & $780B.

Altseason, Microcaps & Bitcoin ATH | BTC | BTC.D | TOTAL3An important analysis as the first part of my ongoing outlook for Bitcoin, now that my target has hit.
Not too long ago, I did a focus on altcoins by market cap - and the order in which they rally. This mainly speaks to the top 10 altcoins by market cap, and how they follow BT closely.
However, throughout the cycle, you will see microcaps move independently, aka pump and dups, but the real parabolic increases will happen when BTC is trading bullish, especially towards the peak / just after the peak of BTC. Together with watching the Bitcoin Dominance chart, that is what we discuss in more detail today.
___________________
BINANCE:BTCUSDT BITSTAMP:BTCUSD CRYPTOCAP:BTC.D CRYPTOCAP:TOTAL3

Provides analysis of cryptocurrency market cap (CRYPTOCAP)The red line shows the 50-week moving average, which appears to be a crucial support level for the overall trend. Historically, the market cap has respected this moving average, with upward momentum when trading above it.
This area acts as a strong support level, as it has historically provided a solid foundation for price recovery. The total market cap has rebounded from this level several times, indicating buyer interest.
This is a crucial resistance level, as the market has reversed from this area before. If the total market cap approaches this area, selling pressure may occur.
The white diagonal line shows a long-term ascending trendline, suggesting a steady upward trend since 2018. This line further strengthens the overall bullish trend, as long as the total market cap stays above it.
Currently, the total market capitalization is testing the 2.728T level, which is close to recent highs, with a possible bounce if it breaks above the red resistance zone.
The overall outlook appears to be bullish, but it is essential to keep an eye on any significant moves around the resistance zone and the 50MA, as these will influence the long-term trend.
Disclaimer: This analysis is for informational purposes and is not financial advice. Always stay updated with market movements and adjust your trading strategies as needed.
You can DM us for information on any other coin.
@Peter_CSAdmin
