Chart Idea - TOTAL3 to the moon !TOTAL3 finally broke out the bull flag. Raging ALT season is here. I am super bullish on ALTs atleast until Jan 2025. This is one of the best chart out there. I do not need to explain here as everyone who knows about the ABC of trading would know what a bull flag break out is and what the TP would be.
Let's go to the moooooonnnn !!!!
NOT A FINANCIAL ADVICE! DYOR
Total3

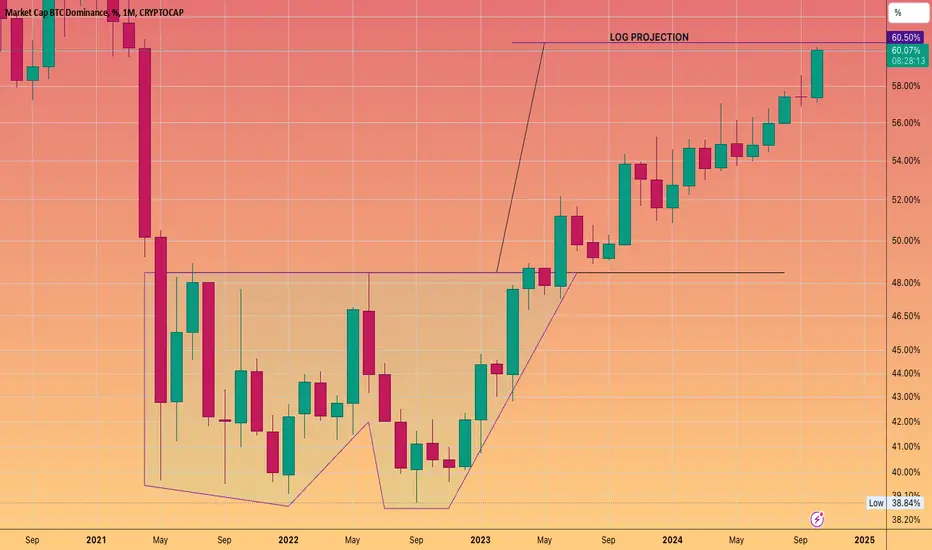
$BTC marketcap critical point, signaling the alt season coming.CRYPTOCAP:BTC has reached a critical 60% dominance level, which in the past has often signaled the start of an alt season. While history doesn’t always repeat itself, several other indicators confirm this signal:
- Stochastic RSI is highly overbought
- Bearish divergence
- MACD is also in overbought territory
Based on my analysis, altcoins are likely to see some relief in November, potentially pumping and outperforming $BTC.

BITCOIN DOMINANCE about to hit double bottom target.Let's see how it reacts once there
Does it pus on through
tap it
does it consolidate
or start its reversal
ANALYSIS | Crypto by MARKET CAPAs of time of posting, according to a reliable website the top 10 cryptocurrencies by market cap are as follow:
1) Bitcoin / BYBIT:BTCUSDT
2) Ethereum / BINANCE:ETHUSDT
3) Tether / COINBASE:USDTUSD
4) Binance Coin / BINANCE:BNBUSDT
5) Solana / BINANCE:SOLUSDT
6) US Dollar Coin / KRAKEN:USDCUSD
7) XRP / BINANCE:XRPUSDT
8) Dogecoin / BINANCE:DOGEUSDT
9) Tron / BINANCE:TRXUSDT
10) Toncoin / OKX:TONUSDT
11) Cardano / BINANCE:ADAUSDT
12) Avalanche / BINANCE:AVAXUSDT
You can find and track this easily by searching "Cryptocurrencies by market cap" or something in that line.
On the charts you will see the king - Bitcoin, as well as TOTAL (total cryptocurrency market cap) which is currently at 2.28T, and at the bottom right TOTAL3 (total cryptocurrency market cap without BTC and ETH), currently at 6.19B.
It's important to note that BTC determines the general direction of the altcoin market, but Cryptocurrencies do not necessarily move together with traditional assets such as stocks. That's why it's important to determine the macro trend before trying to analyze any individual coin. This is especially true for crypto's with a higher market cap. As you begin to look at altcoins that have smaller or micro market caps, they tend to dump/pump unexpectedly without moving together with BTC.
You'll often notice that the top 5-8 alts have similar chart patterns to BTC. Although they do still move within their unique support/resistance zones, it's safe to say that when you see a H&S on Bitcoin, you'll probably see it on the large-cap coins as well. I will say this - it's not the case for XRP and ADA. (I'm surprised to see they still hold such high positions in the ranks and I have a hard time identifying the potential reason for this other than old bag-holders/cult following).
With this info, you can conclude to a range of different outcomes, including but not limited to:
🥠 Using crypto as a hedge against traditional assets
🥠Using microcaps as a hedge against BTC
🥠 Microcaps carry more risk
That all being said - trading is risky, and crypto particularly more so. Even hedging doesn't guarantee safety when it comes to crypto.
____________________________

fcking bullish for alt seasonThe inverse head and shoulders pattern, along with a pullback on the chart, is a clear bullish signal for altcoins and needs no further explanation. At this point, we are facing only two possibilities: a world war, or an altseason!

TOTAL3 Projecting 70-90% leg up. indicating ALTCOIN SEASON!So TOTAL3 mcap looking very bullish on daily time frame.
It does look that mcap might double in upcoming year.
Pack your bags and get on the space ship, we going to the moon!

The Altcoin Market Is Now Flirting With The 350 DMA ...Again!Here's what that means. A long-term view.
Traders,
The pressure is on for these altcoin bulls to run through the end of the year. However, we are flirting with disaster this time around. Here's why?
From the beginning, the 350 DMA (or 50-week MA) has always told traders whether we were in a bull market or a bear market. Though periodically, the price did stick its proverbial head above the 350 DMA during mid-cycle tops, these were always very short-lived. And it's always been the case that when we've remained above the 350 DMA for this length of time, in this case since Nov of 2023, it signaled we were in a bull run, as opposed to a mid-cycle top. Could this time be different? Well, of course. And I think from looking at the charts, it already has proven it is. This whole run is different.
I won't get into the many ways this cycle is different, but a big one has to do with how the 111 DMA is diverging from the 350x2 DMA (not pictured here). That's never happened before along with a multitude of other occurrences. So, let's explore this thought experiment a bit further. There are several outcomes that we most probably are looking at.
The first outcome could mean that this run was simply an extended mid-cycle top. If true, then this is a much longer mid-cycle top than we have ever witnessed in the history of crypto. And if that is true, the bull run that is coming will melt faces. But it probably would not arrive until next year or even 2026 and it probably means that we dip back under that 350 DMA again for a while. Nobody wants this to happen and nobody seems to be expecting this outcome. Could this then be the strongest possibility? If we anthropomorphize the market a bit, we can observe that it is rather sadistic in this regard. It always has been and probably always will be. The market just enjoys hurting the largest crowd. This is why it's often beneficial to entertain contrarian thought and not to simply dismiss it altogether.
The second outcome is not so good. It could mean that we skipped our mid-cycle top completely and that our bull run is about to end if we dip below that 350 DMA. Now, there is still hope here because we haven't done that yet. But I certainly do not like the looks of how we have been flirting with that line for these last several months. This moving average is critical! Watch it closely on both the daily (as a 350 DMA) and on the weekly (as a 50). The weekly will confirm whether we drop or not. It must be confirmed with two candle closes below on the weekly.
There is a third possibility. This is the one that I think we are all hoping for and, tbh, most are expecting. It also indicates that we skipped our mid-cycle top and are in a bull run that will not end until late this year or into the next. This would mean that we will remain above that 350 DMA (though, there could be a few candle closes below) and that we should see some new highs being made through the end of the year.
I kept our chart on the daily view as opposed to the weekly because I wanted you all to track that bullish triangle with me. Notice how we are retesting the top of it as we should after a breakout. This is technically very sound. But also notice how that 350 DMA is moving up to lend some support. What a beautiful area of confluence! But also, scary. Because if it's broken to the downside, it may indicate either another Black Swan event on the horizon OR we don't get the bull run alts were expecting.
It is do-or-die time now. Let's go.
Stew

ALT M.CAP: JUST DID A RETEST! HODL YOUR ALTCOIN BAG!!Hey everyone!
If you're enjoying this analysis, a thumbs up and a follow would be greatly appreciated!
What is Total3?
Total3 refers to the total market capitalization of all cryptocurrencies except for Bitcoin (BTC) and Ethereum (ETH). It provides a clearer picture of the overall market health of altcoins, excluding the influence of the two largest cryptocurrencies.
Now, let’s analyze its chart.
If you're worried about the recent dip in altcoins, take a look at this chart. Total3 has broken out from a bull flag on the daily time frame and is currently retesting that flag. If it holds at this retest level, we can expect another bullish rally in altcoins soon.
Don’t be scared by negative news like the war; such situations are temporary, and the market has rebounded many times in the past. Use this dip as an opportunity to dollar-cost average (DCA) into your altcoin positions. If you've already accumulated, just hold patiently.
What are your thoughts on Total3's current price action? Do you see a bullish pattern developing? Share your analysis in the comments below!

TOTAL3 is time to continue push UP 1. Cup and Handle Pattern:
The highlighted region resembles a cup and handle pattern, which is generally considered a bullish continuation pattern.
The cup part spans from around mid-2021 to mid-2023, while the handle is forming after the cup's completion, indicating potential consolidation before a breakout.
The rounding bottom of the cup shows accumulation after a downtrend, signaling a reversal in trend.
2. Breakout Target (1.618 Fibonacci Extension):
The projected target is marked with a 1.618 Fibonacci extension, a common tool used to predict possible upside after a breakout. This level is approximately 1.618 trillion USD.
The price has already started moving upwards after the handle formation, suggesting a breakout might be underway.
3. Current Market Situation:
As of the latest candle in the chart, the total market cap excluding BTC and ETH is sitting at 634.208B USD.
There’s a notable surge of about +12.91% in the current period, which aligns with the idea of bullish momentum taking over after the handle's formation.
4. Bullish Flag (Handle):
The handle portion seems to form a bullish flag, which is a continuation pattern that confirms the overall uptrend.
Once the price breaks the handle's resistance, the expectation is a rapid increase in market cap, potentially reaching the target shown.
Conclusion:
The chart indicates a bullish outlook for the altcoin market (excluding BTC and ETH).
The cup and handle pattern is one of the strongest continuation patterns, and with the market currently showing signs of strength, a breakout could take the market cap towards the 1.618 trillion USD target if the current trend persists.
However, be mindful of market sentiment and global macroeconomic factors that can affect crypto markets.

TOTAL 3 BULL CYCLE BEGINSTotal 3 recently broke a downtrend and now it's ready to grow. If you are scalper or 3 minute trader, this information is not going to be usefull for you. All you can use from this map is bias, which is bullish at the this very moment.
For all the others who invest in a smart way;
Next fall of Bitcoin will not be as expected. From this day forward, if you see any crash on market just know that it's a buy opportunity.
Invest in projects that can gain value, not old projects that already hyped and died long ago (Like OP, DOT, EGLD.. Ect.)
If you are using leverage, either from here or in next crash use only 2 X in isolated mode.
Mark your TP for higher targets and think big.
I market Total 3's targets on the chart. Every fib zone in this area is a resistence for altcoins. It doesn't matter which one you have (ecxept ETH), it will work just fine.
Wait for a correction and find strong projects like SOL, BNB, Render, Near Ect..
Do not invest shitcoins or whatever your friend suggested you to invest.

TOTAL3-USDT - RISK ON - ALTSEASON IS HERE!This will be the most important Weekly Close of the cycle for Altcoins.
TOTAL3-USDT has shown a “3 White Soldiers” pattern and broken out of its Bull Pennant and Bull Market Support Band.
RSI has also flipped bullish.
The last time this happened Q4 2020, Alts ripped ~1,100% over a 1 year period.
This rally has been fueled by the Fed announcing a massive 50 Bps Rate Cut, with PBOC doing the same shortly after.
More rate cuts are expected November 6th and December 17th to push risk even further.
Get ready for all your normie friends to start messaging you asking for crypto advice.
I personally have experienced this the past week.

Altcoin Market Breaking Out: Bull-Flag!Altcoins have been steadily losing value against BTC ever since the March top. However, TOTAL3 (total marketcap minus BTC+ETH marketcap) has finally broken out of a 6-month bearish channel pattern, making it a successful bull-flag break out.
It's too early to call for a definitive continuation of the trend, but at least a major long-term pattern has changed as of this week.
For now, I'm hoping for a move towards the yellow line, being the 2024 top. With a BTC Dominance at 57.5%, it would most likely lead to a new BTC all-time high if the altcoin market reaches the 2024 top.
Potentially exciting times ahead!

TOTAL3 8H update - Sep 23 2024Following previous analysis, #TOTAL3 rose towards the resistance zone and after touching the 580B level, it started to drop but FED's decision to cut the rates by 0.5% prevented further drop and market pumped as analyzed before FED's meeting.
TOTAL3 is now in the vicinity of the mid-term trendline and we can expect some drop during this week. What comes next with TOTAL3 is most probably a rise towards 650B level and then 700B zone.
This means many coins are going to touch higher levels soon.
As long as the drawn blue trendline isn't broken, this analysis is valid.

TOTAL3 now can gohey boy in this chart can see total3 breakout go to new HH
not forget follow me to get more news

TOTAL3TOTAL3 ~ 1W ✅
If you want to see when is the right time for AltCoin to rise parabolically,. You need to pay attention to this chart.
A breakout of this descending pattern will allow Altcoins to rise massively.

total3 start nowhey goy this chart fot total3 it bulish to new bolrun it coming soon ...
soo buy more coin leader of market gud luck

Bitcoin FULL Analysis PART 2In a previous analysis, I discussed the relationship between Bitcoin, the Altcoin market and Bitcoin Dominance.
An important rotation exists between these three; and by using TOTAL3 together with BTC.D, you can get a clearer picture of where BTC is trading in the current cycle.
In this video, I make an important suggestion based off Elliot Wave Theory. This theory is backed up by the points mentioned but also by the Logarithmic view:
From the log scale, we can see BTC is still trading relatively low compared to previous cycle top-outs. So the question remains - the end... or just the beginning?
________________________________________
COINBASE:BTCUSD BINANCE:BTCUSDT CRYPTOCAP:TOTAL3 CRYPTOCAP:BTC.D

TOTAL3 on the verge of a massive breakoutThe altcoin sentiment is in the gutter, FUD everywhere, everybody is calling for "recession", including the stock market. Perfect conditions to turn the ship around and blast off to new highs and leave sideliners angry.
Historically, squeezing Boilinger bands point to a big volatility move after consolidation. Let's see how this play out.

TOTAL3 update - Sep 08 2024#TOTAL3 followed previous analysis and started to drop from the vicinity of the 630B zone and crossed below the support zone of 565B - 580B .
520B area was a demand zone which was touched on Friday. it seems TOTAL3 is heading for a retest of the broken zone of 565B - 580B meaning that altcoins are going to have some upward move during the upcoming week.

CHEAP ShitcoinzIf you believe in the Crypto 4 year cycle
Here is a thread of cheap altcoins in USD terms, that have good technical patterns or sitting on previous support zones from which prices have rallied before.
There are no guarantees only probabilities.
Your capital is at HUGE risk gambling on S coins.
With that being said.
Let's kick it off with LOOM network.

We are in the most critical period for altcoins.There is a gap and pins that can be filled in the middle term.
There is also a nice falling wedge can be break up any time. Above 0.5 is bullish for me.
I showed other important levels on the chart.
A possible new downtrend wave would be a good buying opportunity for me.
* What i share here is not an investment advice. Please do your own research before investing in any digital asset.
* Never take my personal opinions as investment advice, you may lose all your money.

Altcoins Can Drop Another 75% - Worst Case Scenario!In this analysis I want to talk about a long-term parallel channel on TOTAL3, which is the total marketcap of all altcoins.
Preface: before everyone gets offended etc, this is not my most likely scenario. Big chance that this pattern won't play out. Nevertheless, it's important to consider different market outcomes. Trading consists of IF>THEN decisions. Ask yourself, if the market drops another 75% from here, what will you do?
Now into the analysis.
The parallel channel is constructed from the top resistance and anchoring that resistance to the 2020 covid dump.
As seen on the chart, alts lost over 92% of their value in the 2018 cycle. Currently, alts have lost 75% of their worth during the last cycle. If alts were to go down towards the bottom yellow support, they could lose around 85%-88% (depends on time) value.
In other words, if this worst case scenario were to play out, alts could lose 70%-7% of their CURRENT value.
Is this pattern likely? No. Should you prepare for it? Yes. Keep it simple, assume that the bottom support area is a great long-term entry point and can function as a bear-market bottom in case we go down further.
There is definitely some risk of a recession as per my last yield-curve analysis. Furthermore, the SAHM Rule Recession indicator (google it) signals that a recession is coming. If the stock markets would go down like in 2001 and 2007, we're in for a wild ride in crypto.
Happy to hear your thoughts.

#TOTAL3#TOTAL3
#ALTS
The altcoin market is heading for a very good rise by the end of this year 2024
Targeting 1.2 trillion
The price is moving in a descending channel on the 4-hour frame and is largely committed to it and is expected to break it upwards
We have a rebound from a major support area at the lower line of the channel at
573 B
We have a downtrend on the RSI indicator, which supports the rise
