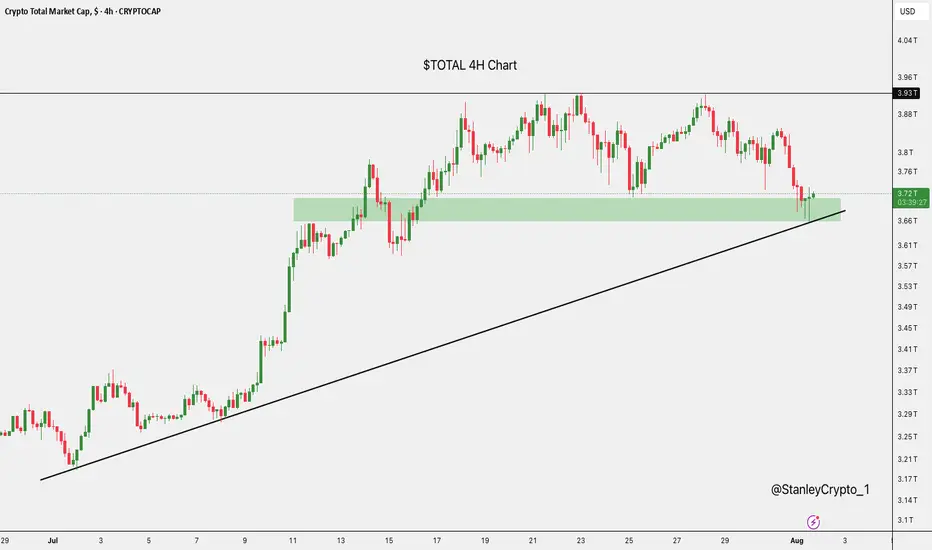
$TOTAL at Key SupportThe crypto market cap has just bounced off a strong support zone around $3.67T, right where it aligns with the rising trendline.
This area has held firm before, and it's doing the same now.
If it continues to hold, we could see a nice recovery.
But if it breaks down, there’s a risk of more downside ahead.
Totalcryptomarket
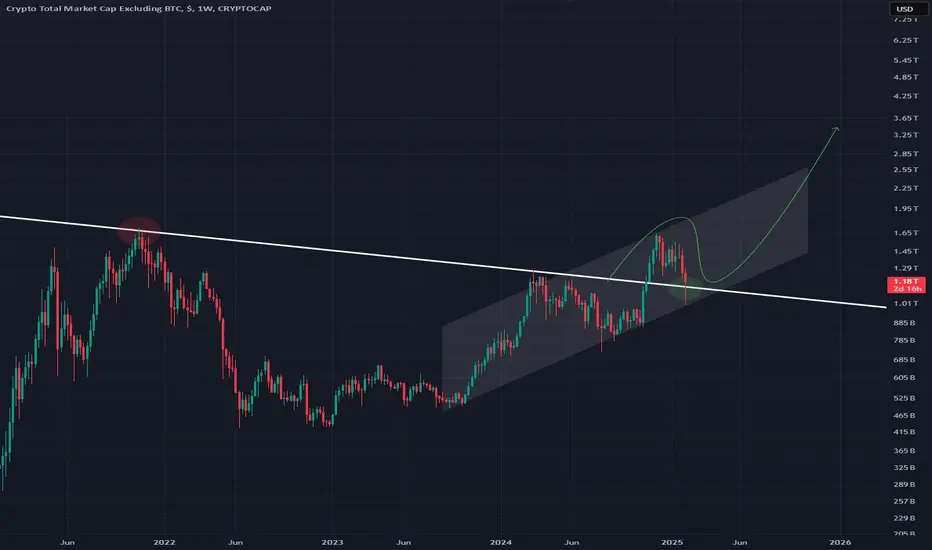
Altcoin Market at Critical Resistance!The total crypto market cap excluding Bitcoin (TOTAL2) is still sitting right below a crucial resistance zone. A breakout from here could trigger a strong altcoin rally — but until then, patience is key.
It’s a waiting game now…

TOTAL Analysis (12H)Red candles may be approaching for the TOTAL market cap parameter.
Currently, TOTAL is sitting right on a strong support zone that has held multiple times in the past. However, if this level fails to hold, the market could experience a sharp decline in the coming days.
Two Possible Scenarios:
Bullish case: If the market manages a bounce this week, there’s a risk of forming a Head and Shoulders pattern, which could act as a reversal structure unless invalidated quickly.
Bearish case: TOTAL has already mitigated a key supply zone (marked in red on the chart). A logical move here would be a retracement down to a nearby demand zone to regain strength for a fresh upward push.
If the current support is lost, we can expect a drop toward the green demand area between 3T and 2.85T.
Opportunity Zone: This range (3T–2.85T) will be ideal for long-term long or buy positions once reached, as it represents a high-probability rebound zone based on historical price behavior.
— Thanks for reading.

This Chart Screams Strength — Are You Positioned?The total crypto market cap is currently showing a very strong technical setup. It’s holding firm at a major long-term rising trendline, which has historically acted as a launchpad for massive bullish moves across the market. Additionally, the 100 EMA is providing solid support, further reinforcing this zone as a key demand area.
We’re also seeing a bottomed-out Stochastic RSI, now starting to curl upward — a classic early signal of momentum shifting back to the bulls. Although the market is still sitting just below the long-term resistance line, this type of structure often leads to strong breakouts once confidence returns.
If this trendline support continues to hold and the market cap begins pushing back toward the $3 trillion mark, we could see a major surge in altcoin strength. Historically, this is when altcoin capital rotation picks up and narratives gain momentum. Overall, the crypto market is flashing strength — and this might just be the calm before a powerful altcoin rally.
Thanks for reading! Please do like and follow us for more updates.

Total 3 targeting 1.5TWelcome back dearest reader,
This is going to be a short one, all information is in the chart above.
Total 3 has been in a Massive Cup and handle formation.
Measured from the base of the cup till the top of the handle gives us a ''total 3'' price target of 1.5T$ which is 100x from here. If you were to do a different analysis and like flags more then we come to the same price target of 1.5T$ (Blue bars).
Price action is now retesting resistance from march 2024 as support. When this is done i expect blast-off mode.
~Rustle

I think we will see 1.7T in 2026.The most probable scenario in my head.
* What i share here is not an investment advice. Please do your own research before investing in any digital asset.
* Never take my personal opinions as investment advice, you may lose all your money.

TOTAL2 - Weekly Support Possibility The middle of this indicator was previously seen as a strong support
Right now this is being tested as support right now
Will it act as support as before or break down further?
Weekly timeframe for this indicator which is still in its bullish state

TOTAL CRYPTO MARKET CAP is back-testing the cup & handle patternIt's no mystery that the crypto market has been getting hit pretty hard since mid-December. However, the total market cap—which had previously broken out of a nice cup-and-handle pattern—is now backtesting the rim line and looks to be setting up for what could be an incredible move upward over the next 6 to 9 months, with the potential for a double within that timeframe.
Good luck, and always use a stop loss!

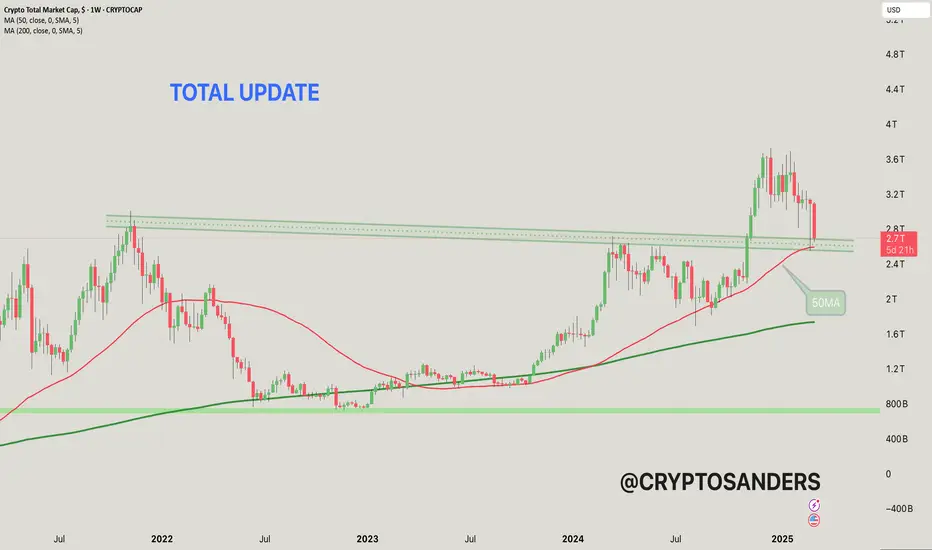
This chart shows the total cryptocurrency market capitalization,
The current value is around $2.271 trillion, which represents a significant drop of 12.51% from the recent peak.
50-MA (moving average): The red line represents the 50-week moving average, which is currently around $2.59 trillion. It acts as a short-term trend indicator and potential support level.
200-MA: The green line represents the 200-week moving average, which is around $1.73 trillion, which indicates a long-term trend and strong support level.
The horizontal green lines represent support levels around $2.4 trillion and $2.6 trillion. These levels are important for a potential bullish reversal if retested.
The dotted line above the price represents resistance levels near historical highs.
The recent decline suggests the market may be in a bearish trend after failing to break the resistance levels.
If the price is above the 50-MA, it could signal a reversal towards the resistance zones and a potential recovery. However, a break below the 50-MA could signal further decline. Keep an eye on the key levels around $2.4 trillion (support) and $2.6 trillion (resistance).
If you found this analysis helpful, hit the Like button and share your thoughts or questions in the comments below. Your feedback matters!
Thanks for your support!
DYOR. NFA
TOTAL2 - Rising MegaphoneThis structure allows for strong bullish continuation on this TOTAL2 chart
The green area line shows the continued support for price, this is also the 50MA
I believe we are going to see more support for alts and therefore the market cap will increase
Bullish on this Weekly

Total Crypto Market CapHello and greetings to dear traders,
I am proud to share with you the thorough analysis I have conducted on the Total Crypto Market. This weekly analysis not only represents a clear target for the future but also effectively outlines trend lines and buying zones on the chart.
Let me clarify the principles of this analysis by posing a few questions and providing clear answers:
Can the market experience a new peak before reaching the buying targets?
Yes, it is possible. However, I am determined to enter the market with an ideal purchasing strategy, rather than being a bystander with an empty pocket due to emotional buying at the end of market corrections.
Is it possible for the price to drop below our buying ranges?
Yes, this is a possibility. However, by using an appropriate strategy and obtaining confirmations from market signals, similar to last time, we can achieve desirable entries.
Risk Disclosure:
This analysis is provided as guidance and general information and should not be considered financial or investment advice. Engaging in any trading in financial markets involves risk and may result in the loss of your capital. Therefore, it is recommended that you conduct the necessary research before any investment and be aware that investing in cryptocurrencies carries significant risks.
Wishing you all the success!
Fereydoon Bahrami
A retail trader in the Wall Street trading Center (Forex)
Dear friends and valued companions, I apologize for using a personal logo and for my lack of awareness in this regard. In the previous analysis, the esteemed TradingView moderators hid my analysis from public view, and I was compelled to revise it. Now, with the improvements I have made, I am resending this analysis to you. I sincerely thank the TradingView community and all traders.

TOTAL2 - Support Found Above Down Trend Down trend in white has become a support level for price on this Weekly timeframe for this altcoin market
This is also within a small up channel forming
I expect further upward movement in the coming weeks
1T has a big support
The Largest Crypto Liquidation Ever!Crypto's Largest Liquidation Event: Has the Market Found Its Bottom?
The recent liquidation event in the cryptocurrency market has made history as the largest ever recorded. Such an occurrence strongly suggests that the market may have reached its bottom. However, if past cycles are any indication—such as the recoveries observed in 2020 and 2022—it typically takes more than two months for a full rebound to materialize.
Historical Precedents and Market Recovery
Looking at historical events, the crypto market has shown resilience time and again, but recoveries have never been immediate. Take, for example, the COVID-19 crash of March 2020, the Luna collapse in 2022, and the FTX fallout later that same year. Each of these events led to significant downturns, followed by prolonged recovery periods before prices stabilized and resumed an uptrend.
Given this, it's crucial to manage expectations. While some investors may hope for a rapid V-shaped recovery, history suggests that most altcoins are unlikely to revisit their December highs within the next couple of months, if not longer. Market sentiment, regulatory developments, and macroeconomic conditions all play a role in shaping the recovery trajectory.
The Importance of Patience and Realistic Expectations
Crypto investors often seek quick rebounds, but expecting an immediate bounce back within days is unrealistic. If those expectations aren’t met, it could lead to unnecessary frustration and poor trading decisions. Even in the rare cases of a swift V-shaped recovery, such as the one seen in 2020, the market still took several weeks to regain lost ground, with multiple dips along the way.
For those navigating the current market conditions, patience remains key. Strategic, long-term thinking will likely yield better results than reactive, short-term trading. While it would be a welcome surprise if the market defied historical patterns and rebounded sooner than expected, it’s wise to prepare for a more extended consolidation phase before a sustainable uptrend emerges.
Final Thoughts
Although the largest liquidation event in crypto history may indicate that the market has bottomed out, historical data suggests that recovery will not be immediate. Investors should brace for a potential multi-month recovery period before prices begin a sustained upward movement. Managing expectations, maintaining patience, and taking a long-term approach are essential strategies for navigating the current market landscape.

$TOTAL Crypto Market Cap Moment of TruthNeed to Close above ~$3T otherwise we'll see another 5% dump which SHOULD be the final flush out before our next leg up...
RSI still shows some room lower, and the 50 has fallen below the 20MA, so we're not out of the weeds yet 🧐

Total market cap chart Why total is important I hope I dont need to explain. CRYPTOCAP:TOTAL
Possible Targets and explanation idea
➡️Weekly chart. Marked 2 times with trade on indicator moment to SELL and out of crypto
➡️June 2022 was a main bottom for crypto and BTC especial
➡️November - January we are under real value of total
➡️C4L direction showed also November-January whales accumulate aggressively
➡️White zones is depression zones where whales also build average entry for investments
➡️Take profit lines marked by fib levels + take profit indicator before correction
➡️ Correction I think we will see at April-May 2024
Hope you enjoyed the content I created, You can support with your likes and comments this idea so more people can watch!
✅Disclaimer: Please be aware of the risks involved in trading. This idea was made for educational purposes only not for financial Investment Purposes.
---
• Look at my ideas about interesting altcoins in the related section down below ↓
• For more ideas please hit "Like" and "Follow"!

Chainlink to $52 next?Link has been in a descending triangle since the high in December similar to a few cryptos and the total crypto market cap. It broke out a few days ago and retested the previous resistance. Next stop might be the fib of 52.

Total2 Market Cap vs BTC Market CapToday we are looking at ratio charts. We plot the ratio of Total 2 Market Cap (Total Crypto Market Cap excluding BTC) to BTC Market CAP. This ratio chart is making new lower highs this BTC Halving cycle. There seems to be no bounce from the lows and Alt coin season seems to be elusive. As we move towards the end of the halving cycle there is very little time left for this Alt season. To reach the previous cycle highs of 1.5 in the chart the Alt Coins have to more than double from here and BTC must remain at this price for the rest of the cycle. For this the total Crypto market cap must reach almost 5 trillion USD, which remains unlikely. A better estimate will be the ratio of Total 2 Market Cap vs BTC Market Cap ratio reaches 1.09 which will be 0.618 Fib retracement level. This 0.618 fib retracement repeats in many instances. The same is true for BTC.D. What do you think?

This time will be different: the story of TOTAL cryptocap UPDATEPretty self explanatory chart. Update on the previous version posted on
Still targeting the 7 T mcap. Good luck everybody

TOTAL2 2 scenariosTOTAL2 2 scenarios im looking at. Purple arrow means bullish for alts. If we go down to green arrow it means we get a pullback

TOTAL ideaThese are the key area im looking at for TOTAL during this bullrun. If I change my mind I will update below this post.

ALTS Market Cap Chart AnalysisThe ALTS market cap has broken out of a descending broadening wedge, triggering a strong bullish rally. However, it is facing resistance at a key horizontal supply zone.
The Ichimoku Cloud shows strong bullish momentum, indicating the possibility of a continued upward move. A decisive breakout above this resistance level could trigger a significant rally, further strengthening the upward trajectory of the ALTS market.
For updates on other coins or personalized insights, feel free to reach out to DM.
@Peter_CSAdmin

USDT.D Flashing BEARISH Signal For Bitcoin and Total Market CapIn this video, I've re-created a study I saw online about USDT.D (USDT Tether Dominance) and how whenever it's dropped to this trendline since 2018/2019.
It's also marked the top of the market in terms of Bitcoin and Total Market Cap.
It obviously makes sense that with money flowing into crypto and Bitcoin, that money would flow out of Tether and stablecoins... But still, this is a very interesting inverse relationship.
This is either one of those charts we'll look back at in hindsight, and think 'Well that was obvious' -- Or we'll see a break of this trendline, because...
Maybe this cycle IS different.
I'll be watching this to see if USDT.D starts rising, and BTC.D starts dropping.
This could spark a mini-alt season in the mean time, which would be great.
But I would be taking profits into resistance levels, if this USDT.D chart looks to be turning up.
What are your thoughts?
Please Like, Leave a Comment, and feel free to Share!
- Brett

Fasten your seatbelt to 10T$- Everything is in Graphic and simple ( bubbles and fibo ).
- Upper trendline from 2018.
- This double TOP in 2021 irritates abit but it won't change the future.
- how we go and when we go... i don't know.
- Cryptos are volatile and super fast.
- Where we go... i know.
- Around 10T$ MC.
- if u want to know why CRYPTOS are super fast, i have an easy answer :
- The new generation prefers watch a 30 seconds TikTok Video rather than Youtube 30 Minuts video ! ( think about it and compare to finance ).
- What i bet for the TOP of next bull run ?
- BTC around 4.5T$ MC. (45%MC)
- Altcoins around 5.5T$ MC. (55%MC)
Hodl!
Happy Tr4Ding !
