The total market capHi 🙋🏼♀️ The total market cap of altcoins is slowing picking the pace after the breakout. We will see slow upward movement in the altcoin market cap. Altcoins will give a good rally once BTC is stable in a range after this rally. Although the altcoin market cap is bullish and you can fill your bags in dips.
Totalcryptomarket

Altcoin Market Scenario TOTAL2This is the 4Hr chart for TOTAL2
I believe a double top scenario will play out as price reaches vertical levels
a short correction is definitely needed

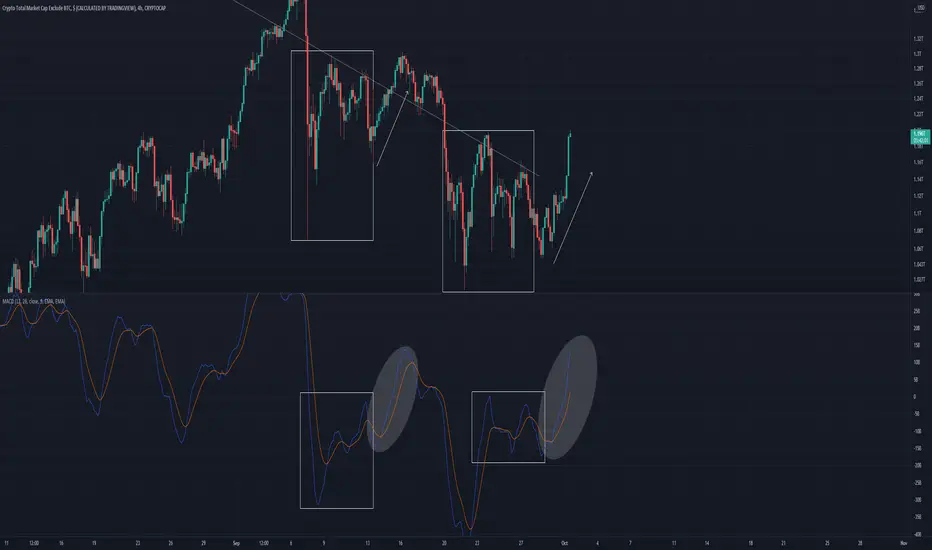
TOTAL2 Analysis 4HR (altcoin market)Repeating ABCD pattern
Either this occurs or a breakout to the upside out of the channel that has formed on this timeframe
1234 and ABCD are separate formations, with ABCD forecasted to repeat
Linking a longer term analysis of the same ticker for those who are looking to hodl for a long time

TOTAL2 Cup and Handle ideaAn idea showing a cup and handle comparison with one we have already seen on the way up during this bullrun
Last time at this stage a bullish, very bullish move was experienced, will it play out like before?
Very different price action but I still consider both Cup and Handle

Total Cryptomarket capHello
I tried to make it simple for you
Up and down but the direction will be in upside ⬆️
Goodluck

#i30:TOTAL CrptoMCap d/Aus$ Rcord Setr 🦘🚀🎨Part Idea💡Observation 👀 & Celebration 🎉
TOTAL Crypto Market Cap in Australian💲
Hits New Record Highs 📈
TOTAL in USD Surely Soon Follows 🥳
Detailed Custom Charts Below :
CRYPTOCAP:TOTAL

#ALTSEASON LAST QUARTER Could be Game Changing, Here's Why...Welcome to this quick Update, everyone.
If you are reading my updates for the first time do follow me to get more complex charts in a very simplified way.
I also post altcoin setups on Spot, Margin, and Futures.
The Total2 which shows us the total marketcap excluding BTC.
Looks bullish and we can see an inverse H&S formation.
The candle already broke above the neckline support.
Once we see a daily close above the $1.35 trillion mcap.
It could easily pump towards the $1.65 trillion mcap.
The index is trading above all important EMAs in this 8 hour chart, shows bullishness in altcoins.
Every single altcoin will pump like crazy if this pattern pays out perfectly.
I was bearish a few days back TBH, Since it got rejected from the resistance but eventually rallied again to form the right shoulder of this pattern.
On confirmation I will be posting futures and spot calls soon.
We will not miss the last quarter gains.
Invalidation of this chart will be a close below 21MA, Currently $1.3 trillion.
What's your thought on this?
Do hit the like button if you like this update and share your views in the comment section.
Thank you
#PEACE

The total crypto market will reach 10T$ very soon! EXACT month!!In this video, I'm talking about a very important indicator: the BEAM indicator.
I'm also analyzing important trendlines and fibonacci levels.
The top of the next bull cycle is very clear.
Take profit a 4T$ - 6T$ and 9T$ (nov-dec 2021 / feb march 2022 / apr - aug 2022
Let's go.

TOTAL | H4 | Technical Analysis📈In the Crypto, (TOTAL MARKET CAP) the next Rally Fall begins, this fall may last longer than the Fall in September. As you can see, the chart has swelled to a certain extent and has been steadily rising, and this rise went down in Momentum in September, and rose again to test the resistance of this rise. It's just that there are certain regions here, and as long as this decline continues, these regions will determine the direction.
📊So, the share value of the total crypto exchange is currently $ 2,324 trillion. The decline here will be at least $ 2,035 (12.35%) trillion dollars. If there is no strong support at $ 2,035, then the share price will fall to $ 1,950 trillion.
❗️ Long story short, you can't expect any Coin to rise in October, so if you bought any Coin, I recommend you sell it.

#TOTAL WHERE WE DO GO?#TOTAL , Hello everyone, I will share the analysis of the index that measures the total size of the cryptocurrency market (which shows the total market cap of the top 125 cryptocurrencies).
2.16T is the resistance level where the sellers who turn the price direction down are more dominant. We can also call it an area of strong resistance. If the price continues to stay above the 2.16T level, a bullish structure will come, and if everything goes positive, I think the cryptocurrency market will go up to 2.45T levels and rise 13%.
How far can it go down if the price doesn't show an upward movement? When we stay below the 2T level, I expect the decline to continue and the blue zone to hold the price depending on the state of the structure.
If the price continues to drop, how far can it go down? A decrease may occur up to the gray zone just below the blue zone. I don't think we will go below this level any further.
Finally, the price has not fully determined its direction at the moment, there is no structure. It's worth waiting.

Total Crypto MarketLooks like a cup and handle could be in play on the Total 1 MC.
Could also be a W or M pattern long term.
Safe trading.

Total Crypto Market 1MSomeone say: 1M Total is 🐂. Really? Look at 2 crosses Rsi & Stochastic in over brought territory

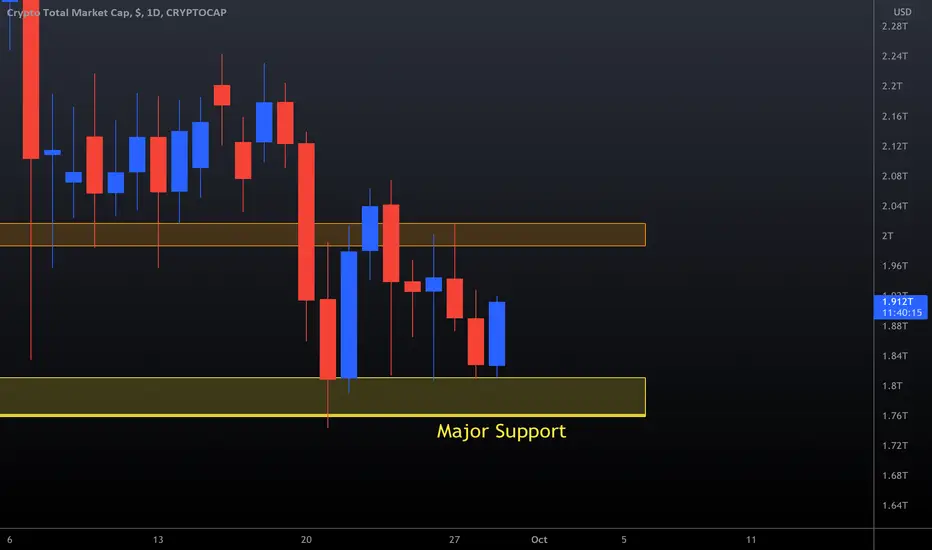
Total Crypto Market CapThe total cap is also trading between the support and resistance. So far Total marketcap is holding the major support. This is key level for the market and if $1.7 trillion support broken then we see huge sell-off. Also BTC is holding $40,000 so far. Market will turn bullish after total marketcap hold above $2 trillion.
Cool Breakout Pattern TOTAL2Just observing the altcoin market rn
I see the breakout continuing
This is on a 4Hr timeframe so it doesn't really matter in the long run
thought it was cool tho
Total Crypto MC - Max Pain IdeaFirst post here. This is just showing what could happen as a possible max pain idea for this bull run. If BTC drops down to that .618 fib and coincide with the falling wedge , I think we will have an absolute bottom there as I'd imagine MM's will be ready to pump the market and make their killing from the inflush of new retailers looking to get in onto the crypto action.
Just a theory. Not Financial advice.

Inversely related points? TOTAL2An observation on the altcoin market
It seems we are moving in a downward fashion (still in bullrun)
Comparable to the previous markets rising fashion
Both following a large period of consolidation
We still have more exponential growth to experience

Climbing Through the Circles TOTAL2Some circles showing the intersection and connection to the circle as time passes
~2.2 years is my expectation for the current bull run
Previous bull run labelled along with the bear market also
Above is the chart analyzing how I came to the conclusion of 2.2 years

A Major Trend Reclamation TOTAL2A major trend being reclaimed on the altcoin market
Similarities can be seen to the prior reclamation of the same trend line (in yellow box)
We are in for some more bull action..

TOTAL2 4Hr AnalysisThe 4Hr chart for TOTAL2 (or the altcoin marketcap)
I think the double top will follow through and bearish action is a possibility if the dotted line doesn't hodl

TOTAL MARKETCAP!The Total Index was within the resistance range to which it reacted and experienced a relatively heavy correction market. According to the 4-hour chart, Total was moving within a bullish corner pattern, which, with its loss, seems to have entered a corrective phase in the market.Friends, push the like button, write a comment, and share with your mates - that would be the best THANK YOU.

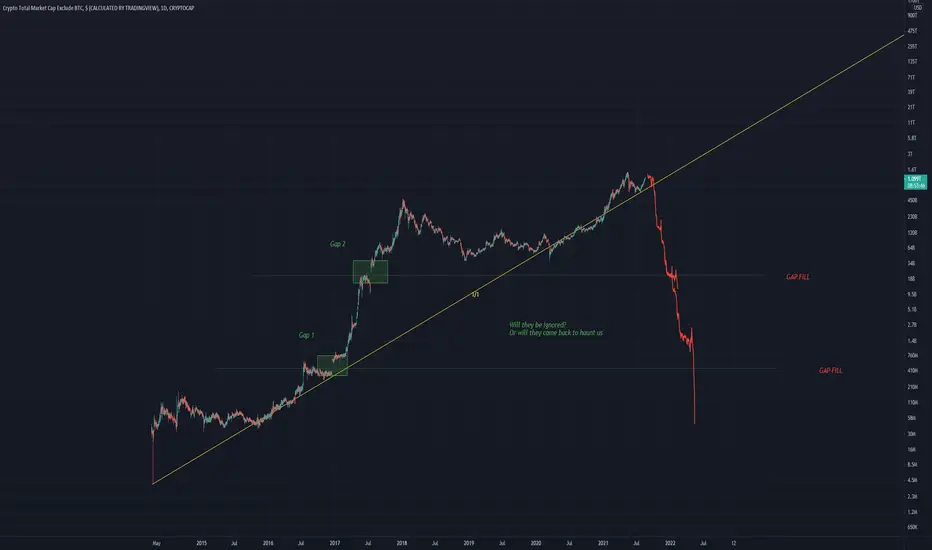
TOTALMCAP GapsWill the gaps be filled in the future with a massive bubble pop?
Or will they remain unfilled
Time will tell
Total Market Cap – Projection ReviewIt took 7 years of market ups and downs, from 2010 to 2017, for the crypto complex to reach a total Market Capitalisation of $761B. However, a similar amount ($741B) has been added in the past 3.5 weeks. Think about that a little, as much new capital has been added to the crypto markets in 4 weeks as existed in the market at the 2017 peak!
So time for a review of my previous study to recalibrate for the extended correction and the market cycle.

#TOTAL CRYPTO MCAP in Danger Position! Here's Why...Welcome to this quick Sunday update, everyone.
If you are reading my updates for the first time do follow me to get more complex charts in a very simplified way.
I also post altcoin setups on Spot, Margin, and Futures.
Let's get to the chart.
This is the total crypto market cap chart.
It's very important to follow this chart in order to understand the overall trend of the crypto market.
W have seen almost third consecutive bullish candle for BTC in weekly.
IMHO BTC needs some pullback including many other altcoins too.
I've said this before
No one got rekt by taking profits.
Although there's a chance that BTC could hit the 48k straight that won't be sustained for long.
In this chart, the mcap is hitting the most important resistance level.
If this resistance is broken and we get a daily close above the 1.84 trillion resistance (the red zone) It's highly likely we will hit the 48k -49k level on or before 15th Aug 2021 in BTC. The whole market will pump together.
The support remains from 1.53 to 1.67 trillion.
What's your thought on this?
Do hit the like button if you like this Analysis and share your views in the comment section.
It takes a lot of time and attention to create this educational content for you all to understand the market and take your trades wisely with the right information! Hit that follow button if you haven't yet.
Thank you
#PEACE
