Total Marketcap breaking out...Welcome to this quick update, everyone.
If you are reading my updates for the first time do follow me to get more complex charts in a very simplified way.
I also post altcoin setups on Spot, Margin, and Futures.
Let's get to the chart.
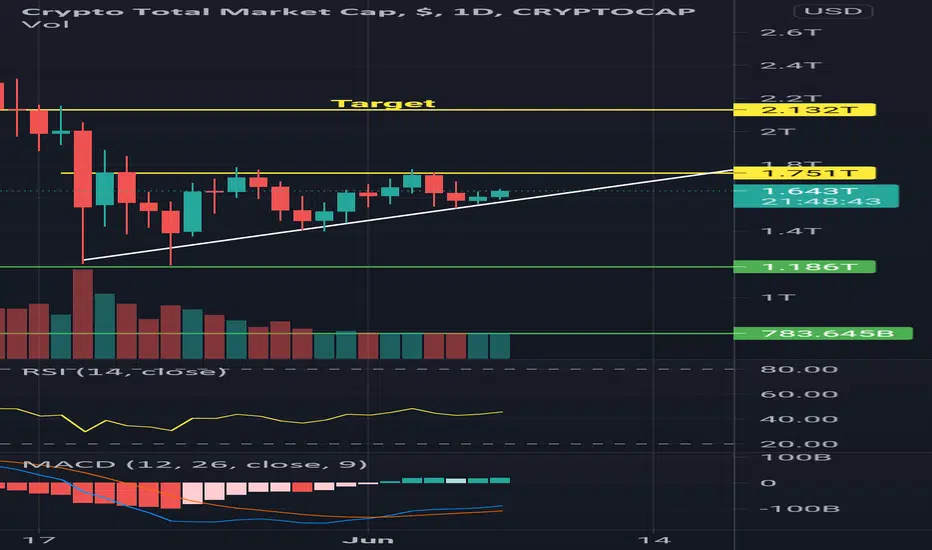
The total market cap chart looks really bullish here after breaking the $1.4 Trillion resistance level.
By the end of this week if the Total market cap closes above $1.68 trillion it's highly likely we will see a rally towards $1.77 to $1.8 trillion which will eventually push the whole crypto market. Both Altcoins and Bitcoin will pump together.
This is a very important chart that only a few people who always want to stay ahead use.
The structure exactly looks like BTC at 36k level.
INVALIDATION: Weekly close below $1.41 trillion.
What's your thought on this?
Do hit the like button if you like this update and share your views in the comment section.
Thank you
#PEACE
Totalcryptomarket

TOTAL2 RepeatAltcoin market cap similarities obvious
Critical point approaching
will it turn out as last time? (2)

TOTAL Where we are at in the bullrunSimilar pullbacks in red
Green line is the major trendline that is holding
We are currently moving through a big fib area, which I do not think is an appropriate Top

Commence Phase 2 - TOTALAn idea for the TOTAL market cap
Phase 2 is a more aggressive bullish stage in comparison to what we have recently seen
Similar structures in green
Points of confluence in red

#ALTCOINs in Danger? Welcome to this quick update.
In my last update, I said if ALT Mcap CLOSES BELOW 738 Billion altcoins will be bearish AND YET WE SAW dump in ALTCOINS but it didn't follow how I expected.
Just shifting a few trendlines and I got the chart above.
Looks like it's still under the channel and a bounce is likely from here.
It will take some time with sideways action or even little pullbacks during the weekend.
Close below this channel could create a panic in the altcoin market with blood everywhere.
Let's hope we see a bounce from here.
Let me know your thoughts on this.
Thanks for reading, Do hit the like button if you like it and share your views in the comment section.
Thank you
Stay safe
#PEACE

See you after Labor Day - $TOTALa very very boring summer for crypto has been obvious for the last several weeks as we have stayed in this range. Volatility continues to decline and make lower lows for BVOL24. This makes me think we continue in this very boring range until at least after labor day, if not even later. Time to spend time on yourself and those you love this summer and ignore the charts. Unless you are trading something that is trending like the SP500. I expect a very volatile fall season into winter and there is a lot of capital sitting on the sides ready to play the crypto market.
For my spot long term holdings I continue to dollar cost average into the market at the range lows.
There are so many doom and gloom posts and moon boy posts as well we need another 45-90 days to flush them out in the chop of this range.
If this range breaks down my next target would be the $1.1T level where I would continue to DCA spot buys.
I believe we are in the adoption phase of crypto currencies and it is very relevant to have spot allocation for my own portfolio holdings. I believe the next 5-10 years will see exponential growth and I see buying the lows as value buys.
This is for educational purposes and none of this should be taken as financial advice.

TOTAL2 The PullbackThe pullback exhibited within the bull run comparing to points in the previous bull run


#ALTCOIN SEASON only if it happens!!!Welcome to this quick update, everyone.
I got many requests for analyzing the Altcoin Marketcap
BTC has been acting strangely these days and I am more of a TA guy rather than the fundamentals.
TBH Fundamentals play a very major role in Crypto.
But charts always give us a hint ahead of the news, doesn't matter Bearish or Bullish .
Let's get straight to the chart:-
The TOTAL2 represents the Total Altcoin market cap.
According to this chart, the Alt mcap must rally towards $800 billion in the next few weeks keeping in mind the $733 Billion mark holds.
Currently, we are at an important level of support.
Observe the channel support as well as the Yellow trendline.
Trying to breakout positively. Breakout and a bullish retest confirm the uptrend in altcoins which will eventually give us a green altcoin week.
What's your thought on this?
Do you think Alts will rally?
Share your views if you have any in the comment section and do not forget to hit the like button if you like my updates.
Thank you
#PEACE

Hodling my Bullish stance - MCAPOn the daily for TOTAL2 we can see a falling wedge forming and nearly complete, after bouncing off the 200MA
While the MACD is showing signs of a double bottom also
On a larger perspective (right) I have plotted the curves that are relevant to the market and two points that are very comparable
We are experiencing a pullback within a bull market
Hodl

OTHERS MCAP, Emphasis on June 2022Many of my charts are suggesting a June 2022 end to the bull market
Similar price points can be seen at .618 and 1.618
The curved pattern is pretty cool to observe, I wonder if it will continue further upwards
We are currently in the green circle, a pullback after a bull run, preparing us for the bigger second phase bull run, which is plotted after the green circle
This chart above also suggest June 2022

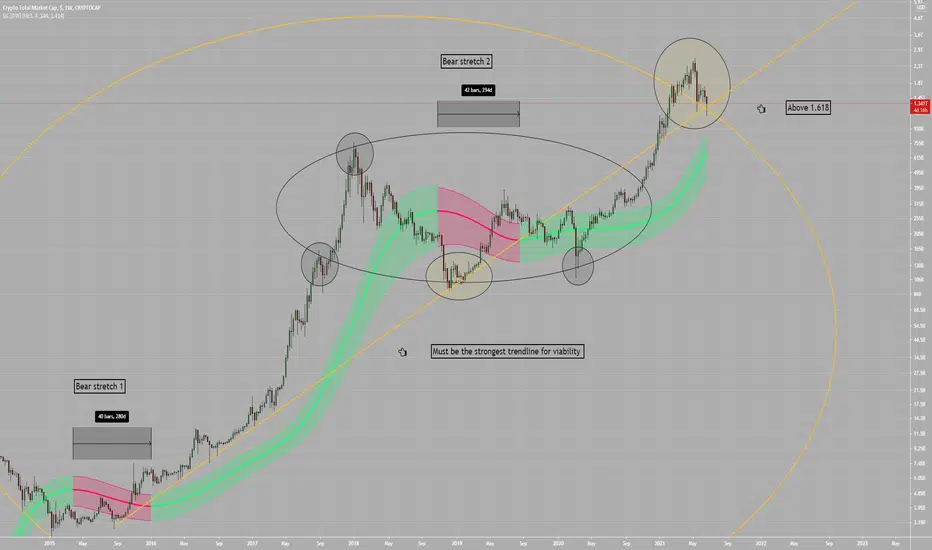
Mess with the Bull.. you know the restThe TOTAL crypto market cap is consolidating above the 1.618 Fibonacci level, assuming the trendline i have drawn is the strongest possible. This is a dip, and should be treated like one, calmly and bought up ASAP.
You can also see on the Gaussian Channel indicator the bear market stretches were similar in time sense both being around ~280 days.
We have a lot more coming, believe.

Bullish Signal for Total CryptoTotal Crypto in Heavy Line Support that means Best Long Signal Appear ....

Altcoin MarketCap is Supported TOTAL2Hoping for a power move through 0.5 (green channel) as not much resistance has formed there in the previous bull run
this isn't over..
The bear market retracement shows that price is currently support at the 1.272 level
Bulls have lead, it is nicely disguised however


TOTAL MARKET CAP - Head and Shoulders Head and shoulders Bottom
Overall performance rank (1 is best): 13 out of 39
Break even failure rate: 11%
Average rise: 45%
Throwback rate: 65%
Percentage meeting price target: 71%
The above numbers are based on 3,197 perfect trades.

Total Crypto Market CapSuch a beautiful channel, look how price reacts off the median in the past. I think we're in Wave 5 now headed for ATH's in the fall. I would probably get ready to take big profits in the fall as price hits the top of the channel. Wave 4 didn't go below wave 1 and we're currently at the Golden Fib Retracement from the Wave 2 low, #chartporn

total crypto marketnew scalp view, the moment we see a buy formation which is not sure to form this month, we talking about july-august probably, we predict another sell to 1.3 trillion total cap or below

TOTAL2 Retest, Likely Further Collapse - PitchforkTOTAL2 Has seen some great growth
there is more to come for the bulls but we are now jus taking a breather and gearing up
at the 0.5 line is a strong and likely point of support for this price action
Being tested as resistance three times, to be tested as a support? It will likely reject upwards and continue with the bull run.

TOTAL2 Food for the Bulls - Dip being boughtThis is a great pullback to catch if you are looking to buy in to one of your favourite altcoins
All of them (basically) on sale!
I have been patiently adding myself
There has already been one bullish rejection along 2618 I expect another to follow, allowing the market to continue pushing new highs

Total Market Cap - A 2017 Fractal TheoryWill we see a 10x rally in the Total Crypto market to $14T in 16 weeks all all time lows in Bitcoin dominance of sub-20%?. Or will BTC hold its own against upstart alt-coins and keep the target for the total market cap to a more realistic $6.5T?
In this study I have pointed to the correspondences with September 11, 2017 to the present and suggested that like the Crypto market of September 11, 2017, there could be only 16 weeks to reach an all time high. In which case, will it replay the rally between September 11 and December 31, 2017,to see a 3.236x projection of the current correction to realise a $14T in total market cap?
The next, lower target would be $6.5T although this doesn't have any correspondence to the 2017 fractal.
The implications for the price of Bitcoin need to be considered with respect to the potential for it to fall significantly against the larger number of mature, alternative projects that are now in existence.
What do you think? 10x or 4x ... that is the question?
