TOTAL2 is About to Explode!The crypto market is abuzz with a significant phenomenon - the shrinking of the total market capitalization, excluding Bitcoin (BTC). Contrary to what one might expect, this contraction often precedes a major pump in the world of cryptocurrencies, signifying the potential for exciting price movements. 🌌💥
Unpacking the Market Cap Contraction
Market cap contraction is a fascinating occurrence, one that hints at the complex dynamics of the cryptocurrency market. When we talk about the total market capitalization excluding Bitcoin, we're essentially looking at the collective value of all cryptocurrencies other than the big BTC.
The Compression Effect: A Precursor to a Pump
Why does contraction matter? It's because, in crypto, this phenomenon frequently acts as a precursor to a "pump," a substantial increase in prices. When the total market capitalization of altcoins starts to shrink within a defined range, it often indicates that the market is preparing for a major move.
Anticipating the Upward Surge
For crypto traders and enthusiasts, keeping an eye on this contraction is vital. It suggests that exciting price surges could be on the horizon for the world of altcoins. Such periods of compression often lead to increased trading activity, resulting in significant price movements.
Trading Strategy: Positioning for the Pump
As this exciting market cap contraction unfolds, cryptocurrency traders should consider crafting trading strategies to harness the potential pump. The market dynamics may offer numerous opportunities to capitalize on these upcoming price surges.
Conclusion: Crypto's Dynamic Landscape
Understanding the nuances of the crypto market is crucial, and the market cap contraction phenomenon is one of its fascinating aspects. As we navigate this period of compression, let's remain vigilant, prepared, and ready to embrace the opportunities that a potential pump can bring.
🚀 Crypto Insights | 💡 Trading Strategies | 💰 Market Analysis
❗See related ideas below❗
Share your thoughts and insights 💚🌐💚
Totalcryptomarket

#TOTALmarketcap incl. #btc and #eth @ resistanceHere' s the chart of ALL #cryptomarketcap #TOTAL1 . As you see #index is now at the historical vertical resistance. This is the 3rd testing of this resistance.
- Clear declination will result heavy bloodbath on #altcoins.
+ Clear breaking out with weekly closings will result a new bull era.
NOT FINANCIAL ADVICE.

The Path of HOLDERS" 🌟🚀Hello, fellow crypto enthusiasts! I'm CryptoMojo, the name you can trust when it comes to trading views. As the captain of one of the most vibrant and rapidly growing crypto communities, I invite you to join me for the latest updates and expert long and short calls across a wide range of exchanges. I've got your trading needs covered with setups for the short-, mid-, and long-term. Let's dive into the charts together!
I've dedicated my time and effort to crafting this chart, but remember, what you see here is crypto insight, not financial advice. 🚀💰 #CryptoMojo #CryptoTrading
HODLers, Prepare to Conquer! 🌟
While the Bitcoin rollercoaster may seem to have reached its lowest point, the thrilling journey through the crypto wilderness is far from over. Right now, we're venturing deep into the captivating Accumulation phase, a realm that demands not only Patience but also Courage as our guiding stars. 🌲💫
Now, let's turn our attention to the tantalizing world of #Altcoins, where on the majestic canvas of higher timeframe charts, they're poised for nothing short of a spectacular breakthrough. As we gaze ahead into Q4, all signs point to a bullish adventure for these altcoin gems. 🚀📈
In this bustling and often clamorous crypto realm, here's your compass: Accumulate your treasures with the shrewdness of a seasoned collector and hold them with the unyielding resolve of a true champion. Tune out the distractions, and cling unswervingly to your long-term vision. 🚀💎
In the grand tapestry of the crypto cosmos, rest assured, your steadfast Patience will soon be showered with the rewards you've envisioned. Keep the faith, for the best is yet to come!" 🌌💰 #CryptoHODL #LongTermGains
This chart is likely to help you make better trade decisions if it does consider upvoting it.
I would also love to know your charts and views in the comment section.
Thank you

Crypto long cycle indicatorI cannot take credit for this. I believe I saw this basic layout posted on Twitter by Will Clemente some time ago. I just re-created it myself so I could have the ability to watch in real time the larger crypto market cycles with this indicator.
It is the market cap of stable coins USDC and USDT added together in parentheses (USDC+USDT) divided by total crypto market cap on trading view. It ends up looking like (USDC+USDT)/TOTAL as the ticker.
You then use the logarithmic scale and draw parallel lines to hit the approximate market tops and bottoms.
Well, with today's pump to above FWB:31K for BTC, it appears we're just about hitting the bottom line that indicates we're near a market top again for the crypto space for now.
We're in that weird, in-between halvings timeframe, post the year-long market sell-off. I had been making the comparison to 2019's market for some time, and we just may well have seen the top of the crypto space for the year, or are very near to seeing it. I expect a slow grind down from here to the end of the year, it might start to try to rally again just before the halving, it tried to in 2020, but then the whole COVID situation caused a flash crash across all assets. If we don't have a similar catastrophe pre-halving, maybe the rally momentum early next year after a slow grind down for the remainder of this year simply follows through. Then we get the real mania bull cycle ala 2020-2021 all over again for 2024-2025.
That's at least how I see this playing out. If you were smart enough to buy Bitcoin during the December lows, I'd start thinking about taking profits here and wait for it to find another decent supported low late this year/early next year if we are indeed sort-of repeating what happened in 2019.

Double Trouble Ahead with Head and Shoulder PatternsThe crypto market is revealing a worrisome development - not one, but two head and shoulder patterns. The larger pattern has already experienced a breakdown, which paints a bleak picture for the crypto landscape.
This double whammy of patterns hints at a very bearish outlook for the crypto market. Stay cautious and keep a close watch on market developments.

Crypto Alert: Head and Shoulder Pattern Signals 25-30% DropWatch out for a possible 25-30% dip in the crypto market . Experts are pointing to a head and shoulder pattern, often a sign of upcoming drops. This lines up with the BTC target predicted yesterday, raising worries among traders and investors. Stay tuned as the market's next moves unfold.

TOTAL2 - Retesting this Horizontal SupportTitle really says it all, simple support that is trying to be held.
TOTAL2 has been sitting around 500 - 550B for awhile now which is a bullish sign. Patience pays.
This is the 4Hr chart used to get a closer look at this support level.

Crypto Growth: Inverse Head and Shoulders PatternsBullish Signals for BTC and ETH: Inverse Head and Shoulders Patterns Emerge with Promising Targets"
Bitcoin (BTC) is showing positive signs today, as an inverse head and shoulders pattern emerges. The successful rebound from the 29,500 USD resistance level indicates a robust pattern in full swing, with a technical target set at approximately 30,630 USD.
Excitingly, Ethereum (ETH) is also revealing a similar pattern on its chart, suggesting a potential boost for ETH in the short term. This bullish setup indicates favorable price movements for both BTC and ETH, presenting enticing opportunities for traders and investors. The target for the inverse head and shoulders pattern in ETH is expected to be around the 1954 mark.
Moreover, the total crypto market cap is also exhibiting a similar setup and appears to be heading towards 1.2 trillion USD. The overall market sentiment remains optimistic, adding to the excitement and potential for further gains.

TOTAL (Cryptocurrencies Total Market Capitalization) Analysis Fundamental Analysis:
The TOTAL or Crypto Total Market Cap is an integrated Complete Cryptocurrencies Market capitalization of all the Crypto coins and tokens and it is demonstrated against USD to show the total market capitalization of the entire crypto environment and it can be used for many speculation and hedging purposes in finance and other related sectors.
it can simply interpreted as how much of fiat currencies has been spent or converted to the Crypto assets or how much is the total value of the entire crypto environment is worth presently in Dollars.
by looking at this index and comparing it with the entire worlds market capitalizations we can understand how much more fiat currencies are there in the world to gets converted to the Crypto or the other way of looking at it is how much more time it takes to Concore the fiat world by crypto and decentralized open markets.
TOTAL Chart includes all the Coins and Tokens i.e BTC,ETH...
Technical Analysis:
we can see that, the chart is currently at the Reaccumulation zone of Fibonacci Golden zone and it has formed Bullish Divergence with MACD Lines and Histogram, which is the sign of Bearish or Retracement wave end and Trend Change to the Next Bullish Cycle and start of the next Impulsive wave.
we have specified the Fibonacci retracement levels which can be used as the significant Pivot Points and Support areas where it can be the best Price or undervalued price to Purchase and Invest on.
there total of 3 Targets defined by Fibonacci Projection of the initial impulsive wave followed by its retracement after the Top Distribution.
the 3 Target gets confirmed as the price triggers the 2 TP followed by some retracement and price correction.

Crypt Total Market Cap, Uptrend?This chart shows the total Crypto Market Cap, includes every coin on the market.
The Fib levels are drawn from the Covid Crash to the ultimate November Top. Upon the bearmarket retrace we bounced of teh 0.786 support zone to reach current resistance at 0.618.
There is a clear uptrend forming, now this is nothing to trade with imo, just important to note that this might be an area of support.
BTC is strong and we can clearly see that when comparing to the "Total Crypto Market Cap excluding BTC and ETH"
If there is more downside here i expect BTC Dominance to hit those 52%-55% levels
and ETH dominance to hit 22%-25%
while the Altcoin market will suffer greatly...
I still like the odds and will be swapping some ETH into altcoins once all the economical announcements are made this week and the data is clear.
Will also keep ammo for lower levels.
One thing to keep in mind, its all about perspective, just imagine seeing these levels during the bullmarket. These are the "Ah man i wish i bought then" levels

Total 2 - Altcoins minus BTC TOTAL 2 - Crypto Market Cap minus BTC
Three confirmations for bull status
1. Above 100 week SMA (No where close)
2. Complete 149 weeks in Pennant (Dec 2023)
3. Break above Point of Control (POC)
The 2018 - 2020 fractal is overlaid for perspective only
The Point of Control (POC) is the price level at which the greatest number of contracts have been traded within a volume profile (THICK RED LINE).
This line naturally coincides with resistance overhead.
Its important to recognize that the chart is just a perspective that aims at helping with timing an entry with a good potential outcome. With three indicators backing your trade you would have a better probability outcome. So we wait for the three confirmations to occur. Could you be accumulating sure.... but why would you when we are under the 100 week SMA appear to have more time to burn before a Bitcoin cycle really kicks off never mind the altcoins. Its important to recognize also that this chart includes ETH and ETH has been performing exceptionally well this cycle. I will be completing another chart excluding eth in coming days.
I hope this chart helps you time your trade and your positing into altcoins, when the time is right, when we have confirmations and the wind at our back.
PUKA

The REAL Crypto HALVINGWe are going to have a few weeks of down only and there is nothing you can do about it.
Half of the crypto marketcap is going to vanish in a quick tempo before things start looking bullish.
Buckle up!

TOTAL MARKET CAP ANALYSIS!!Hello dear traders, we here new so we ask you to support our ideas with your LIKE and COMMENT, also be free to ask any question in the comments, and we will try to answer all, thank you, guys.
TOTAL MARKET CAP ANALYSIS UPDATE:-The total market cap is moving in a long symmetrical triangle. Currently, it has bounced off its trendline support. The RSI is in the oversold region and is showing a bullish divergence.
A bounce off the trendline support and a solid breakout of the descending trendline will confirm a strong upward move. In case of a sustained breakdown of the ascending trendline, the market is expected to decline.
The MACD crossover is showing a contraction phase. A solid breakout of the symmetrical triangle will confirm the extension movement in the market.
The total market cap is above the ascending trendline support and trading inside the Ichimoku cloud. Volume is very low and the price is in the contraction phase.
Hit the like button if you like it and share your charts in the comments section.
Thank you

TOTAL2 Move up within ChannelBars pattern placed shows a bull move up channel towards the top
I do expect a little dip first but then the bulls to return
current update thoughts on the market cap chart

TOTAL CRYPTOCAP 35% LongFrom previous low 1,1 T i am expectiong 45% UP
The lowest target is bottom of yellow box, highest target is top of yellow box
Stop is a white line

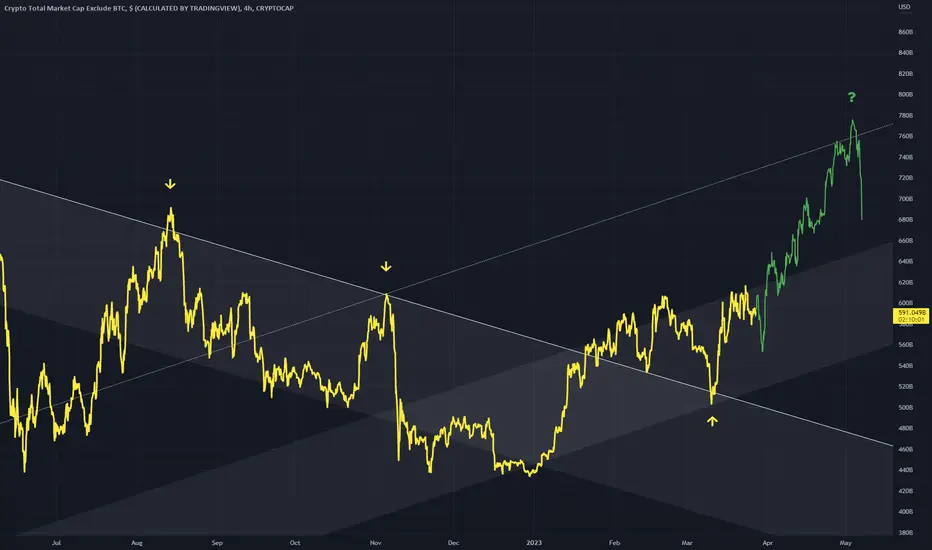
TOTAL2 Different Top Scenarios The recent bull market pushed price into a higher high scenario.
This shows that there is still movement upwards left in the pump.
While the 2017 one shows a lower high, a normal double top, leading to a strong bear market.
Perhaps the bear market we are seeing now will be shorter due to this factor.

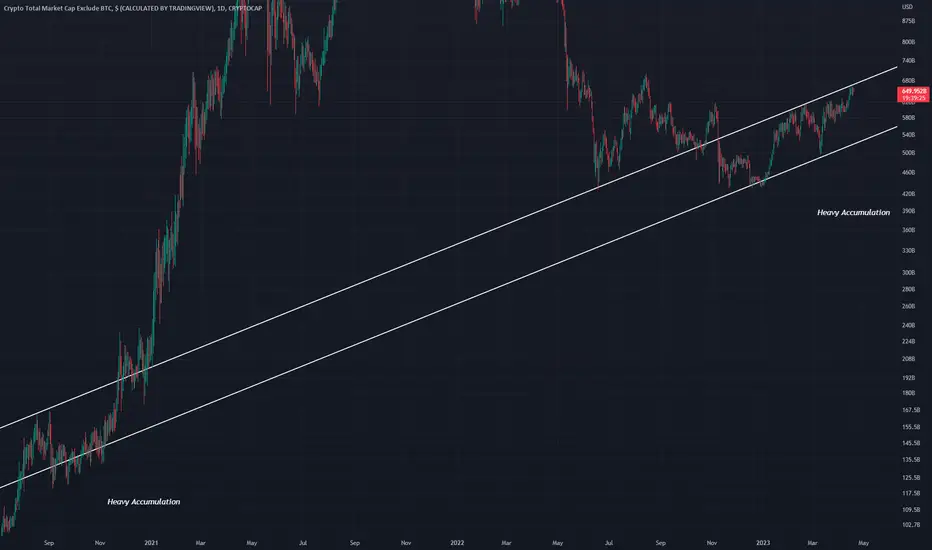
TOTAL2 Similar Price EventsHeavy accumulation is evident in these areas
A roll over top followed by strong movement is characteristic of the two
Right now the second one is just breaking out, as did the first in spectacular fashion
Bullish
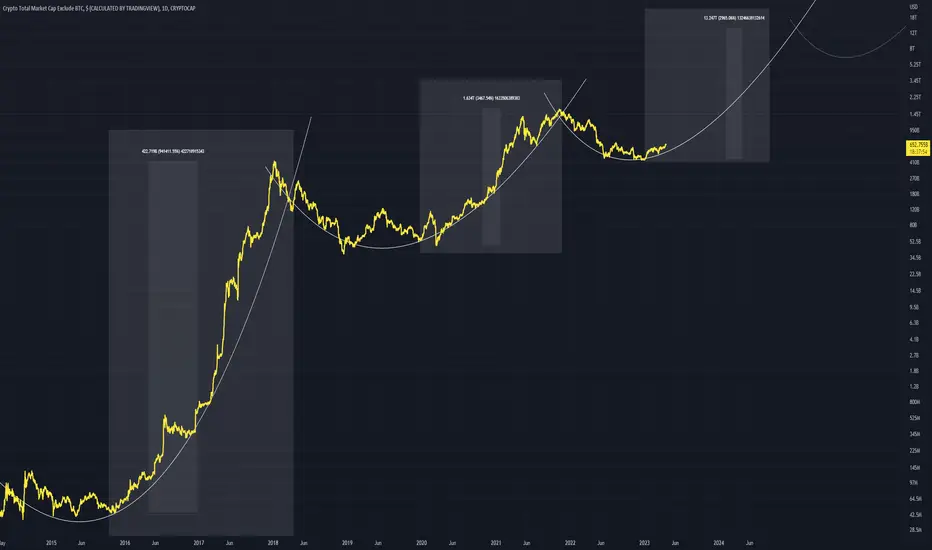
TOTAL2 Curved Trend The trend that will take us in to the next bull run
This curve is evident since the start of price formation. I have put an extra dotted line to show what it would look like if the curved trend repeated again.
There is a massive difference however in % between the first being (941411%) and the second only being (3500%)
Bullish heading into the third curve up
📈TOTAL3 is ready to rise above dynamic resistance📉CRYPTOCAP:TOTAL3
Hey everyone, first take a look at my previous analysis and positions.
As previously analyzed, alt-season is coming.
Don't forget to risk-free your position.
Please share ideas and leave a comment,
let me know what's your idea.
CrazyS✌

CryptoWorld- Quick Update as the trend is forming.
- We are still in accumulation phase.
- Boring mode will persist in 2023 to wash out tourists.
- Follow the past to know the future.
- Patience will reward.
Happy Tr4Ding!

TOTAL2 - Bull Continuation4Hr chart for the altcoin MarketCap (TOTAL2)
Some important channels to be considered, and a potential rise to the diagonal dotted line
This will be the smaller rally before larger one building
TOTAL Crypto Market CapAs with many other Markets, Crypto took a Dive as fears about SVB came tot he surface but as soon as ideas of safty came out, Look how it recovered. This is one of the MAJOR advatages of Crypto, it really is 24/7, trading any day and at any time. Some people Still cannot get their heads around that.
Anyway, Look at the Volume that came in. thats shows Huge amounts of support
But for now, the Rise in PA may need to take a breather as getting overbought on lower timeframes, and yet, given how the markets are, it would not surprise me if PA jumped once more at some point - it really is a matter of Watch what happens and react accordingly.
Fundimentals may emerge that could knock Crypto market heavily, for instance, the Universal Commercial Code (UCC) guidelines update, - that is actually a new law that bans crypto as a "Currency" but paves the way for CBDC's. Be VERY careful about this.

Uptrend in the crypto market. Or at least showing beautiful signTotal crypto market by the end of 2025 will have +10 T
