TOTAL MARKET CAP 12Hr UPDATE BY CRYPTOSANDERS
Hello dear traders, we here new so we ask you to support our ideas with your LIKE and COMMENT, also be free to ask any question in the comments, and we will try to answer all, thank you, guys.
TOTAL MARKET CAP ANALYSIS UPDATE:-After getting rejected from the strong supply zone, it is now bouncing off the ascending trendline support, where the Ichimoku cloud is also acting as a support.
The MACD crossover is losing bearish momentum, and as long as it holds above the Ichimoku cloud, we can expect a continuation of the bullish trend. While a solid break of the Ichimoku cloud will signal further correction in the Alts.
Sorry for my English it is not my native language.
Hit the like button if you like it and share your charts in the comments section.
Thank you
Totalcryptomarket

Bullish signs for TOTAL Crypto Market CapA nice simple clean chart showing how the MA's are all beginning to cross Bullish again and the Real Big one we all waiting for is the 50 ( Red) to cross back above the 200 ( Yellow), which, if current paths remain valid, will happen on Thursday 23rd Feb
Also note how PA is now back above the Neckline of the FTX Crash, so recovery is complete.
It has taken a Huge amount of money and weeks of time to get here so expect the chance of a break in events while things cook off for while.
Also bear in mnd, that due to the Bearish words from the FED, the Market may try and push higher before they raise rates but this could lead to a big pull back at a later date, which would not be good
Crypto is at a critcal point again. Watch close and be ready to react, it is open all day, everyday - things can happen anytime


Crypto Total 48k FractalWe have taken liquidity from the last supply area (yellow line) at the top BEFORE the FTX pump
This means all Shorts that have tight stop losses BEFORE FTX DUMP are now taken out.
TOTAL is painting a fractal similar to how it did at 48k
This is concerning, and Long should be very careful here

Crypto total market cap 45 % drop soon. Be ready!Total crypto market cap broke bearishly as Bitcoin did.
We expect a short term bounce and getting rejected at the strong resistance.
Final target for bears: 585 - 600 B
After that we expect the real accumulation face and the new bull market to start.
P.S Don´t get overexcited with a short-term bounce

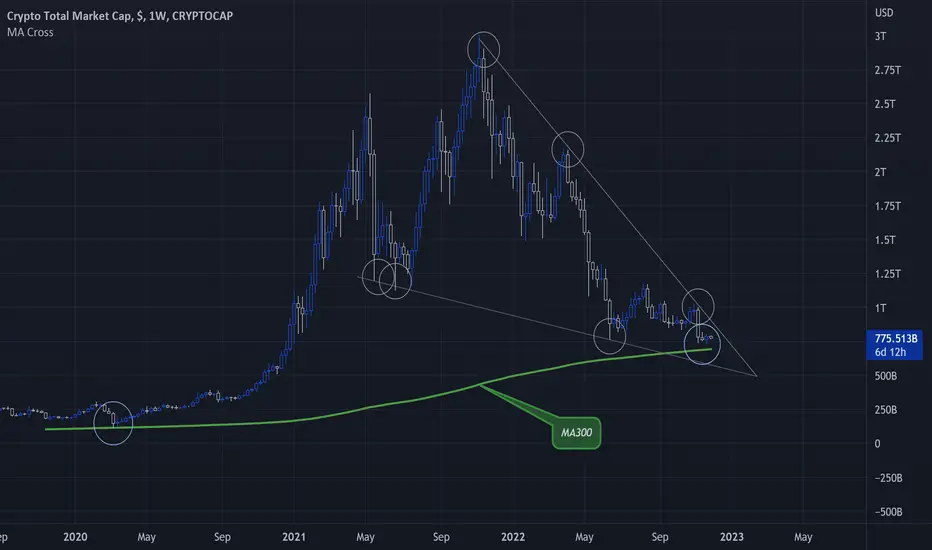
Total Market View- Yes. BTC fell under 300MA for the first time in 2022.
- No. Total Market Didn't Fall under 300MA in 2022.
- BTC Dominance was 100% in 2013-2017.
- BTC Dominance Top was 70% in 2017-2020.
- BTC Dominance Top was 50% in 2020-2022.
- Crypto industry is growing very fast.
- TheKing will lead the way but, he's not alone anymore.
Happy Tr4Ding!
#ALTCOIN MARKETCAP is Flashing Important Signal.Have a blessed Sunday to you all.
ALTMACP broke to the upside.
I am just skeptical about it for one reason, the confirmation candle closed in the red.
Unless we get a candle closing in green above the same, expect manipulation.
Be careful about holding the maximum portion of your portfolio in ALts.
Alt/BTC pairs will bleed.
I prefer holding BTC and a few alts with fundamental advantages like VRA is 230% already, HFT has started its run( Chart coming soon), and many other Gems APT did 4x.
So follow me if you want to know the next potential 50x coins!
DYOR, This is not financial advice.
Do show your support if you like my work.
Thank you
#PEACE

We Have SHIFTED to BULL TerritoryYesterday it looked like we wouldn't go through resistance but we did so now I'm a bull. Go with the flow be like water and win.

USA $31.4T Debt: How will this affect BTC and Stocks?❗ WARNING ❗ You're about to read an unpopular opinion...
Over the past few days, we've seen bullish price action across nearly all markets. Infact, this is the first time since 2013 that Bitcoin has closed so many green dailies consecutively. This entire market reversal seemed a bit sudden, and many claimed "bull trap". (I'm a believer in the Macro, so when it comes to pure charting without fundamentals, longing was the way to go over the past few days, no argument on this).
However, another interesting this happened today - the U.S. government hit its $31.4 trillion borrowing limit TODAY, amid a standoff between the Republican-controlled House of Representatives and President Joe Biden's Democrats on lifting the ceiling (which could lead to a major economic crisis in a few months). Suddenly, I thought to myself, the entire reversal seems even more suspicious. Now here's my unpopular opinion : What if this is part of an elaborate plan to eliminate some of the debt? The world is dependent on the dollar, if the US financial system is in trouble, so is most of the world. Everything is just too interconnected at this point. Across the giants of investment world, there are rising concerns about unsettling markets and risking a recession. Senate Republican leader Mitch McConnell predicted that the debt ceiling would be lifted sometime in the first half of 2023 under conditions negotiated by Congress and the White House.
According to Reuters, the White House is refusing to negotiate with Republicans on raising the debt ceiling because it believes that the majority of them will eventually back off their demands, as a growing group of investors, business groups and moderate conservatives warn of the dangers of edging towards a default. The high-stakes deadlock is widely expected to last for months, and could come down to the last minute as each side tests the other ahead of June when the U.S. government might be forced to default on paying its debt. A default means being unable to pay. Because U.S. debt is considered the bedrock of the global financial system, due in part to its stability, a default could shake economies across the world. Americans could also face a recession, including higher unemployment, and the stock and bond markets would likely plunge. Today, a government that defaults may be widely excluded from further credit; some of its overseas assets may be seized; and it may face political pressure from its own domestic bondholders to pay back its debt.
Today on Twitter, Elon Musk said openly that even if the government taxes every billionaire by 100%, it wouldn't even make a notable dent. According to him, the only way to make a notable dent in this debt is to tax the citizens even more. But what about the markets, the whales, the insider trading between banks, governments and large corporations ?? Trading markets is a multi trillion dollar industry. To make it more practical, the total value of global equity trading alone was 41.8 trillion U.S. dollars in the third quarter of 2021. We know that the Total cryptocurrency market is currently standing just under 1T. I'm unable to find data on the total worldwide value of the commodity market, if you do please comment below with your source. It is estimated that the total amount of money in the world is a couple of quadrillion. Whatever that means. Suddenly, 30 Trillion seems pale in comparison.
Furthermore, investment options go far beyond just stocks, cryptocurrency and commodities. Some of the other less frequently discussed options include:
1. High-yield savings accounts
2. Certificates of deposit (CDs)
3. Money market funds
4. Government bonds
5. Corporate bonds
6. Mutual funds
7. Index funds
8. Exchange-traded funds (ETFs)
9. Dividend stocks
10. Real estate
Now imagine, scooping off a bit of cream from the top?? You wouldn't need to necessarily wipe out an entire market, but a good 20% to 30% drop across markets and Bob's your uncle ! The money machine carries on until next time it's overspent. Hike interest rates. Increases taxes. Inflation. Liquidate markets. Repeat cycle.
So the point that I'm trying to get at is this - remember tot take profits. Nothing wrong with taking a hedge to manage your risk during these uncertain economic times. I personally won't be surprised if there's some major "news event" that sends the markets into a overnight flashcrash soon. I could be totally wrong, in fact I would prefer to be wrong in this case.
What are your thoughts on this?
_______________________
📢Follow us here on TradingView for daily updates and trade ideas on crypto , stocks and commodities 💎Hit like & Follow 👍
We thank you for your support !
CryptoCheck

What's up about crypto market cap💰. TOTAL CRYPROCAP 📈📉Hello guys. This is an update of previous analysis (blow link), The chart is very similar to Bitcoin now. After breakout the trend line, I expect some correction as a pullback and complete the pattern then continuation of upward ,Consider it and monitor the price's action in the circles.
Good luck.
If you like the idea, do not forget to support with a like and follow me for next analysis :)
Write your comment and opinion here to me

Total Crypto MC Could reject here...Just saw this and it didn't make me happy.
We could nuke hard here unfortunately.

CRYPTO TOTAL MC TARGETS!- As we can see every time there has been a BITCOIN HALVING event it has triggered a BULLRUN!
- The peak of the next bullrun will be around 12-18 months after the BTC HALVING EVENT!
- The time to buy is NOW!
- SMART MONEY (big banks, institutions and wall street traders) They are currently buying right now!
- COMMON SENSE buy low sell high!
- Where are DUMB MONEY (90% of the public / retail investors) they will not buy now, they will buy at the TOP of the cycle!
- WHY? simply because they do not understand how this market works, humans are very emotional, if we eat our favourite food we feel happy, excited and are satisfied if we get a parking ticket we become sad, angry or upset!
- This is the same shit that happens in these markets, another point to make is 90% of the public are BRAINWASHED, they simply follow the heard like sheep, they listen to the media not knowing that the TV was designed to: TELL A VISION, the media manipulates the average investor to believe that buying crypto now is risky, but when the markets peak, they start to throw positive news on the markets which excites new investors and they buy the top of the market without doing any research or understanding how the market works!
- Then when they lose money they always call CRYPTO A SCAM LOL its comical!
- NOT FINANCIAL ADVICE, PLEASE DO YOUR OWN RESEARCH, ONLY INVEST WHAT YOU ARE WILLING TO LOSE!

TOTAL Crypto Market Cap nearing bottomThe long-term sharply declining trendline has been broken a few weeks ago. Now we are forming a descending wedge on the weekly chart which has an 80% chance of reversing a trend. A confident upward channel is nearing the upper trendline of the wedge. It may find resistance there and turn back to lower levels. However if it breaks, we have a good chance of reaching the 1.1 - 1.2 Trillion Dollar crypto market cap.
The recent CPI data is making people happy but we need to see more positive fundamental data. Unemployment is still very low, spending is still ongoing at large. A real interest rate-pivot by the FED could mean a sharp return of inflation.
An alternating total value between 750B and 1.2Tr USD could be a realistic screenplay in the coming months. A trader's paradise. :-)
As for HODL strategies, I would still consider this a good level for some DCA. Historically extreme low convergences on the RSI and Stochastic RSI have proven to be good levels to accumulate crypto - BTC mostly as altcoins tend to bleed for a while even after BTC bottoms...
I still believe that visiting the 700B level is not out of the question which could result in BTC finding a new under 15k. The mpst negative possibility in my books is breaking down to a TOTAL crypto market cap of 400B which could take BTC down to somewhere between 10-12k proce range. That would be a great buying opportunity... :-)

WATCH OUT❗ BearRally Correcting Overleveraged MarketsHi Traders, Investors and Speculators of the Chart📈📉
Ev here. Been trading crypto since 2017 and later got into stocks. I have 3 board exams on financial markets and studied economics from a top tier university for a year. Daytime job - Math Teacher. 👩(will be moving to corporate some time in Jan 2023)🏫
Bearish market rallies are meant to look like bottoms - shaking many holders out of their positions. This is because Stop Hunting Algorithms flourish here, hunting out your stop losses with wicks and volatility. In this short analysis, I explore the Total Cryptocurrency Market Cap in depth, using Technical Indicators such as the Bollinger Bands, Volume and Phoenix Ascending.
A formidable resistance zone is currently at 1T for the TOTAL chart, and I would only consider a reversal if we can CLOSE a WEEKLY candle ABOVE 1.1T ⬆ In other words, remember to take profits during a time of upward price action.
IMPORTANT XRP and XLM update coming tomorrow, stay tuned and follow 👀
_______________________
📢Follow us here on TradingView for daily updates and trade ideas on crypto , stocks and commodities 💎Hit like & Follow 👍
We thank you for your support !
CryptoCheck

TOTAL2 IdeaIdea for TOTAL2 showing points in grey circles crossing the indicator leading to the indicator flipping to its bullish state
This can be observed to be currently happening on price
Will history repeat?
I suspect we will see a bit of a relief / bear market rally following all of this bloodshed

TOTAL2 Altcoins looking ready for a PARTYLooks like altcoins are going to have a party soon with green dildos. Nice.

Merry Christmas!- May the true spirit of Christmas shine in your heart and light your path.
- Stay humble stack sats and see you at 10T Cap!
Respectfully yours.

BTC + TOTAL crypto market cap breakdownHey guys, its been a while so thought id break down the charts on BTC and TOTAL + TOTAL 2 and my perspective and bias on the current price action

#TOTAL MARKET CAP 1DAY ANALYSIS BY CRYPTO SANDERSHello dear traders, we here new so we ask you to support our ideas with your LIKE and COMMENT, also be free to ask any question in the comments, and we will try to answer all, thank you, guys.
TOTAL MARKET CAP ANALYSIS UPDATE:-The Total market cap bounced with a decent volume after hunting stops below the marked previous low.
Currently, it is showing momentum, and a solid breakout above the horizontal resistance will confirm a bullish rally in it.
If it rejects from here, then further accumulation between the marked horizontal support and resistance is expected.
Sorry for my English it is not my native language.
Hit the like button if you like it and share your charts in the comments section.
Thank you

Crypto Market Cap Elliott Waves AnalysisHello friends.
Please support my work by clicking the LIKE button👍(If you liked). Also i will appreciate for ur activity. Thank you!
Everything on the chart.
My midterm expectation for #TOTAL.
at the moment, I guess that we are in the wave of (iv) in the ending diagonal(ED), after which the final decline to the same 700-750B area will follow,
I believe that there will be a bottom of this cycle in the crypto market. In any case - time will tell.
Good luck everyone!
Follow me on TRADINGView, if you don't want to miss my next analysis or signals.
It's not financial advice.
Dont Forget, always make your own research before to trade my ideas!
Open to any questions and suggestions.

#TOTAL MARKET CAP IMPORTANT UPDATE MUST READ!!Hi guys, This is CryptoMojo, One of the most active trading view authors and fastest-growing communities.
Consider following me for the latest updates and Long /Short calls on almost every exchange.
I post short mid and long-term trade setups too.
Let’s get to the chart!
I have tried my best to bring the best possible outcome to this chart, Do not consider financial advice.
TOTAL MARKET CAP UPDATE
As you can see in the chart or absorb in the chart here TOTAK MARKET CAP is making this falling wedge pattern as same it marked in 2018 and dropped 43% and invalided this pattern that was the last drop of the bull market.
Technically as we all know that this is a bullish pattern if this pattern breaks up out and test successfully then we can accept a bounce technically but if it Breaks down 700 billion support then it may drop almost 40%. Yes same as it was done in 2018.
This chart is likely to help you make better trade decisions if it does consider upvoting it.
I would also love to know your charts and views in the comment section.
Thank you

#TOTAL MARKET CAP 1DAY ANALYSIS BY CRYPTOSANDERSHello dear traders, we here new so we ask you to support our ideas with your LIKE and COMMENT, also be free to ask any question in the comments, and we will try to answer all, thank you, guys.
TOTAL MARKET CAP ANALYSIS UPDATE:-The TOTAL market cap is now back at the mid-June levels. Wait for a daily candle closing for more confirmation. A break below this level is bearish. We may see some sideways movement near the support before the next move.
Sorry for my English it is not my native language.
Hit the like button if you like it and share your charts in the comments section.
Thank you

Total MarketCap BTC ETHtotal marketcap breaks the long term bullish trend . be careful with your money
it means cryptos are exchanging to usd and other currencies. so we will see Red Markets again
