TOTALMCAP - Bear Market RallyTwo charts for the TOTALMCAP, on the left excludes BTC
The left chart shows a bottom along 3.618, this may cause a breakout that coincides with a bear market rally
The right further shows this with vertical lines representing bull market and bear market periods, we are currently at the bear market rally stage
This aligns also with the 200MA which should also hodl
Totalcryptomarket

#TOTAL MARKET CAP UPDATE Hi guys, This is CryptoMojo, One of the most active trading view authors and fastest-growing communities.
Consider following me for the latest updates and Long /Short calls on almost every exchange.
I post short mid and long-term trade setups too.
Let’s get to the chart!
I have tried my best to bring the best possible outcome to this chart, Do not consider it as financial advice.
#BTC/USDT ANALYSIS
BTC is making these two patterns in which one is bearish and one is bullish .
TOTAL MARKET CAP is forming bearish pannent in 6hr timeframe
If pannent broken downside then is ready for another 30% bearish wave.
TOTAL MARKET CPA is forming this symmetrical triangle also So let’s wait for a sustain break down or breakout will confirm the next move of the TOTAL MARKET CAP.
Let's see how the market will react in few hours.
Stay tuned
This chart is likely to help you make better trade decisions if it does consider upvoting it.
I would also love to know your charts and views in the comment section.
Thank you

TOTAL2 - Altcoin Market Bottom (200MA) TOTAL2 has endured most of its bearish activity, with price finally reaching the Weekly 200MA
This 200MA aligns perfectly with the prior 2017 bull run
An entry along this line is optimal

Total Crypto Market Cap Warning!Hello friends, today you can review the technical analysis idea on a 1W linear scale chart for the Total Crypto Market Cap.
The chart is self-explanatory. The total crypto market cap fell out of the Ascending Channel most recently formed two Bear Flags, back to back. The measured moves are shown in the chart. Though I want to be bullish on crypto, it seems there is still strong downside pressure with the measured moves still intact.
My last Total Crypto Market Cap warning:
If you enjoy my ideas, feel free to like it and drop in a comment. I love reading your comments below.
Disclosure: This is just my opinion and not any type of financial advice. I enjoy charting and discussing technical analysis. Don't trade based on my advice. Do your own research! #cryptopickk

BTCUSD Bitcoin update trendThe general trend of most cryptocurrencies is to fall, and if bitcoin does not finish its correction, we have a fal
Be sure to stick to Stop Lost and TAkE Profit. This is an idea and not a bargain offer
This is just idea, not trading advice, use at own risk.
reasons:
It is recommended to buy in this price limit
It is mandatory to pay attention to the stop loss and the target marked on the chart
Do not be greedy and adhere to the specified principles. I hope you will be profitable
Note that there is no 100% analysis and it is possible to stop flirting
This is a personal analysis and you should not enter into a transaction without review
If you know this, make a purchase
Be sure to adhere to the principles of capital management and do not invest more than 2% of your capital in each transaction.
High-risk individuals can enter a maximum of 5% of risk capital in this transaction by accepting risk-taking.
. Also, the principles of priceaction have been used.
l

TOTAL MARKET CAP long-term update:must read!! Hi guys, This is CryptoMojo, One of the most active trading view authors and fastest-growing communities.
Do consider following me for the latest updates and Long /Short calls on almost every exchange.
I post short mid and long-term trade setups too.
Let’s get to the chart!
I have tried my best to bring the best possible outcome in this chart, Do not consider it as financial advice.
TOTAL MARKET CAP
Total market cap formed this big rising wedge pattern but it is yet breakout currently is lying on the lower support of this big wedge pattern as long as the lower support, we can expect a bounce from there. RSI is in the oversold range and we have 200ma as local support.
If it breaks the lower support or 200ma support then the chart will be invalided.
If you look closely at the first cycle and compare it to subsequent cycles, you will find that the beginning of 2021 was great for TOTAL MARKET CAP because it grew by almost 500% in 2 swings.
If you look at the second cycle, the price has risen at first, but later you realize that this is a trading range. In the trading range, there is a difference between the buyer and the seller.
After the failure of the trading range, the price enters a downward trend for a while and falls about 70%. You may think that this is too much and it is no longer possible for the price to return. In fact, this is not the case. It is necessary for the price and health of the market, although this decline did not happen easily, but it can be recovered from here.
Stay tuned
This chart is likely to help you in making better trade decisions if it did consider upvoting this chart.
Would also love to know your charts and views in the comment section.
Thank you

Total Crypto Market Cap: Warning Signs!Hello friends, today you can review the technical analysis idea on a 1D linear scale chart for the Total Crypto Market Cap.
The chart is self-explanatory. The total crypto market cap fell out of the Ascending Channel and Bear Flag (exactly as predicted!). The measured moves are shown in the chart. Though I want to be bullish on crypto, it seems there is still strong downside pressure with the measured moves still intact.
If you enjoy my ideas, feel free to like it and drop in a comment. I love reading your comments below.
First warning sign - Jan 2022:
Second warning sign - May 2022:
Third warning sign - June 2022:
Disclosure: This is just my opinion and not any type of financial advice. I enjoy charting and discussing technical analysis. Don't trade based on my advice. Do your own research! #cryptopickk

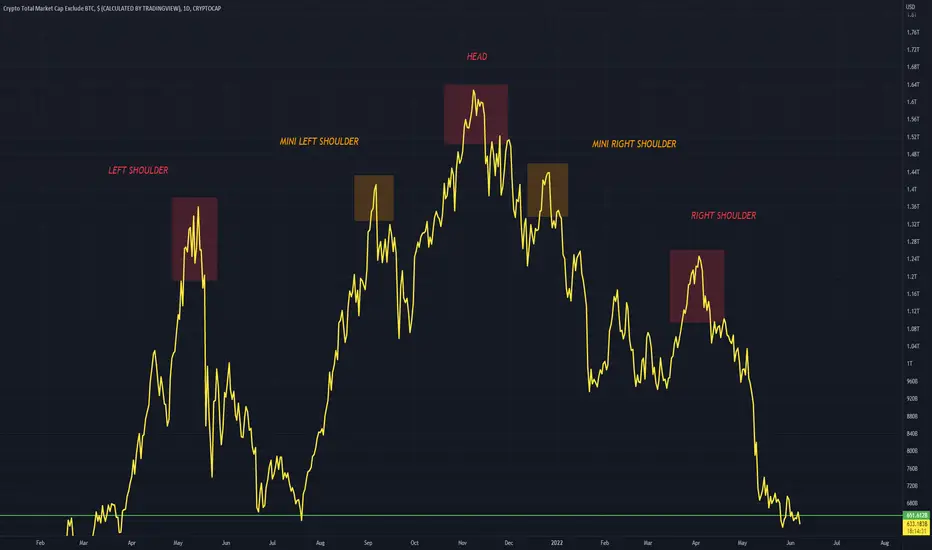
TOTAL2 Completed H&S PatternThe altcoin market (TOTAL2) has completed a H&S pattern
While also including simultaneously a mini left shoulder and a mini right shoulder
A visually appealing pattern to view
#ALTS MARKET CAP ANALYSIS!!welcome to this quick update on the TOTAL2 analysis.
I have tried my best to bring the best possible outcome in this chart.
#ALTS Market Cap Analysis
It is moving in a parallel channel in a bullish trend. It is currently trading above the trendline support. The RSI is in oversold territory. We will have to wait for a sustained breakout to confirm its next move.
Sorry for my English it is not my native language.
If you like it, hit the like button and share your charts in the comments section.
Thank you...

Market cap next move!!!!The TOTAL crypto marketcap is trading in a downtrend channel on a daily time frame. The major support is $1.00-$1.20 trillion area and this is must hold point. A break below $1 trillion is extremely bearish and we see a heavy downfall. A bounce is expected from here. A breakout of the downtrend channel will send us towards the $1.50 trillion resistance area.hit the like button to keep us motivated

#ALTS MARKET CAP ANALIYSIS !!welcome to this quick update on the TOTAL analysis.
I have tried my best to bring the best possible outcome in this chart.
It broke down descending triangle, retested successfully, and after that, we have seen a drop in it. Currently, it is holding above its horizontal support. RSI is in the oversold region. An upward movement is expected in ALTS from here while a sustained breakdown will confirm the further bearish trend in it.
Sorry for my English it is not my native language.
If you like it, hit the like button and share your charts in the comments section.
Thank you...

#ALTS MARKET CAP ANALIYSIS !!welcome to this quick update on the TOTAL analysis.
I have tried my best to bring the best possible outcome in this chart.
A very good position for ALTS!!
It broke down descending triangle, retested successfully, and after that, we have seen a drop in it. Currently, it is holding above its horizontal support. RSI is in the oversold region. An upward movement is expected in ALTS from here while a sustained breakdown will confirm the further bearish trend in it.
Sorry for my English it is not my native language.
If you like it, hit the like button and share your charts in the comments section.
Thank you...

TOTAL2 (Altcoin Market) Bearish SentimentUsing two different Fibonacci Circle plots we can see price being rejected at purple and inversely being supported as orange
Currently price is in the middle of the purple fib ring, this allows a bearish conclusion to be made
Bearish action is plotted by Bars pattern in red (just a guess of how it will undergo)
Once price reaches orange again resumption of a bull market is possible (green)
Bitcoin will recover before altcoins

Long-term analysis TOTAL2 CRYPTOCAP Altcoins - Head & ShouldersMassive head and shoulders formation on the 3W chart of TOTAL2 #CRYPTOCAP (orange line):
The candle stick chart represents the Altcoin dominance which is currently breaking through the upward-sloping trendline (red support line).
#Altcoin EXIT opportunity at pullback to the neckline (violet neckline of SHS pattern).
If the TOTAL2 CRYPTOCAP can get above the right shoulder the head and shoulders sell alert is invalidated.
But if the TOTAL2 CRYPTOCAP gets rejected at the neckline we will see a massive Altcoin crash (TOTAL2 CRYPTOCAP could shrink to 600 – 500 billion USD in this case)!
Note:
This analysis has nothing to do with Bitcoin, because the TOTAL2 CRYPTOCAP does not include the BTC market cap.
But it is recommended to exit your altcoins positions near the neckline of the head and shoulders pattern.
Disclaimer!
We (Asset-Ethology) are not a financial adviser. For educational purpose only!
You can use the information from the post to make your own trading decisions.
Trading is risky, and it is not suitable for everyone. Only you can be responsible for your trading.

TOTAL MARKET CAP 3 HOURS UPDATE Hi guys, This is CryptoMojo, One of the most active trading view authors and fastest-growing communities.
Consider following me for the latest updates and Long /Short calls on almost every exchange.
I post short mid and long-term trade setups too.
Let’s get to the chart!
I have tried my best to bring the best possible outcome to this chart, Do not consider it as FINANCIAL ADVICE.
#TOTAL ANALYSIS
It bounced from the horizontal support and currently rejecting the horizontal and trendline resistance.
MACD crossover is showing bullish momentum. We might see some sideways consolidation in the current range and a sustained breakout/breakdown will further confirm the next move of it.
This chart is likely to help you make better trade decisions if it does consider upvoting it.
I would also love to know your charts and views in the comment section.
Thank you

Fibonacci Circles Idea TOTAL2 Green and Red are sequenced events
While Aqua and Yellow are related only by the 3.618 Fibonacci Circle of both Bear and Bull Trend lines
Any further interpretation of these events is welcomed

#ALTS MARKET CAP UPDATEHi guys, This is CryptoMojo, One of the most active trading view authors and fastest-growing communities.
Consider following me for the latest updates and Long /Short calls on almost every exchange.
I post short mid and long-term trade setups too.
Let’s get to the chart!
I have tried my best to bring the best possible outcome.
TOTAL 2 UPDATES:
total 2 is making this big descending channel pattern, currently, it looks like it is going to retest the lower support.
we can bounce from the lower support of this channel so let's see how it goes.
if it breaks the lower support of this channel then the chart will be invalided
This chart is likely to help you in making better trade decisions if it did consider upvoting this chart.
I would also love to know your charts and views in the comment section.
Thank you

TOTALNot financial advice.
The essence of investing & trading is the intelligent and patient preying on the greed, fear, impatience, addiction and ignorance of the majority. It's definitionally Darwinian.

@TOTAL2 UPDATE !!Welcome to this quick update on the TOTAL2 analysis.
I have tried my best to bring the best possible outcome in this chart.
A very good position for ALTS!!
As we can see a total 2 is currently trading inside the symmetrical triangle pattern on a lower trend line support.
Here it's also evident that a total 2 whenever touches the lower trend line support it bounces well.
So here I am expecting a bounce and break to this triangle pattern which will be good for ALT coins entry.
Sorry for my English it is not my native language.
If you like it, hit the like button and share your charts in the comments section.
Thank you...

Total Crypto Market Cap 1M Chart ReviewHello friends, today you can review the technical analysis idea on a 1M linear scale chart for the Total Crypto Market Cap.
The chart is self-explanatory. The total crypto market cap fell out of the Ascending Channel. The measured move is shown in the chart. Lastly, this is a monthly chart, so please have patience.
Included in the chart: Trend line, Ascending Channel, Support and Resistance Lines, RSI.
Have you read my Bitcoin: No Hopium Discussion 2? Check it out ->
If you enjoy my ideas, feel free to like it and drop in a comment. I love reading your comments below.
Disclosure: This is just my opinion and not any type of financial advice. I enjoy charting and discussing technical analysis . Don't trade based on my advice. Do your own research! #cryptopickk

TOTAL2 MARKET CAP ANALYSIS!!Welcome to this quick update on the TOTAL2 analysis.
I have tried my best to bring the best possible outcome in this chart.
A very good position for ALTS!!
As we can see from the above-mentioned chart the total market cap is retesting the upper trend line after breaking the triangle pattern just the line before.
This support level is also a crucial support level for the total market cap because breaking below and closing below this support level can be the worst scenario for ALTCOINS in the upcoming days.
IMO, the total market cap will hold this support just like before at the 170B LEVEL.
If the total market cap bounces fr this price level then we will be able to see a good green market soon.
Sorry for my English it is not my native language.
Do hit the like button if you like it and share your charts in the comments section.
Thank you...

TOTAL - A Bigger Fall May Be ComingThe dotted trendline is a trendline that extends to the beginning of this ticker (TOTALMCAP)
Just as it did in the first situation, price fell below this line, and then attempted to retest, causing a large rejection
This is very similar to what is happening now
Comparable moves are around -60% on the TOTALCAP

TOTAL MARKET CAP IMPORTANT UPDATE MUST READ!!Hi guys, This is CryptoMojo, One of the most active trading view authors and fastest-growing communities.
Do consider following me for the latest updates and Long /Short calls on almost every exchange.
I post short mid and long-term trade setups too.
Let’s get to the chart!
I have tried my best to bring the best possible outcome in this chart, Do not consider it as an
Financial advice.
TOTAL MARKET UPDATE
If you look closely at the liquidity of the market, it seems that they are made of a special mathematical function. The volume of capital input has experienced very good growth since the beginning of 2021.
The price is moving in the form of a long-term uptrend channel and now we are at the bottom of the channel. We expect it to continue to grow like the previous rally.
1. First rally: Starting from 500 billion to 2500 billion ( +2000 billion )
First Correction:Starting from 2500 billion to 1190 billion ( -1310 billion )
2 Second really: Starting from 1190 billion to 3000 billion ( +1810 billion )
Second Correction:Starting from 3000 billion to 1840 billion ( -1160 billion )
3. Third Correction: Starting from 1840 billion to 3700 billion ( -1905 billion )
This chart is likely to help you in making better trade decisions if it did consider upvoting this chart.
Would also love to know your charts and views in the comment section.
Thank you
