Alts MCAP (TOTAL2) AnalysisWe are either looking at a nasty rejection continuation
Or a double bottom formation and a break of this trendline that has been continually tested (3 times)
Personally the bear scenario sounds more logical to me, yet this is crypto so I accounted for both sides.
The 200MA (yellow line) wont hold if this breaks down. FYI
Totalmarket

Market Cap Bullish Divergence, HourlyCharts for TOTAL2 showing price printing lower lows while the rsi indicator printing higher highs, this is an example of a rsi divergence
Charts for TOTAL shows that price is in a possible expanding wedge I would call it, it still looks quite bullish
In comparison though a RSI divergence on TOTAL2 Hourly is a very strong bullish sign, VeRy

Market Cap Channel Bullflagan idea
trendlines that are relevant are drawn
the yellow MA line is the 200 moving average

Altcoin Market MACDThis MACD pattern suggests a reversal on the DAILY
Used the brush tool to roughly the draw the way the Lines will cross
Bought the dip on Ethereum

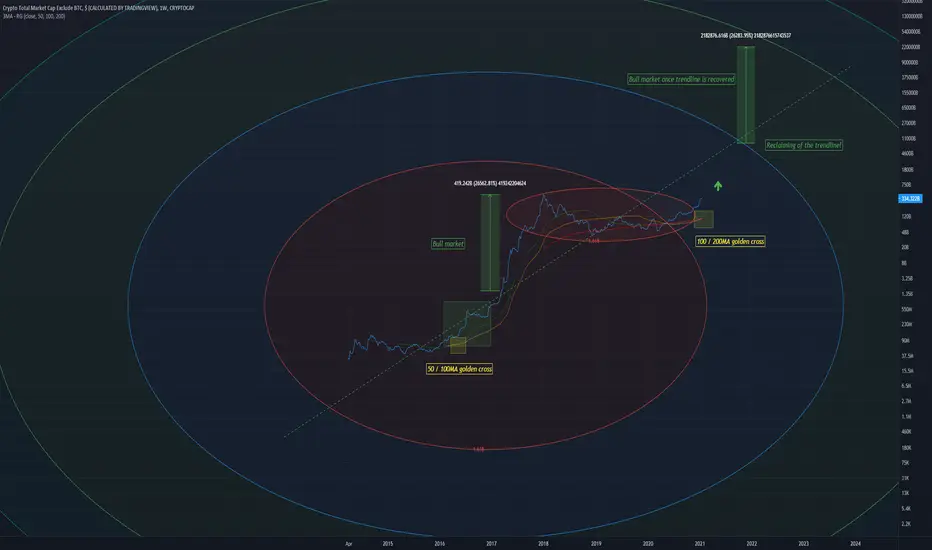
Market Cap - Further Gann and Top predictions Suggesting an early 2023 end to the bull run
So based on my previous analysis I have managed to extrapolate roughly a June 2022 - April 2023 end date for the bull run
Personally I might brave myself for another bear market if I have the courage, or I am selling around December 2021 just to be safe.
The first Gann ring hits the 2018 Top perfectly, I don't see why it would change for future price movement
Price has also just broken above the middle Gann line (2018 top) this will act as a new support, very bullish, continuation.

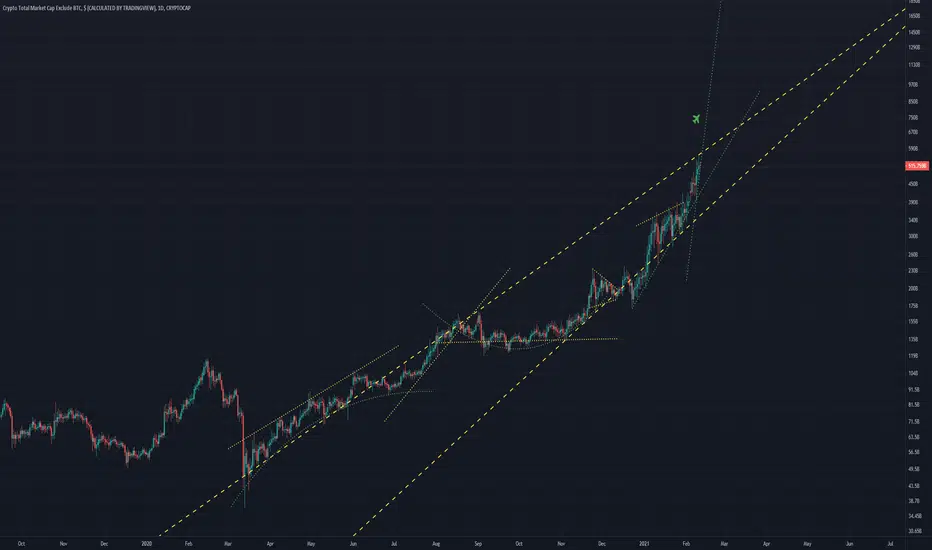
Market Cap - Was the last bull run unique?If the last bull run was unique I pose the question why are we seeing similar patterns? (within circle)
With an impressive 452846.26% increase to reach the Top of the fib channel
Will this occur again? The TOTAL market cap would be incredibly high if so
I have my doubts but this is cryptocurrency, to reach the top again another massive move is implied, we will see I guess.
A very optimistic scenario.

Market Cap - Sell pointSell point suggests 1 December 2021 to be optimal if this channel holds true
66 Degree angle ascension Is present within last bull run and proceeding bull run
I think I will be selling around this area, market may stay up till June 2022 as suggested by my previous chart
Bull run in effect

TOTAL2 Small Pullback abovePullback above blue structure
The Gann range (1/1 , (1/2) is massive and extends up to like 4T
I doubt it will hit four trillion, I hope for 2T
I believe there is still a lot of bullish potential within the altcoin marketcap

TOTALMCAP looks bullish 1H, 4HOpen moving averages is when they are structured in this order, descending - 50, 100, 200 MA
During these periods of time bullish activity is often highly favored
A few golden crosses can also be identified on TOTAL2
I still think the TOTALMCAP is extremely bullish throughout 2021

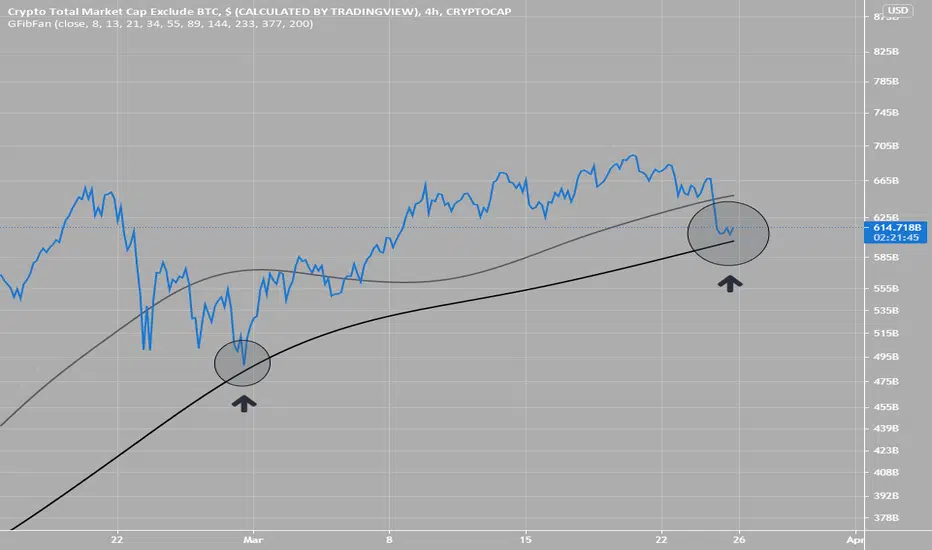
The bulls return - altmarketTOTAL2 has been rejected bullishly at the 50MA on the daily chart
While OTHERS has been rejected bullishly at the 200MA on the 4Hr chart
Observation post

TOTAL2 Possible supportPrevious bounce can be seen on this fib ma line,
bounce may occur again
this is the 4H chart
Where is the TOP for the market? Using Fibonacci time and identifying base structures we can use this tool to identify when the next top will be
0.618 was favored in the last bull run as a top point and will likely be favored again
This top aligns with June 2022, so we have a lot of the bull run left
I haven't assigned a top point because this could absolutely m00n, and just knowing the time is enough imo
I have done a lot of research into TOTAL2, here is some of my previous ideas

Uncanny Similarities TOTAL2Using True Strength Indicator to display similarities
Comparing last bull run to possible and likely future bull moves
Looks really good so far
Let me know through message or in comments if you would like a link to this indicator !

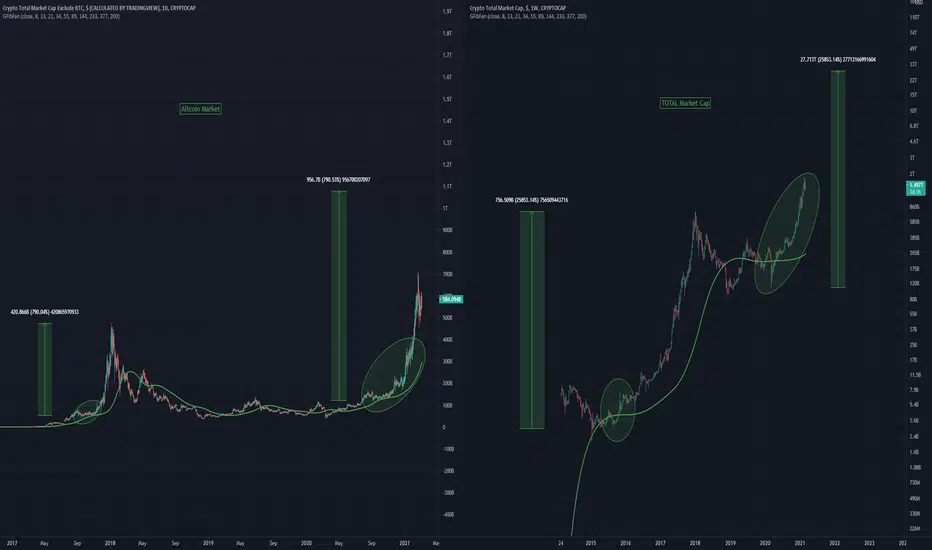
The Cryptocurrency Bullrun has Alot LeftComparison between TOTAL and TOTAL2
A heap of room to grow
Making assumptions based on the previous bull run
#totalmarketcap #dailyHi guys..its the latest analyze chart of #TOTALMARKETCAP in Daily time frame.if you are interested any crypto that you want analyze with me and any questions please do not hesitate and comment below the chart!
if u like it press like-comment and folow me.thx

The Irony Within the Market - UGLYI know beauty is all about perspective, so here's mine
This is an ugly formation
While NFT's (digital artwork) within the Ethereum community continue to explode, an array is present, and as they cement their place
We are stuck with this ugly (W) formation on the Altcoin market
I just find it Ironic, I had to post
Maybe irony presents a form of truth?
Above is a long term chart of the altcoin market of mine, hopefully it provides clarity

Heading for a large MCAP ? TOTAL2 A bulls perspective of the current situation on TOTAL2
Within a falling wedge above 1.618
This may lead to a breakout and a test of 3.618
The bulls continue!

TOTAL2 possible TOPan idea for the top of the total market cap excluding bitcoin
A previous rejection at 4.618 shows potential for future rejections
This is the next strongest trend where 4.618 can be seen to be a potential rejection point

Market Cap Idea TOTAL2Continuation of the apparent parabolic rise that is occurring
Looks very bullish
Conspicuous Golden Crosses TOTAL2First it was a 50 /100 MA golden cross
Now we are faced with a 100 / 200MA golden cross
This should lead to the reclamation of the major uptrend line, if you are looking to buy realise you are still early. Very early.
This golden cross will be epic.
Looking at the total marketcap TOTAL2Three rejections within this trend that has formed
Hoping this formation will push the market cap to ~700B
The rounded top formation is very apparent currently and is quite bullish, as seen on linked chart (highlighted pattern in yellow)
Merry Christmas!

A nice fractal TOTAL2A fractal around the occurrence of golden crosses in these areas circled.
I hope a bullflag will form outside of the circle.
This is the altcoin market

TOTAL2 Bullflag - ContinuationTOTAL2 has transition to 2.618 within the strongest Fibonacci circle trend.
This will likely lead to the bulls continuing their run.
Its a strange pattern but I believe it can be interpreted as a bullflag once the area within the triangle (flag) completes.
In the attached chart I see a large bull impulse move coming within this newly discovered 2.618 territory (on the MACD). Many will be shaken out at this level however.
