Totalmarketcap

Ichimoku Analysis for TOTAL2Are you afraid? well $TOTAL 2 looks like it is just fueling up. Finally breaks above the weekly kijun resistance here. Hope to get a good rally this week on the #alts. Any pullback of #Crypto towards tenkan san will be a good buying opportunity with kijun as sl.
Total market cap for all crypto combined. We just got a huge pump in BTC. Ae we expected it did not hold. We are looking for longs still at a lower price highlighted bellow. This is not finical advice

Crypto Total 48k FractalWe have taken liquidity from the last supply area (yellow line) at the top BEFORE the FTX pump
This means all Shorts that have tight stop losses BEFORE FTX DUMP are now taken out.
TOTAL is painting a fractal similar to how it did at 48k
This is concerning, and Long should be very careful here


MARKETS: DebtCeiling 2013& What FollowsHi Traders, Investors and Speculators of the Charts 📈📉
I am passionate about economics and history. Together, these two can tell a compelling story of ow interlinked everything is, and give a glimpse into the future should certain events repeat itself.
That is the core of my argument today as we look at the previous time he US Government hit a debt ceiling, and what happened after.
It would be great if you could watch the video , but if you can't spare 10min here's the summary:
📈 VTI : Vanguard Total Stock Market ETF
I love using the VTI as a general overview of the trend on stocks. You could also use the S&P, it's just a personal preference considering they have interest and hold 50% plus shares of nearly EVERYTHING.
The VTI mostly consolidates and sees some downward price action for three years after USA announces debt crisis. VTI recovers in Jan 2016, three years later.
In other words, in the stock market you may see some down, some up. A near equal amount of buyers and sellers to balance out the total environment. China50 seems to be a precursor of what is about to happen on VTI.
📉 Look for buy opportunities during this time, prepare to hold long term.
📈 GOLD
Gold starts declining before the debt crisis is officially announced. A multiyear bear market follows, one of the worst. Continues up until 2016.
📉 Seems like a good idea to take note of the above and get out of gold, enter again during new lows
📈 BTCUSD / Crypto
We didn't have an overwhelming amount of alts during that time, so only the Bitcoin USD chart can give an idea of what may happen to crypto after a debt ceiling is announced. Interesting to note that BTC rallies almost parabolically and reaches it's first ATH. Then, at the same time the debt crisis is announced. Bitcoin continues into a multi year bear market, only to recover in Jan 2016.
📉 Do I really need to share my unpopular opinion here ... It all depends on how much you believe in history repeating itself.
📈 USOIL / OIL Industry
The oil industry sees the second worst bear market yet, only recovers in Jan 2016 but does not make a higher high until 2020.
📉 Oil saw a sharp v Shape recovery after the announcement of Covid. Oil is still in higher demand than usual considering scarcities so I believe there is another push upwards towards the 3.618 Fibonacci Extension, also the next immediate resistance zone around 200.
📈 EURUSD / strength of the Euro
The announcement of the 2013 debt ceiling sends the Euro into a bear trend against the dollar, bottoming out at 0.76 three years later, again only in 2016.
📉 Euro recently saw a strong V Shaped recovery, but considering the next point you may want to rethink holding Euros:
📈 DXY / Dollar Strength Index
In comparison by percentage, the DXY surpasses every other market. The DXY increases nearly parabolically over this period of time all the way until November 2016. Which naturally ames sense because when there is talks of an economic crises, people tend to sell their assets for CASH which would explain why markets dropped but DXY increases due to higher demand.
📉 Dollars gain against all in Forex markets.
Here's more info on the debt ceiling and what happens if a country defaults:
What are your thoughts on this?
_______________________
📢Follow us here on TradingView for daily updates and trade ideas on crypto , stocks and commodities 💎Hit like & Follow 👍
We thank you for your support !
CryptoCheck

Short term Crypto Total Market Cap AnalysisHi Everyone!
The TOTAL2 Index appears to have found a support area around 428 (see chart below), at least temporarily. Indeed, at the moment I cannot confirm of a bullish impulse structure (rally) formation, so I consider this last bullish leg as a technical rebound, at least until it destroys the resistance. It could be interesting to follow this index in the next sessions/weeks.
If this idea will be supported by your "Likes" we will continue to follow this analysis with updates below.
Thanks for your attention and please... trade with care! 💖

TOTAL crypto Market cap under pressureThe TOTAL PA has made a massive push over the last few weeks and has pushed up to the neck line of the Pre FTX Crash, by using a double Bottom pattern to gain strength.But now, it has another battle. PA is overbought on most timeframes and is still under the neck line of that previous PA
There is support on the Newer Trendline and the question is, Can it break up before it comes to that Apex of the two on 31 Jan, remembering that the FED ( The DXY Support Group ) will be announcing their latest Rate Hike the next day, on 1st Feb
Lets not fool ourselves here, there is every possibility that PA will get rejected and as much chance it will break over that neckline.
the only sensible option righ t now is to take precautions, maybe take some profit and we wait....................

Pullback in this channel? Headed to the bottom of this channel? And would that bring us back into the larger Daily downtrend? And resolve that this has been another Bull Trap?

TOTAL chart 1 hour - REFERENCE ONLYJust putting this up here now as, well, we can see, something HAS to happen soon. Take care..Could go either way

TOTAL Market Cap Long Term Cup and HandleThe figures here are hypothetical , just remember that please But...........
Since the ATH of Jan 2018, It could be said that the Total Market cap has created a Classic Cup and Handle Pattern, with current PA hoovering around the $1 trillion mark
So, If this Classic trading pattern plays out, a Measured move puts PA in the $ 8 Trillion Mzone, or more.
And how long would that take ?
Well, remebering how it has taken 5 years to get to this point, it could be anywhere from 3 to 5 years maybe but, things can accelerate given current world affairs seemingly driving some very large countries away from using the $. And with no other viable alternative, Crypto IS being looked at Very VERY closely.....
Hang on Guys and Gals..We ARE Early....be patient....

TotalMarketCap-Analysis - 2023- Bearish PossibilityHello everyone Hope you all are doing good,
This time I thought to make a Technical Analysis on Total Market Cap only for the year-2023.
Not a Financial Advice, please do your own research before investing in trading.
This analysis is only if Bitcoin puts Lower lows. There are possibilities this may not happen too if the price stops at any of the blue trendlines.
In past every time we usually see in Bitcoin a big volatile move or Liquidation move, may be roughly a 50% drop in price, so in the current bear market we did not see something like that volatile move until now.
In RSI the trend is Diverging from Bearish to Bullish, so I felt somewhere in this Year-2023, before heading to the next cycle we may face this kind of volatile move to remove the Leverage positions.
Based on this Analysis in my Opinion somewhere in the month of feb OR March Or April.
Ok thank you, please like and share and follow me for more interesting and helpful updates. If you have any questions please comment.
Stay safe and stay Smart.

TOTAL Crypto Market Cap, what next ?Measured move completed
MACD now oversold & may turn Bearish but RSI already retreated and may offer support to PA to Keep it above long term resistance line now used as Support
7 days till FED Rate Hike
Enough time to reset a little, maybe needed - All depends on the FED choice of the expected 25 or 50 base point raise.
As a result of where PA is now, we can probably expect Crypto to cool off over the next 7 days, Just range - Some coins may pop if sentiment is still high
Now maybe a good time to take some profit

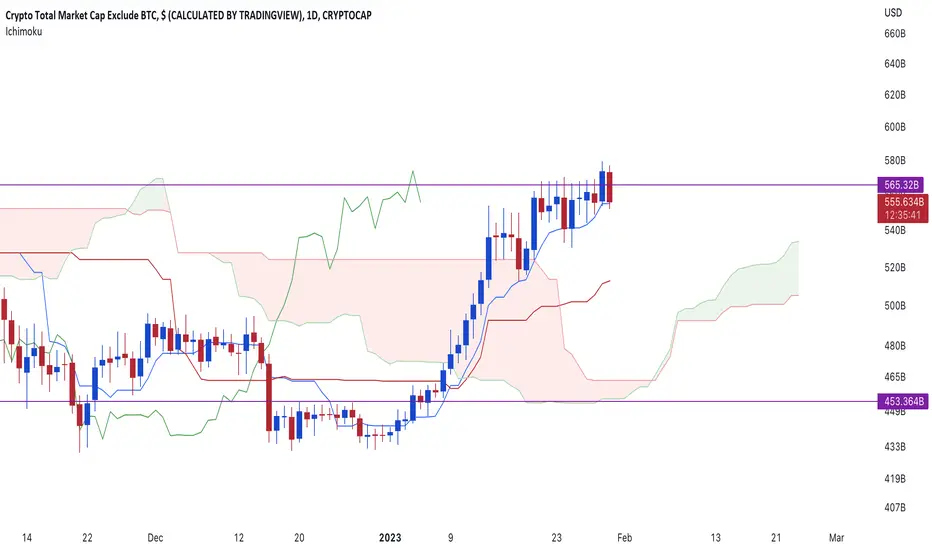
Crypto total market cap 45 % drop soon. Be ready!Total crypto market cap broke bearishly as Bitcoin did.
We expect a short term bounce and getting rejected at the strong resistance.
Final target for bears: 585 - 600 B
After that we expect the real accumulation face and the new bull market to start.
P.S Don´t get overexcited with a short-term bounce

TOTAL2 MA EvolutionThis is the 50,100 and 200MA
They are in their respective colors
I expect the 50 and 100MA to slowly curve around while the 200MA remains in a strong upward state
For those in long term
Weekly timeframe

Pattern Similarity with 2018 Bear Market RecoveryWhat follows is a comparison of the daily chart during the 2018 bear market recovery with the present weekly chart. Markets like to repeat patterns, with similarities and differences:
Repeating Pattern Similarities:
Both made a head and shoulders top
OBV and Volume show similar patterns of behavior in both charts
The amount of correction prior to recovery is similar
Repeating Pattern Differences:
2018's head and shoulders top had a descending (or practically straight) neckline. 2023's head and shoulders top has an ascending neckline
OBV has dipped more during the present downtrend than before, and Volume peaked earlier during the head/shoulders top this time (Volume is also down more now than it was during 2018 recovery, respectively)
Signs are pointing to a recovery, but DXY is behaving strangely and market conditions are entirely different than they were in 2018.
2023 Recovery may be higher than 2018, if neckline is reached - it could look like a double-top with a lower high (potentially even another HS pattern at the end)
Should the pattern repeat itself again on the higher time frame, I've outline a rough path that could take us into one of the two red boxes, or even somewhere in between, with:
-- Conservative Targets near previous head and shoulder top lows
-- Aggressive Targets stopping at or near the ascending neckline, and this would coincide with my theory of a lower high double-top, which I think is the more likely scenario (see related idea below)
-- Otherwise the potential to stop somewhere halfway in between either
Chart is long until recovery completes at one of the levels above.
This idea fails immediately if we fail to remain above the wedge here on a re-test on the falling wedge breakout (3-day chart pictured below):
Related Idea - neckline targets coincide with lower-high double-top theory:
Cheers, and thanks for taking the time to read through my ramblings!
-- dudebruhwhoa

#ALTCOIN MARKETCAP is Flashing Important Signal.Have a blessed Sunday to you all.
ALTMACP broke to the upside.
I am just skeptical about it for one reason, the confirmation candle closed in the red.
Unless we get a candle closing in green above the same, expect manipulation.
Be careful about holding the maximum portion of your portfolio in ALts.
Alt/BTC pairs will bleed.
I prefer holding BTC and a few alts with fundamental advantages like VRA is 230% already, HFT has started its run( Chart coming soon), and many other Gems APT did 4x.
So follow me if you want to know the next potential 50x coins!
DYOR, This is not financial advice.
Do show your support if you like my work.
Thank you
#PEACE

We Have SHIFTED to BULL TerritoryYesterday it looked like we wouldn't go through resistance but we did so now I'm a bull. Go with the flow be like water and win.

MARKET BULL SEASON ( ALTCOIN SEASON )Crypto coins started to be discovered. Everyone wants to be rich. And this is why it is turning to altcoins instead of btc.
Especially the Shit coin Doge, Hot, Btt, Chz, etc. It will turn to pump coins. Season is PUMP season.
If the first areas are happy, the last ones will suffer great losses.
Sorry, these are the Facts.
You can wait for years. It is useful to be careful.
Because when they get what they want, they have nothing left to buy from you.
Sorry, Doge will finish the season with Btc.
For now, I see it as May 31, 2021.
Stay tuned, ahead. I'll share the exact dates.
Enjoy it very much on May 31st.
Pay attention especially on May 24th.
Hill Hunt will go out (ALL TIME High will come).
Look at the top selling. May some others win.
Getting out in the right place is most important.
This season is the season of disposal.
Move up, those who open Short can do a lot of damage.
When the bear season comes, we will lower the prices together.
Pay Attention to Your Stops.

MARKET CONDITIONHere we can see that TOTAL MARKET CAP has a RESISTANCE at the zone of "1.4 T" and if it takes RESISTANCE from the zone we can see a good correction in the market. Please avoid to take LONG TRADES at this time and if the the candle takes correction from the point you can look for short trades in the market.
ENJOY!!!!!!!!!

TOTAL CryptoMArket Cap Daily UpdateDaily TOTAL chart shows we near completed to the neckline of FTX crash recovery MACD, RSI & StochRSI all overbought
4 hour shows similar state and so it is very likely that PA will remain range bound along the trendline now, but as support
VERY BULLISH for future moves
But I think we still need to take care that is not turned into a Bull trap by those BEars with Attitude.
Right now, TradFi is battling hard and, if I am honest, I will remain very cautious

Total market capTotal market cap >> Harmonic bat negative
We may see a drop in the coming days. Be careful .
