TOTAL ROADMAP (1D)By analyzing the TOTAL chart, it can be expected that the crypto market still has room to move downward. Of course, there will be fluctuations along the way, but at least TP 1 is likely to be hit.
For a trend reversal, the lower green zone is a highly significant area.
Let’s see what happens.
A daily candle closing below the invalidation level will invalidate this analysis.
For risk management, please don't forget stop loss and capital management
Comment if you have any questions
Thank You
Totalmarketcap

$RAY Weekly AnalysisNASDAQ:RAY has retraced to a key support zone and ascending trendline.
A bounce here could confirm a bullish continuation with a target of $21.
Support: $2 $3
Resistance: $21 ATH
Bias: Bullish above support
Watching for a strong reaction. Breakout or breakdown?

BTC on daily timeframe
"Concerning BTC, the price is currently experiencing a strong bullish momentum. However, as evidenced on the TOTAL chart, there are indications of a potential correction. In my view, if the price surpasses a critical decision level convincingly and forms a bearish (FVG) pattern, a sell position could be a prudent choice with low risk."
If you have any specific questions or need further assistance with your text, feel free to ask!

MARKET OVERVIEW BTCUSDT - WEEK 9/2025📊 MARKET OVERVIEW BTCUSDT - WEEK 9/2025
(📅 February 24 - March 3)
🔍 Analysis Method
✅ Market Capital Flow: Tracking the correlation between capital inflow & outflow
✅ BTC Dominance (BTC.D): Evaluating BTC’s share of total market capitalization
✅ U.S. Dollar Index: Monitoring macroeconomic news affecting liquidity
✅ Key Focus: Only considering significant timeframes
📡 Adjustment Monitoring Method
🔹 Rainbow Sniper: Used to track market trends and generate real-time alerts
🔹 Approach: More dynamic tracking than purely directional analysis
💰 TOTAL Market Capitalization
📌 Chart Link: TradingView Chart
📊 Expected Market Cap Ranges:
📈 Upper Range: $3.19T - $3.27T
📉 Lower Range: $3T - $2.95T
🔹 Early Next Week:
✔️ Slight increase in capital inflow on the D1 cycle
✔️ Uncertain whether it will reach the upper range → Monitor closely
🛠 Action Plan:
🔹 Set up Rainbow Sniper to track BUY SCALPING D1 trend peaks
🔹 Identify new SELL signals on D1 timeframe
📌 Summary
📈 D1 Trend: Capital inflow expected to continue increasing
📉 Correction Phase: After growth, capital is likely to be withdrawn, leading to declines in W & D1 timeframes
🔹 Long-Term Trend: Still bullish, any dips will be correctional pullbacks
💵 Capital flow changes are minimal this week
📊 BTC Dominance (BTC.D)
📌 Chart Link: TradingView Chart
🔹 Current Status: BTC.D fluctuating within a tight range (60-61%)
🔻 Awaiting confirmation for a drop to 59.7%
💡 Key Scenario:
✔️ BTC.D at 61% + Total Market Cap Increase → BTC price rises 📈
✔️ BTC.D at 61% + Total Market Cap Decrease → BTC price falls 📉
💎 BTCUSDT Price Analysis
📌 Chart Link: TradingView Chart
💰 Current BTC Price: $96,600
📉 Short-term View: Bearish, but not a strong signal yet
📍 Key Price Levels Next Week:
🔹 Upper Bound: $96K - GETTEX:98K
🔹 If Total Cap ↑ & BTC.D stays at 61% → BTC may retest GETTEX:98K
📌 Swing Trend: Still in a SELL trend
🎯 Key Trading Strategy
🔻 BTC expected to see corrective pullbacks, presenting shorting opportunities
📍 1-2 Week Price Target:
✔️ $85K - GETTEX:89K with current market structure & news
🚀 Final Thoughts
📈 Capital inflow continues on the D1 timeframe, but a correction is expected
📊 BTC.D movement is key to determining BTC’s price action
📉 BTC remains in a SELL trend, favoring short-selling strategies
🎯 Target BTC price in the next 1-2 weeks: $85K - GETTEX:89K

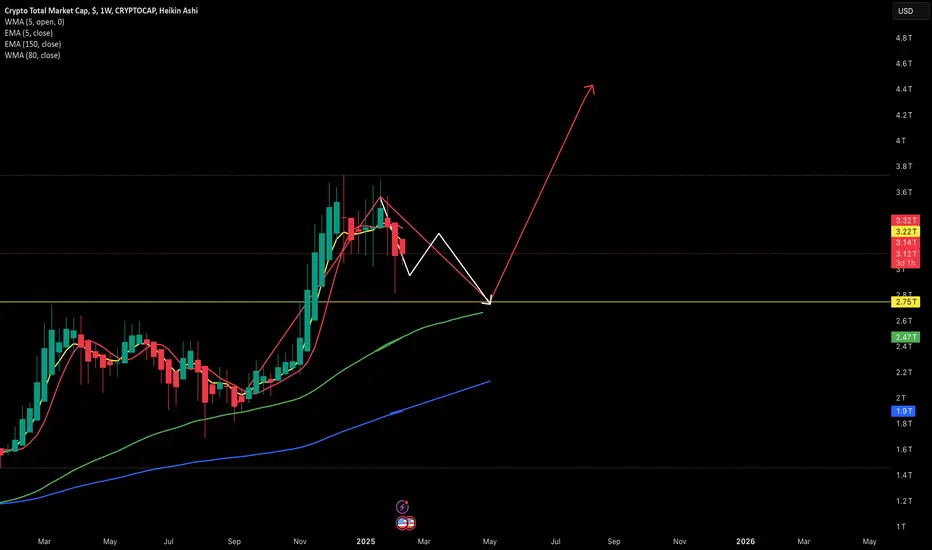
May 2025 going to be blast for AltsThis week till May 2025 hopefully alts season. The weekly golden cross between the EMA 200 and SMA 200 for TOTALMARKETCAP has been confirmed.
In 2021, this signal marked the beginning of one of the largest altseasons.

TOTAL2 - Breaking the Down ChannelThis is the 2Hr chart and I have plotted some green bars pattern suggesting a reversal out of this down channel
The down channel is due for reversal and price is settling at the lower band of the channel
I think the move up will be quick, very quick.
Expecting a day where there is 100% moves across the board for altcoins.
Again the 2Hr chart this is.

TOTAL2 - Similar Positions The White area represents the 200MA and in both situations the MA is tested and then puts itself in the prime position (green circle) We are now in this prime position.
The white area will unlikely be tested again this bull run as we are heading into the next phase of the bull run indicated by the arrow
BULL TIMES
Weekly timeframe

TOTAL2 - Rising MegaphoneThis structure allows for strong bullish continuation on this TOTAL2 chart
The green area line shows the continued support for price, this is also the 50MA
I believe we are going to see more support for alts and therefore the market cap will increase
Bullish on this Weekly

OTHERS - Bull Channel Looking for continuation of this large channel on the Weekly timeframe
This chart excludes BTC and ETH but there is such an oversaturation of alts that i expect a massive pump across the board, legitimately on every altcoin,
If the channel hodls we are in for a massive run
PUMP IT

ALT SEASON IS COMINGWouldn't this be the perfect outcome? something many aren't seeing anymore at this point.
One thing i've been noticing is that social behavior is massively changing and people are litteraly stcuk in the trenches and hating on each other for being bullish or bearish which is basically the type of behavior like what we had in 2020 during COVID.
I overall remain bullish and don't see any reason why i shouldn't be. All the fundamentals are in our favor and AUM's are filing for ETF for alts left and right which means a requests to inject BILLIONS in capital into them.
Time will tell of course but i overall remain bullish untill proven different.
CRYPTO IS UNDER. VALUED.

NQ <> TOTAL 3"Playout chart of NQ vs. TOTAL 3 over the past few years, highlighting periods of market expansion, cooling phases, and corrections.

Bitcoin (BTC) Price Forecast Based on Market Cap and BTC DominanBitcoin (BTC) Price Forecast Based on Market Cap and BTC Dominance
If the total market capitalization decreases to $2.77 trillion and Bitcoin Dominance (BTC.D) drops to 58%, then the price of Bitcoin would be approximately $84,000. This aligns with previous analyses where I discussed the potential for BTC to adjust within the GETTEX:82K -$85k range.
To calculate the price of Bitcoin (BTC) when the total market capitalization decreases to $2.77 trillion and BTC Dominance (BTC.D) decreases to 58%, we use the following formulas:
BTC Price Formula:
BTC Price = (BTC Market Cap) / (Total BTC Supply)
Calculating BTC Market Cap:
BTC Market Cap = (Total Market Cap) × (BTC Dominance / 100)
Given the data provided:
Total Market Cap = $2.77 trillion
BTC Dominance = 58%
BTC Price Calculation:
To calculate the price of BTC, we need the current total supply of BTC, which is approximately 19 million BTC (you may confirm the exact figure at the time of calculation).
Steps:
Calculate BTC Market Cap:
BTC Market Cap = 2.77 trillion × 0.58 = $1.6086 trillion
Calculate BTC Price:
BTC Price = $1.6086 trillion / 19 million BTC ≈ $84,526.3
Thus, the price of BTC would be approximately $84,526 if the total market cap drops to $2.77 trillion and BTC Dominance reaches 58%, assuming a circulating supply of 19 million BTC.
This conclusion aligns with previous assessments, indicating that Bitcoin could be adjusting toward the GETTEX:82K -$85k range.
Total , about to explode Candles tapping ATH atm which is a sign of imminent rebound and fly , times running out and we have to lit the fire soon , anywhere between around 10 trillion to couple more would be a precious load off zone , tbh holding right above ATH with the nasty alts situation feels weird for me too but let’s hope mid range caps start getting back soon .


BTCUSDT Analysis BTC broke the downtrend line, and bullish momentum is on. The price bounced after the breakout point (green region) retest of $95,611, reaffirming firm support.
Hoping for a potential 6.76% return at $102,431!
The bulls will remain dominant if BTC stays above $95,611. A dip below this level will disrupt the setup.

TOTAL MARKET CAPTOTAL MARKET CAP 👀⏳
Bitcoin Ethereum and Altcoins pause or run line!
Victory belongs to those who dare to take one last step.

Total Crypto Market CapHello and greetings to dear traders,
I am proud to share with you the thorough analysis I have conducted on the Total Crypto Market. This weekly analysis not only represents a clear target for the future but also effectively outlines trend lines and buying zones on the chart.
Let me clarify the principles of this analysis by posing a few questions and providing clear answers:
Can the market experience a new peak before reaching the buying targets?
Yes, it is possible. However, I am determined to enter the market with an ideal purchasing strategy, rather than being a bystander with an empty pocket due to emotional buying at the end of market corrections.
Is it possible for the price to drop below our buying ranges?
Yes, this is a possibility. However, by using an appropriate strategy and obtaining confirmations from market signals, similar to last time, we can achieve desirable entries.
Risk Disclosure:
This analysis is provided as guidance and general information and should not be considered financial or investment advice. Engaging in any trading in financial markets involves risk and may result in the loss of your capital. Therefore, it is recommended that you conduct the necessary research before any investment and be aware that investing in cryptocurrencies carries significant risks.
Wishing you all the success!
Fereydoon Bahrami
A retail trader in the Wall Street trading Center (Forex)
Dear friends and valued companions, I apologize for using a personal logo and for my lack of awareness in this regard. In the previous analysis, the esteemed TradingView moderators hid my analysis from public view, and I was compelled to revise it. Now, with the improvements I have made, I am resending this analysis to you. I sincerely thank the TradingView community and all traders.

TOTAL2 - Support Found Above Down Trend Down trend in white has become a support level for price on this Weekly timeframe for this altcoin market
This is also within a small up channel forming
I expect further upward movement in the coming weeks
1T has a big support
The Largest Crypto Liquidation Ever!Crypto's Largest Liquidation Event: Has the Market Found Its Bottom?
The recent liquidation event in the cryptocurrency market has made history as the largest ever recorded. Such an occurrence strongly suggests that the market may have reached its bottom. However, if past cycles are any indication—such as the recoveries observed in 2020 and 2022—it typically takes more than two months for a full rebound to materialize.
Historical Precedents and Market Recovery
Looking at historical events, the crypto market has shown resilience time and again, but recoveries have never been immediate. Take, for example, the COVID-19 crash of March 2020, the Luna collapse in 2022, and the FTX fallout later that same year. Each of these events led to significant downturns, followed by prolonged recovery periods before prices stabilized and resumed an uptrend.
Given this, it's crucial to manage expectations. While some investors may hope for a rapid V-shaped recovery, history suggests that most altcoins are unlikely to revisit their December highs within the next couple of months, if not longer. Market sentiment, regulatory developments, and macroeconomic conditions all play a role in shaping the recovery trajectory.
The Importance of Patience and Realistic Expectations
Crypto investors often seek quick rebounds, but expecting an immediate bounce back within days is unrealistic. If those expectations aren’t met, it could lead to unnecessary frustration and poor trading decisions. Even in the rare cases of a swift V-shaped recovery, such as the one seen in 2020, the market still took several weeks to regain lost ground, with multiple dips along the way.
For those navigating the current market conditions, patience remains key. Strategic, long-term thinking will likely yield better results than reactive, short-term trading. While it would be a welcome surprise if the market defied historical patterns and rebounded sooner than expected, it’s wise to prepare for a more extended consolidation phase before a sustainable uptrend emerges.
Final Thoughts
Although the largest liquidation event in crypto history may indicate that the market has bottomed out, historical data suggests that recovery will not be immediate. Investors should brace for a potential multi-month recovery period before prices begin a sustained upward movement. Managing expectations, maintaining patience, and taking a long-term approach are essential strategies for navigating the current market landscape.

TOTAL Crypto Cap Candle close suggest incoming ALT seasonBeen posting the Bitcoin version of this for a while and so now, I expanded into the
TOTAL CRYPTO MARKET CAP CANDLE CLOSE COLOUR on aMonthly chart
January Closed GREEN
February has 8 Green to 2 RED since 2014
Only 3 Green Feb candles after a Green January, which we just had
Only 1 Red February after a Green January
After those 3 Green Jan Feb candles, 2 Green March followed
Higher % of Green Feb & possibly March also
This could be led by the ALT market more than Bitcoin
As mentioned in the Bitcoin version of this chart, we are more likely to get a RED Feb in Bitcoin and, so, if we get a GREN Feb in the TOTAL market, that is led by ALTS.
The question is, Which level of ALT
And to answert hat, I shall be posting the OTHERS version of this as soon as I can get My Wife to stop asking me to fix the Hoover ;-) - I mean , seriously, asking once a month is enough surely !

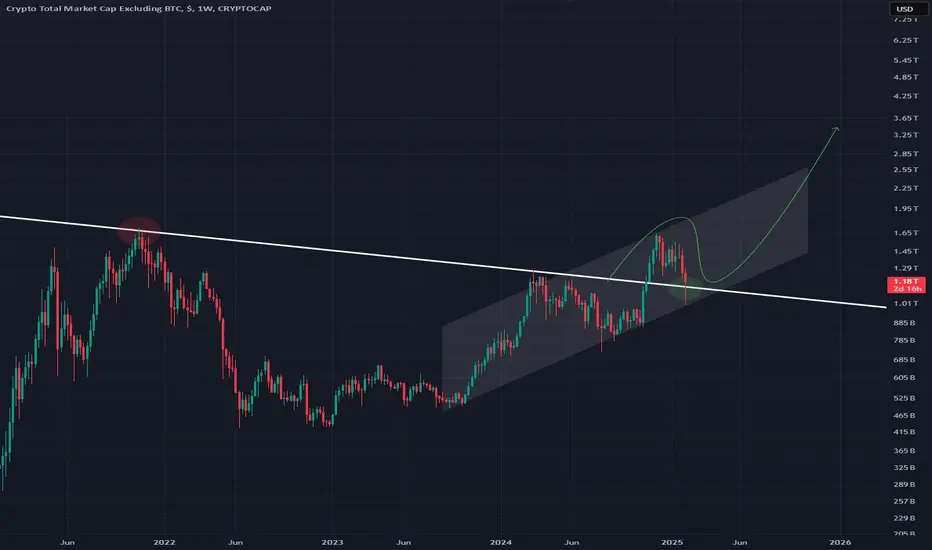
TOTAL Crypto Market CapThe TOTAL Crypto Market Cap is currently trading range-bound between its 2021 and 2024 all-time highs. For bullish momentum to return, a decisive breakout above these resistance levels is critical. Such a move would not only boost market confidence but also likely attract fresh retail investment into the crypto space, potentially triggering a broader market rally

Total market cap chart Why total is important I hope I dont need to explain. CRYPTOCAP:TOTAL
Possible Targets and explanation idea
➡️Weekly chart. Marked 2 times with trade on indicator moment to SELL and out of crypto
➡️June 2022 was a main bottom for crypto and BTC especial
➡️November - January we are under real value of total
➡️C4L direction showed also November-January whales accumulate aggressively
➡️White zones is depression zones where whales also build average entry for investments
➡️Take profit lines marked by fib levels + take profit indicator before correction
➡️ Correction I think we will see at April-May 2024
Hope you enjoyed the content I created, You can support with your likes and comments this idea so more people can watch!
✅Disclaimer: Please be aware of the risks involved in trading. This idea was made for educational purposes only not for financial Investment Purposes.
---
• Look at my ideas about interesting altcoins in the related section down below ↓
• For more ideas please hit "Like" and "Follow"!

Solana ($SOL) - ATH Break-Out - A Bull To RememberTRADENATION:SOLANA and I are good friends.
I called the ultimate #Support and went #Bullish on $SOL.
Went #Long on COINBASE:SOLUSD ever since 10, then 15, then ramping the the #Bull on 145.
* see related idea for details.
Cashed in at 250, was the #ATH and had doubts, seen the #Correction coming.
What's next for BINANCE:SOLUSDT ?
A Massive #Pump, that's what!
TRADENATION:SOLANA will become Number 3 on #TotalMarketCap ( CRYPTOCAP:TOTAL ), mark my words.
Why? Why will TRADENATION:SOLANA pump?
It's quite simple actually.
It's all about the MARKETSCOM:BITCOIN pushing #MarketSentiment up.
But even BITSTAMP:BTCUSD will need to provide some #Correction, and that is seen on the CRYPTOCAP:BTC.D chart.
There will be some wild #Swings on #BTC.
I believe that with the #AltSeason and #AltCoins Cycle starting, CRYPTOCAP:SOL will bloom.
That's because of TRADENATION:SOLANA connection with the #Solana #Meme Coins Ecosystem.
CRYPTOCAP:TOTAL2 & CRYPTOCAP:TOTAL3 are about to shoot.
Billions printed, coded #MemeCoins.
COINBASE:SOLUSD - #TechnicalAnalysis
- #ElliottWave: Wave 4 Complete
- #RunningFlat at #ATH
- #Break-Out
- Wave 5 Confirmation
My CRYPTOCAP:SOL Buy Levels
- Entry @ 240
- SL @ 140
- TP @ 500
