Total market cap follows 2016-2017 parabolic run!The market, which led parabolic waves despite being rejected in 2016-2017, is based on stronger foundations with the increase in corporate interest in 2020-2024 and the state-based adoption process that started in 2020.
We will witness the highest levels in history!
Totalmarketcap

ALTS Market Cap Chart AnalysisThe ALTS market cap has broken out of a descending broadening wedge, triggering a strong bullish rally. However, it is facing resistance at a key horizontal supply zone.
The Ichimoku Cloud shows strong bullish momentum, indicating the possibility of a continued upward move. A decisive breakout above this resistance level could trigger a significant rally, further strengthening the upward trajectory of the ALTS market.
For updates on other coins or personalized insights, feel free to reach out to DM.
@Peter_CSAdmin

TotalCrypto Market Pullback: What's Next for the Bull Run?Hello, crypto enthusiasts!
How are you today? I hope you're doing well and not letting this price action ruin your day. Times like these can be tough if you're unprepared or trading with emotions instead of following a proper plan or system.
This chart represents the **Total Market Cap** of cryptocurrencies, and as we can clearly see, it's heading down. Today marks the second consecutive day of downside price action, accompanied by increased volume.
Yesterday was the ideal exit point for the long trade that started after the U.S. elections. The signal was simple: **price pierced the PSAR**, indicating that the trade should be closed. While this index doesn’t represent an actual tradable position, it reflects the system's logic. Since this index aggregates the price action of all crypto assets, its decline suggests that most crypto assets are also experiencing downside pressure. While exceptions exist, this is the general trend.
Technical Analysis with Oscillators
- **RSI**: The Relative Strength Index has dropped from overbought levels (above 70) and is now at **~52**, signaling weakening bullish momentum. This suggests a potential continuation of the downtrend.
- **MACD**: The MACD line is trending down and crossing below the signal line, which indicates bearish momentum. This crossover often signals a further downside.
- **OBV**: The On-Balance Volume is showing a decline, confirming that selling pressure is dominating the market, supporting the bearish move.
What’s next?
- **First Target**: The 2021 top, marked by the black line, where we may see a reaction.
- **Second Target**: The **0.236 Fibonacci retracement level**, which provides another possible support area.
Of course, nothing is ever certain in trading. Tomorrow, the market could rally and ignore all current signals, but for now, the price appears to be trending downward.
A few reminders:
- In crypto, things rarely go the way we want.
- Stay prepared for every scenario and keep your portfolio ready to re-enter the market.
- Avoid letting hope and fear dictate your decisions—they won’t lead to profit.
I'll keep monitoring the markets and share my thoughts as they develop.
If you found this analysis useful, feel free to like, share, or comment below. And as always: **stay safe and keep calm!**

TOTAL2 - Current Rejection and Following BreakoutRejection is occurring at the red dotted horizontal line which is the prior ATH for TOTAL2.
I think this rejection will be short lived and price will recover at the green circle and continue the bull run into mid Feb
The larger triangle structure shows this breakout
Pullback then bulls take control again

TOTAL2 - Fib and Channel Support0.786 fib shows a strong support point with prices continually being rejected to the bullish side
As price has dumped to this level I ask will this bump back up again as it has in the past?
This dump can also be plotted in with a long channel of the bull run we have been having, showing support at the bottom of the channel.
I'm still bullish over this temporary retrace

A Gentle Reminder Before Things Get Cray CrayPeople are about to go crazy leveraging and borrowing and so on to maximise returns on the coming crypto run. Maybe this chart will help remind you how much time there still is to come, how much potential there is diversified over so many interests, and how long this trend has already been going for. You also need to consider how world politics and other things might influence these outcomes. We don't know. You never know.

Correction of Altcoins and the Crypto MarketConsidering that the total index and the altcoin index have reached a resistance level and are starting to correct, I expect them to correct to the specified level before resuming their upward movement. Given the overall market conditions, I anticipate that altcoin season will begin after Bitcoin reaches $150,000.
What do you think about this analysis and other analyses?
What symbol would you like me to analyze for you?

BTC/EUR. Eyeballing across the €100'000 roofBitcoin robustly pumped to $100,000 and above for the first time on Wednesday, December 4, 2024 surging to a new record after President-elect Donald Trump unveiled administration picks seen as holding the keys to ushering in crypto-friendly policies when he takes office in January.
Chief among the picks is Paul Atkins, whom Trump intends to nominate to lead the Securities and Exchange Commission (SEC), which regulates cryptocurrency.
Atkins, know in social media as a crypto advocate and former SEC commissioner, is expected to regulate cryptocurrency with a lighter touch than Gary Gensler, who leads the commission under the Biden administration. Gensler, who aggressively fought the industry’s expansion in the US, is set to resign on Inauguration Day.
Bitcoin touched $100,000 just hours after Atkins was announced as Trump’s choice for SEC chair.
This is all right with the new milestone (counted in greenback), built on the stunning rally since Trump won the presidency throne on November 6, which fueled a $6,000 one-day spike in bitcoin that brought it to a new record above $74,000. A week later, it hit $90,000.
By the way.. The main technical graph for BTC/EUR COINBASE:BTCEUR says €100'000 milestone has not been passed through yet to this time.
While talks are talking, last exam is not passed yet. Macro data still stoke fears over a possible recession and the notion that the Federal Reserve could be too slow with cutting interest rates. Non-farm payroll added just 12K new places last month.
Fresh labor market data is on the radars on Friday, Dec 06 (+202K non-farm payroll forecasted).
Sure, there is "no guarantee", though.. until last exam is not passed yet.
In case of success only, we can talk about further growth towards 150 thousand euros.

XRP Market Cap Creates New All Time High; Likely to ContinueImpressive. Market cap in November alone has gone on to gain 326%. XRP went from the number 8 spot back up to the number 3 spot with extreme swiftness.

A Look Again At RSI The RSI is beginning to print very bullish horizontal movement that is the print of a bull market
The left hand side of this pattern is already printed, with the white vertical line being the middle of the pattern, now what is emerging is the right hand side of this larger structural pattern on the RSI, also indicative of a bull market.
Early 2025 is going to be very bullish.
Little white circle is where we are now corresponding to the last pattern if they evolve relatively the same.

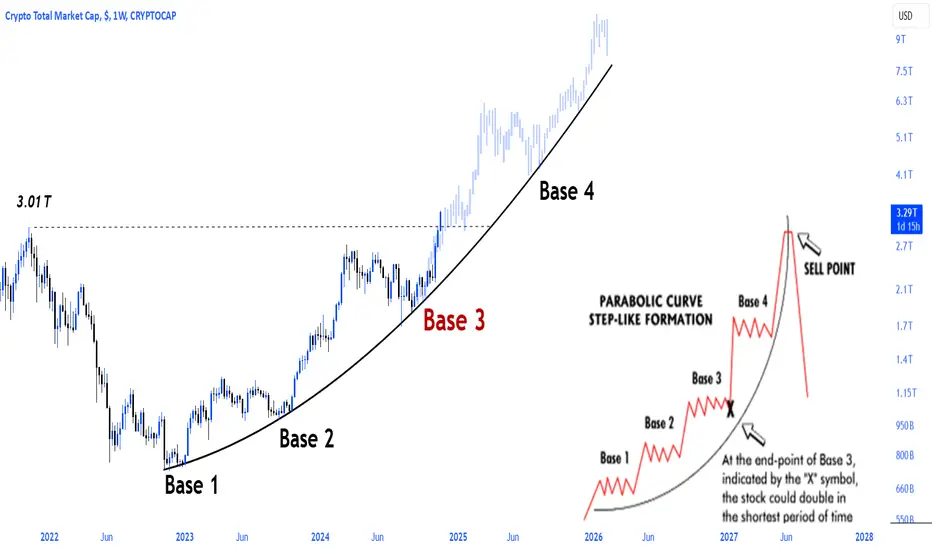
Total market cap is on fireCrypto Total market cap 2021 broke the ATH level (3.01T) and continues to move on the parabolic curve towards the highest levels in history
#Bircoin ⏩ #Ethereum ⏩ #Alts 📈

We're not going down, we're going up nowI'm 100 percent sure we'll go up. For the sake of fashion, I also placed a stop loss, but it is completely pointless at the moment.
Notice the pink bows
Good luck my friends and see you at the top
I'm not swayed by your downtrend opinion

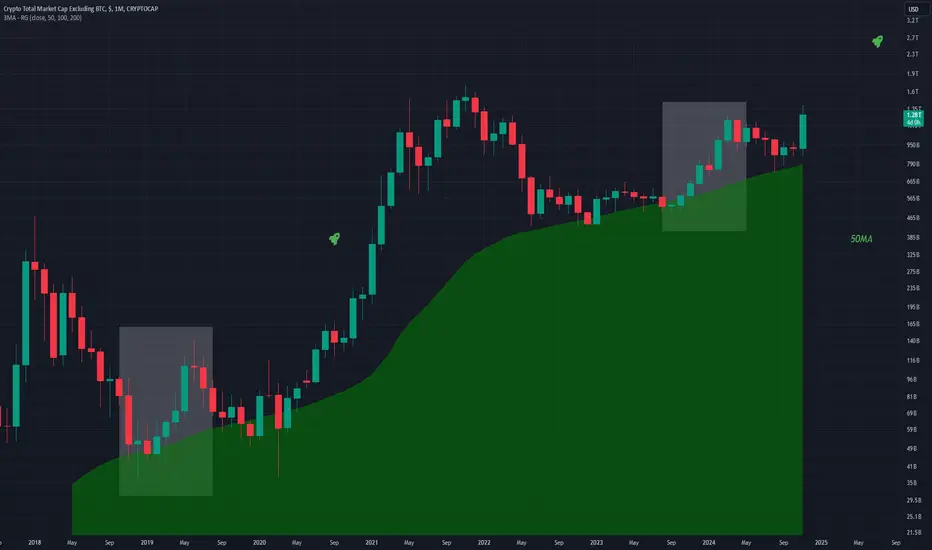
TOTAL2 - Monthly MA Intact Each move in white is the beginning of a bull run, a move that shows strength followed by a short term move back down towards the 50MA.
The MA acts as support and allows the TRUE breakout to be revealed, we will see the bullish action for real in 2025.
What are your thoughts on how high this altcoin chart will go on this Monthly chart?
BTC ATH | Bitcoin Dominance | Alt Season Interesting insights can be gather from the Bitcoin dominance chart and the altcoin chart (TOTAL3).
You can see some interesting patterns when you overlap them, and monitor for previous "fractals" or patterns.
Some of the key insights you can gain from this combo:
👉 The BTC peak / ATH, or not
👉 The end of Altseason
_________________________
COINBASE:BTCUSD CRYPTOCAP:BTC.D CRYPTOCAP:TOTAL3

TOTAL CRYPTO MARKETCAP PREDICTIONjust put a record & prediction. currently it showing a big bull flag and already breakout. lets see where it goes

Total 3 The chart illustrates the total cryptocurrency market cap, excluding Bitcoin and Ethereum, currently consolidating within a descending channel, often recognized as a bullish flag pattern. This pattern emerges after a strong upward movement, suggesting the potential for further gains once the consolidation phase concludes. The market is fluctuating between two red trend lines, which represent the upper and lower boundaries of this flag.
Key levels of support and resistance are highlighted on the chart. The resistance level, around 783 billion USD, has been tested previously but remains unbroken, causing the market to pull back. On the downside, the chart identifies a strong support zone near the 550 billion USD marked in blue. This area has consistently served as a critical support level, making it a pivotal point to monitor for any potential bounce.
The overall sentiment expressed is one of optimism, a massive bull run for altcoins. The ongoing consolidation within the bullish flag is viewed as a temporary phase before a likely breakout to the upside. After a confirmed breakout from the bull flag which could confirm the continuation of the upward trend and potentially signal the beginning of a new altseason. This indicates that the market may be on the verge of a significant move, and traders are advised to monitor these key levels for possible trading opportunities.

USDT.D Flashing BEARISH Signal For Bitcoin and Total Market CapIn this video, I've re-created a study I saw online about USDT.D (USDT Tether Dominance) and how whenever it's dropped to this trendline since 2018/2019.
It's also marked the top of the market in terms of Bitcoin and Total Market Cap.
It obviously makes sense that with money flowing into crypto and Bitcoin, that money would flow out of Tether and stablecoins... But still, this is a very interesting inverse relationship.
This is either one of those charts we'll look back at in hindsight, and think 'Well that was obvious' -- Or we'll see a break of this trendline, because...
Maybe this cycle IS different.
I'll be watching this to see if USDT.D starts rising, and BTC.D starts dropping.
This could spark a mini-alt season in the mean time, which would be great.
But I would be taking profits into resistance levels, if this USDT.D chart looks to be turning up.
What are your thoughts?
Please Like, Leave a Comment, and feel free to Share!
- Brett

Altcoins Hit Major Resistance: What’s Next for TOTAL3? 🚨 Altcoins Hit Major Resistance: What’s Next for TOTAL3? 🚨
📊 Altcoin Season 1st Milestone Reached – But Can We Push Higher? Or a correction is first? 🌟
The Total3 Chart (Altcoin Market Cap Excluding BTC & ETH) has finally reached the long-anticipated 600B–938B range, a critical resistance zone that’s been in focus for over a year. 🚀 After breaking out of a descending channel and delivering strong bullish momentum, altcoins are now at a make-or-break level. Let’s dive into the key areas to watch next! 👇
🔑 Key Insights:
938B Major Resistance: Total3 has climbed steadily to this key level, but it must break and flip this resistance into support to sustain the rally.
Channel Breakout: After months of consolidation within a descending channel, altcoins made a clean escape, sparking a rally to the current resistance.
Potential Scenarios:
1️⃣ If the breakout succeeds, the next bullish target is 1.33T, opening the door for explosive altcoin growth.
2️⃣ A rejection could lead to a retracement back to 600B support, providing fresh entry opportunities for the next leg up.
⚠️ Why This Matters: This is not the time to FOMO! 📉 While the altcoin market has shown incredible strength, the risk of correction remains high unless we see a strong breakout. If this resistance holds, short-term pullbacks could offer better buying opportunities.
Strategy Alert:
Bullish above 938B, targeting 1.33T.
Watching for a rejection to add positions closer to support levels.
📈 What’s Your Play? Let me know in the comments if you’re eyeing any altcoins to ride this potential breakout or waiting for the next dip! Stay tuned for further updates.
One Love,
The FXPROFESSOR 💙

The largest market cap in #Crypto history is being uploaded!#TotalMarketCap continues its parabolic run, leaving behind the critical level of 3.01 trillion dollars, which is the 2021 ATH!
SEND #Alts #Ethereum #Bitcoin 🧲
I bet you are not watching this chart of TOTAL3#ALTSEASON Update🚀
Let’s dive into some detailed alpha!
Take a look at this (Total3-USDT-USDC)/BTC chart. It clearly indicates that #Altcoins could bleed by a maximum of 20% further from current levels in CRYPTOCAP:BTC pairs. However, this doesn’t necessarily mean they’ll lose value in USD terms if #BTC continues to pump, which seems likely in the coming weeks.
Following this, altcoins are expected to start outperforming BTC and will likely peak when this chart reaches around 0.56, with another possible top at 0.91.
PS: The altcoin market is highly fragmented this cycle. Not every altcoin will pump equally or peak at the same time. However, overall, the altcoin market could potentially achieve a top near the 0.91 level, which represents a 3x increase from current levels.

TOTAL2 - Still BullishI am still very bullish on alts, more than I am on BTCUSD.
A divergence is occurring where the RSI on this hourly timeframe is moving downward while price is trending upwards. This is a bull sign.
Alts pumping around the board.

Golden Cross having immediate bullish impact in parabolic cycle The next couple charts I post will simply be to lllustrate how the golden cross (orange line crossing above the blue line) immediately resulted in a very pivotal bullish pump that coincided with a major fulcrum point on the chart recently on multiple different charts. More times than not in the other market cycles, when a golden cross occurs it usually takes a few weeks afterwards to know whether that cross will have its desired outcome or instead end up being a fakeout but lately I’ve noticed multiple charts have seen an instantaneous pump on the exact day of the golden cross, which is making me think that once we enter the 2nd parabolic phase of a bull market that that is when you can anticipate a golden cross to have its immediate intended effect its suppose to have with much much higher probability than all the other market phases including even the 1st half of the bull market. Anyways I wanted to illustrate that hypothesis here with the Total chart as you can clearly see it’s a text book example, and I will try to also include another example where this occurred either in a follow up chart post or below if I can figure out how to get tradingview to let me post images of other charts below without making an entire new post for it. One major reason I want to illustrate this is because within the next 1-2 daily candle closes the Total2 (aka altcoin market) chart is going to have its golden cross and it is currently trying to confirm the breakout upward from a cp and handle pattern which is a huge fulcrum point for it. SO should the trend of instantaneous golden cross pump effects occurring the same daily candle as the cross itself, this could clue us into exactly when the real full on alt season will be about to kick off (which if correct, wll ignited by a BG pump within the next 1-3 daily candles). I will link the impending total2 golden cross chart below for you to reference and keep a eye on. *not financial advice*

Price action on the TOTAL chart now comfortably above the c&h Price action is now knocking on the door of 3 trillion for the total crypto market cap. We can see also that now that price action is reasonably above the rimline of this massive cup and handle pattern, and has also closed a weekly candle above it now as well, that we are likely to soon validate the breakout of this pattern and star climbing towards its breakout target of 4.6 trillion. I think Brad Garlinghouse was anticipating the total market cap nearing 5 trillion by end of 2024 and that target is not that far off. I will link some previous total market cap charts below so you can see other macro patterns we are also heading towards with an even higher target than this cup and handle. *Not financial advice*
