CITRON is giving a GREAT LONG opportunity with $GMBLCitron following intraday trading strategy idea
Esports Entertainment Group, Inc. operates as an online gambling company in Canada.
The share price is rising and gonna continue this trend today after the new Citron report publishing.
The demand for shares of the company still looks higher than the supply.
These and other conditions can cause a rise in the share price today.
So I opened a long position from $21,5;
take-profit — $28,00/MOC price;
stop-loss — 19,50.
Do not view this idea as a recommendation for trading or investing. It is published only to introduce my own vision.
Always do your own analysis before making deals. When you use any materials, do not rely on blind trust.
You should remember that isolated deals do not give systematic profit, so trade/invest using a developed strategy.
If you like my content, you can subscribe to the news and receive my fresh ideas.
Thanks for being with me!
Tothemoon

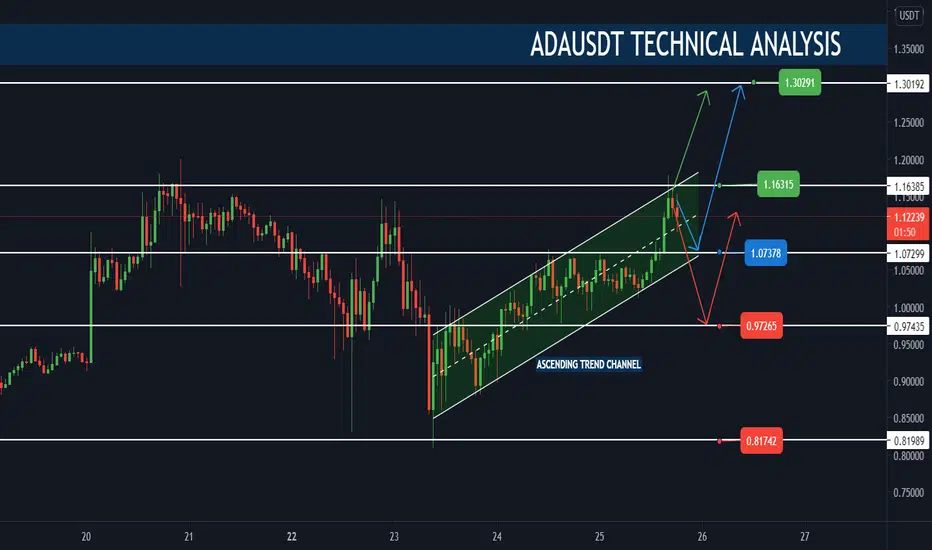
ADAUSDT | Cardano is about to explode!Hello, traders!
Cardano touched the ATH today and bounced off it. What is the next for ADA? Let's go!
Technical analysis demonstrates that the price now is in ascending trend channel which started yesterday at the Bitcoin dip time. We can see the range with three significant support levels. Corresponding to this there are three possible scenarios.
"Green": the price will break through ATH and quickly reaches the $1.30 (weekly R1 pivot) level. It has low probability but possible.
"Blue": The price will go to the lower band ($1.07) of the channel and bounce off it to the upside. In my opinion this is the most possible scenario in case if the BTC re-test the $47000 level.
"Red": This scenario could play out in case of BTC retest $45000.
Can the Cardano go to the $0.81? Yes, but it is the least likely because if you look at the ADABTC technical analysis chart below it can be seen that the Cardano outperformes Bitcoin now. It broke through the R1 weekly pivot and if it is able to find support above it, the ADA can grow faster than the BTC.
DISCLAMER: Information is provided only for educational purposes. Do your own study before taking any actions or decisions.
Bullish Cable GU BUYS before breakout to 1.43 for the week.
OANDA:GBPUSD
no indicators no moving averages no pattern no retail
only price action and wykoff re accumulation confirmations
expect cable to breaks out resistance. expect a retest after break out for some distribution cycles before re distribution www.tradingview.com

BTCUSD MAR80000CI have titled this piece the BTCUSD MAR80000C.
Some say they can see a painting of a bull when turned upside-down.
This is my bare minimum price target for which I will trim 1/3 of my position. Maybe.

ADA (CARDANO)Hi guys.
buy some cardano now if you cant invest much just buy 50$ , do it now before moon.

GRIFOLS: Results day coming on Feb 26. Then to the moon?68.2% of GRIFOLS revenues come from the US and Canada. Covid19 cases there seem to be decreasing. The company is delaying more and more its deadline of results for the phase III of the inmunoglobulina antiCovid-19, now until spring 2021.
If GRLS results are positive or better than expected (specially Q4 ones), I expect a jump from 21.61 to 26 in a matter of 2 weeks. The 2020 annual earnings are due on February 26. Grifols has a key support on 21.61 and then a structural support on 20.77. This week we'll see how it goes but as soon as it touches 21.61 is already a buy in my opinion and hold until Feb 26. Then depending on the results, sell or hold until its price objective recommendations which are around 30€.
Note: RSI-14 is also below 30, so we might expect a change of trend sooner than later.
Good luck traders and long-term investors!

XRP To 1.0$ ?XRP is looking good for a big Bulish trend, If we broke 0.98402 we can expect big move up over 1.0$

BTC Next Global Target!Let's take a look at the Bitcoin price action history since 2017. We can notice that the price formed the important Fibonacci levels with the swing high of 2017 ATH and swing low from the beginning of the 2019.
When the price correction occur in January 2021 it found strong support exactly at 1.68 Fib level ($30000). This was the sign of the current bull rally continuation. Now the price broke through the 2.61 Fib level ($46000). The next target is the 3.61 Fib level ($64500). In case of the new price correction if the price find support at the $46000 the bull run continue with high probability. As a result the possible zone of the further price action is a green box.
This is global analysis. We will do more precise analysis next time.
DISCLAMER: Information is provided only for educational purposes. Do your own study before taking any actions or decisions.

Secret Doge moon map route Picture says it all !
Don’t ask why
Plain simple
*im not a financial advisor

ADA/CARDANO TO THE MOONAfter a huge impulse bullish phase around Feb 10, the bears tried tracing Cardono back down to its previous price but were unable to, forming a very good looking Heads and Shoulders pattern and a near-perfect right-angled triangle signaling a possible breakout of zone 1 soon. As usual, I'll be waiting for a confirmation candle close at my yellow rectangle box before acting on anything.

ANTM ready for breakout to FLY TO THE MOONNickel price up
Ev battery demand high
Commodities all flying like crazy
ANTM TO THE MOON

Coin Citadel CCTL Projections This is an update of a chart I previously did on 02/17/21. As we see the pattern has held the "future supports" I had mapped out and should continue into my target zone. Once we break the previous ATH we will higher growth and I will continue to post on this stock.
Please like and follow!
Thanks


BTC go to 60k before crash ?It seems that this prediction seems realistic regarding Eliot waves and Fibo extension. 60k could be a critical point.
Let's see if Mcafee will keeps its nuts 😜

45% swing incomingIf there is not a trend break for NIO in the next few days, this thing will likely have a massive run-up to 80$. CCIV or Lucid is currently trading at around 57$, making Lucid a 57*1,2 = 68,4 billion dollar company, as a direct competitor to NIO. However, NIO is far ahead, and their vehicle deliveries might hit 100k this year. NIO's current evaluation is LOW compared to Lucid, whom will likely go even higher on a 100% confirmed merger deal. NIO is in the background becoming more and more attractive as a swing trade or just a great entry for long-term holds. Keep this high on your watchlists!

for me vib is definitely lookinG ReAdY for shootinG up !! Since some time we saw VIB making like 500% gains ,,, it's an awesome promessing project but for me as shown on the chart it's a 100% pump coin that could do an astronomical terrifying GainS !!
-->Next BiG target is around the 378-398 SATs Guys ,, you can buy a little bag (maximum 10%-15% of your capital) to expect like 150% tastY Gains
PS : midterm Trade ,,, So be a little patient guys ,,, and whatever happening with the big DAD (BTC) VIB will smash those 378-403 potential targets
PS : Am not your financial adviser those are MY OWN PERSONAL THOUGHTS ,,, I Just Love sharing with you guys my PERSONAL TRADES
PS : Do not but badly Greedy !!! (this is golden advice)

$ZOM Chart patterns. Potential breakoutThis is my prediction of the next uptrend towards Truforma's launch date. The first device from Zomedica.
$ZOM is currently in an aggressive upward trend and is likely to continue in this trend. Why? Because you can see in the chart above that $ZOM is currently in its next consolidation just like it was in January.
During the making of this post the price has fallen below the resistance. This was also the case in January, but it was immediately corrected the next day (false outbreak).
Also the RSI also reveals the new uptrends.
Ultimately, I think the idea is that $ZOM will go to $8 and stay there in the next consolidation until they make revenue for the first time.
I know that a stock price of $8 entails a huge market cap. But because of the hype of Truforma investors first condone that.
I would like to hear feedback from you guys and what you think will happen to the stock in the near future!

i do beleive that lit will get to the 19.70 to 21busd price taG I do believe that lit will get to the 19.70 busd price tag within 1-2 weeks ,,, very bullish in that particular sturdy project ,,, keep an Eye on that project guy I see a 41-53% tradinG opportunity !!


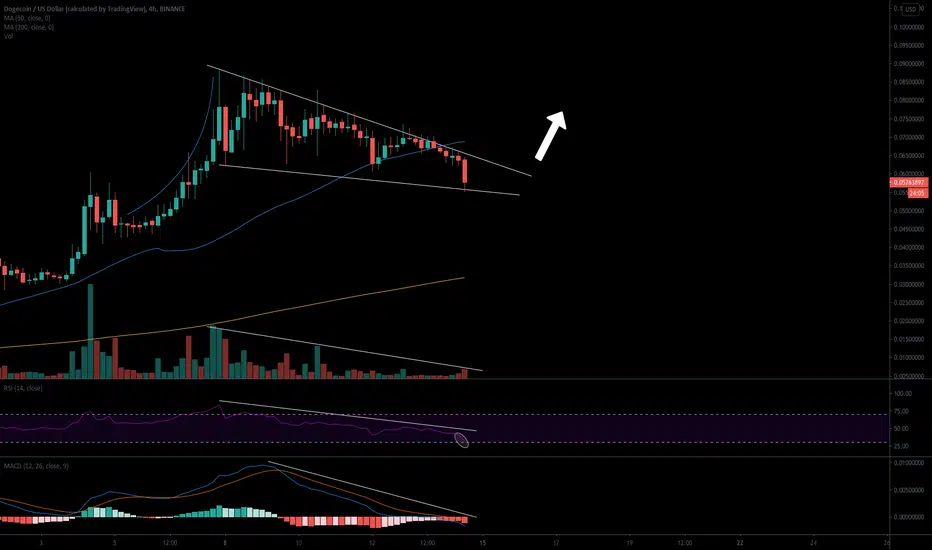
DOGE to the Moon in the next 2 days! Falling Wedge on the 4H!Very bullish indicators all over the 4 hour BITTREX:DOGEUSD chart. First of all, MACD, RSI, volume, and DOGE are all moving declining in unison. RSI is a rock bottom low levels.
There is a falling wedge forming that gives DOGE the technical catalyst to launch to new all-time highs when it reaches the apex. I expect all the cyrptos to have a break-out week as even Ethereum is beginning to get attention from institutional investors.
link is ready to visite the little baby mOn at 45,27 busdlink is ready to visite the little baby mOn at 45,27 busd
looking forward that tastly priCe TaG to JUST Open a beer and sel 5-7% of my personnal BAG
,,,,, be ready guys to party with ME ^^

Top altcoins making x100 movesAll my positions are tagged with red and analyzed daily. Good buy options in my opinion are tagged yellow and the ones I still haven't looked into enough are tagged green.

Altcoins Boom! Let's Take a Closer Look!Altcoins gain 80% in value over just two weeks! Let’s take a closer look at the situation.
The Rally Begins
Over the past six months, Bitcoin has been doing incredibly well, continuously making higher highs and showing consistent growth. However, the same cannot be said for most altcoins. With a few exceptions, most altcoins did not move nearly as much and were mostly consolidating. However, beginning January 28th, the altcoin season began, with the Midcap Index growing by 80% in just two weeks. The Midcap Index consists of 23 mid-cap coins, so it’s safe to say that it accurately represents mid-cap coins.
Trend Direction: The MACD on the daily chart works well as a strategy for BTC. It appears that it also tends to work on the Midcap Index. If you had used it as a strategy since the index’s creation and took only long trades, you could have made a 184% return, which is not excellent considering that the buy and hold would yield 326%. Even when adding the 56% open P/L, you would still only have 230%. Therefore it is better used to identify the trend direction rather than to trade signals off it.
Who is Taking the Lead?
DeFi tokens have been some of the best-performing assets in this bull run. The DeFi index grew 300% in 2021 alone! Other coins related to DeFi, such as LINK and ETH, have also been doing well.
Apart from DeFi, exchange coins have been booming as well. BNB and FTT this year grew by 220% and 270% respectively. OKB also reached a new all-time high.
