You're in luck! The market is pulling back but $ABCE will MOON! Looking juicy! 💦
ABCO Energy, Inc. is a commercial and residential installer of Photo Voltaic (PV) solar systems, LED lighting solutions and financing for all of these energy saving products. ABCO Energy, Inc. is a Nevada corporation, doing business as 'ABCO Solar' which maintains offices located in Tucson, Arizona. In 2020 ABCO added energy efficient HVAC business.
not trading advice
Tothemoon

The Party Isn't Over!! $SNDL to the MOON!!! Cannabis Boom!Yessum! The party isn't over, we can still dance! Weak hands will sell but strong ones will HODL for years and reap the benefits!!
Not trading advice!


TSLA's doing it again. Don't be fooled. 1:5 Risk-Reward Trade.I'm expecting a great 2021 for TSLA overall, regardless of what investors and traders decide. I've drawn a premature triangle representing the region between two levels which I believe are crucial support and likely resistance for the next month and a half. The resistance I based on multiple different Fibonacci extensions drawn out from multiple swings. The support is crucial, not because I believe firmly that it will not break. Rather, it is crucial for this moon move. If we are going to the moon in March, then this support should not break. That is my thesis.
I've also drawn out some key levels from previous charts.
Bear in mind that this triangle matures once we have hit and reversed off of its top and bottom sides at least three times in total. So until now, the trade is not confirmed. However, if you're already long TSLA from my previous posts, then the stop loss should remain as it was at $722.9. This makes the potential loss about 9%. The target is the height of the triangle, supposing the triangle will mature and then break to the upside. That's a target of $1270, a 49% potential profit. Of course the moon is much higher than $1270. That's why I call it an initial target. The achievable moon for the year 2021 is at $2400 as I imagine it.
Either way, let's observe and I will keep updating this idea as exciting TSLA price action unfolds.

Bitcoin Technical Analysis. New Target!Hello, guys!
Yestergay was a huge pump because of 1.5 billion investment in Bitcoin by Tesla. Now it has a great fundamentals to grow.
The price formed the ascending trend channel which was broken 10 hours ago. The was a huge growth and now there are difficulties to break through the R2 pivot ($48000). If the price is able to find support above it, the next target is R3 ($54000). If the rejection is the case and price is able to find support on the trend channel's upper band it is also the great sign of small reaccumulation before the growth continuation.
DISCLAMER: Information is provided only for educational purposes. Do your own study before taking any actions or decisions.

EOS is a great ROI in next mounthesTake as much EOS as you can, it is the best technological BlochChain in the world...

bnb ^_^ ^_^ ^_^ bnb ^_^ ^_^ ^_^ bnb is going to 1000$ late this summer i challenGe dooooo nooooooooot sellll you bnb's !!!!!!! Do not even it will correct !!!!!!
it's a BiG mistake guys !!!!

ZOM Next Price Target $3.5?The trend is strong with this one, but so is the hype. Even rocket ships need to refuel. A slight, healthy correction may be due. OR maybe not.


Doge double top turned doge cup and handle?Could be the makings of a cup and handle here at the 15 if things keep the way they're going. Good time to buy in now if so. If it's a cup and handle then we can expect another day of crazy trading.

1st BTC Target met, others looking to reach shortlyHello Traders!
Just a little update to include the recent rally in BTC...
So far, BTC has been moving as expected by breaking its ATH (again). Our 1st Target of 43060 has been MET within 24 hours of posting entries! I hope those following my TA enjoyed those profits made. I will be continuing to hold until 2nd target and no doubt will be leaving some of my position in to run as I am expecting overperformance of target 2.
The Correction Channel that we originally broke from is basically picture perfect for my trading system, which is adding to the increased bullish bias of overperformance. This, coupled with the 1st Nested MM reaching target without breaking the setup increased the probability of success.
While we did not get an additional entry in the 2nd Nested Move, we can feel good that this ALSO adds to the very bullish sentiment. I am expecting to see 60k BTC within a few days.
Stay tuned/Follow me for more content and potential trading setups that YOU can profit from.
Happy Trading, keep that risk managed.

ALL PUMP. NO DUMP.They said doge was a pump and dump!?😂 We can’t even hear those people way up here.

Dogecoin bullish trendAround 04:00 (GMT) it broke through Resistance 1, we see a small retracement and now the uptrend is headed for Resistance #. If it breaks through we will probably see a small retracement. After bouncing on Support # (Resistance #) we will have no gravity and we will go to the FCKING MOON!!!!!!!

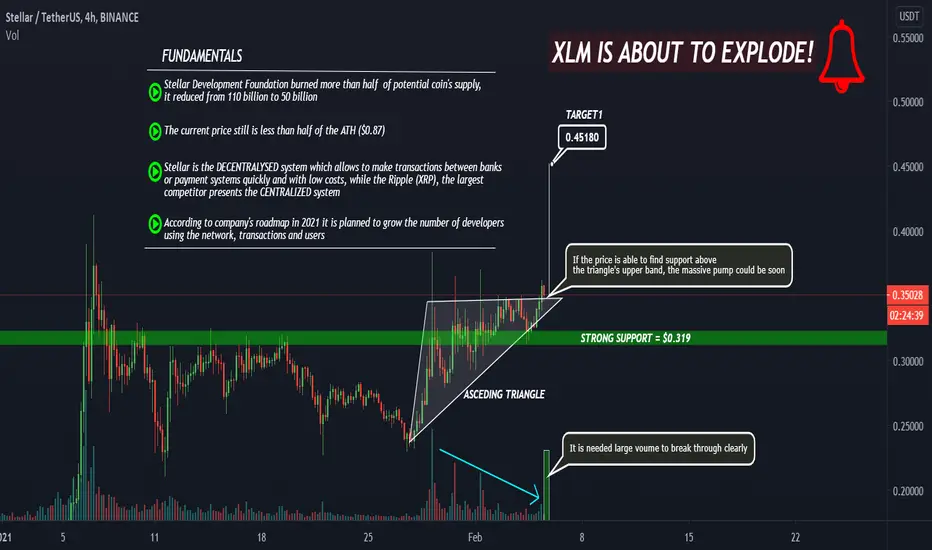
Stellar (XLM) Can Explode Soon! TA + FundamentalsHello, guys!
Let's take a look at the very perspective altcoin which can give nice growth in 2021.
Stellar is the DECENTRALYSED system which allows to make transactions between banks
or payment systems quickly and with low costs. Thus, it has the great fundamentals to explode in this year. You can see these fundamentals on the chart.
As for TA the price formed the ascending triangle. If now the price is able to find support above it's upper band the first potential target is $0.45, but we need a large volume to do this. In every case the $0.319 looks like a very strong support.
DISCLAMER: Information is provided only for educational purposes. Do your own study before taking any actions or decisions.
AMC buys, expecting HIGH impact from wallstreetbets Tp 50$So far AMC has shown a crazy journey, but don't expect the end soon since this is only the beginning.
I'm considering AMC to go till 50$.

EUR/AUD "W" pattern completed. Good Day Traders !!! On this pair we have a market correcting on the M timeframe as well as the W timeframe. On the daily we can clearly see an overextended "W" pattern being completed and we are ready for an impulse to the upside. The target is the 50% FIB retracement taken on the weekly impulse and that aligns perfectly with the next weekly resistance. From a COT perspective we have a strong Eur overall and we do expect this move to complete the Weekly pattern and the impulse correction continuation that we can see on the Daily timeframe.
Now if you enjoyed this analysis please like and share, If you have a different opinion you can comment below as I would love to get more insights about this pair.
Trade safe !!!

possible bullish outbreak for dogecoinStoch indicates a possible bullish trend. might be a fake outbreak, we will see. Let's get this motherfcker to the moon!!!!!!!!

Feeling goodHi!
I expect this coin, which I have been watching for a long time, to increase approximately 2.5 times in 2 months once the correction from the hanging man pattern is complete.
It's my opinion, not an advice for you. If you have any other ideas please share with me.

Levels to keep an eye on! As DOGE goes into uptrend.My previous rule was in play for the downtrend line it recently broke upwards through, so it's no longer in play, but it still can give some resistance.
The resistance levels to look for during its climb will be approximately be (the MA numbers will change as the price moves):
50 day moving avg $0.0352
61.8% fib $0.0373
100 day moving avg $0.0380
Then it would climb up to $0.0469 which is the 50% fib of the entire rally, and past that... it would go to the moon :)


40k$ is not the high! (Bitcoin's historical growth curve)Hello traders, or this time investors,
here is my long term log Bitcoin chart with historical data.
Because of this growth curve and the fact that we "only" made
1.400% so far, since the last low at 3.000$, I believe that we can
still expect much higher price for Bitcoin this year.
But as you know it's not only about the price.
Wish you all a nice weekend.
Greetings
Jens

Flick The Chart ! Ethereum & Bitcoin After yesterday's crazy 900% gain for dogecoin? Why hasn't Etherum & Btc Moon yet? Well get ready folks, I predict the next few weeks are going to be a rocky ride, so flick the chart. Their reason is no valid reason why BTC isn't at $60000 or Etherum at least $15000 yes $15000 for Etherum. These two coins just proved to the world how powerful they really are to the world when RobinHood Halted Trading because, on Wall Street Bets, we all witnessed who really manipulates the markets.
Get ready because these same hedge funds that lost money are going to be pulling out all the stops in the next few weeks in an attempt to short bitcoin . But Bitcoin and Etherum are going to the moon.
Just my 2 cents :)
