#BTCUSD #BITCOIN $BTC Elliott Wave Weekly Buy Setup.This count is based on my assumptions so anything can happen not a trading or financial advice just for educational purposes only kindly do your own ta thanks trade with care good luck.
Tothemoon


XRP LONG POSITION!!📉Well after the recent dump, the Support level that's actually so strong has held the price above it not a much but not from breaking it. Therefore if there's to be a pump I have market the entry point at around 0.3500 which is compromisingly safe and also profitable.
Long Position Trade :
Entry Point - 0.3500
Take Profit -
Stop Loss - 0.3430 (Yes it's a pretty tight stop loss, because we dont know if that small pump actually a fake, that will reverse by going down)
⚠️NOT A FINANCIAL ADVICE

don't desperate is going up againBitcoin is going up, not down, this is a trend, the problem is that is taking the time to go up and down to consolidate the price
SOLANA PUMP!!🚀🚀HODL!⚠️Solana has formed a ascending wedge triangle, which basically means bullish , breaking upwards. This pump would probably start around 22nd Aug or else on 24th Aug, HODL it for the PUMP!⚠️🚀
If you want to follow this trend :
Entry Point - 48
Take Profit - 57 for safer Exit or else 60
Stop Loss - 42.3
Wish You a Happy Tradinng!!✨🚀🚀
⚠️Not a Financial Advice, Just a Idea on the current market and ongoing Trend


XRP PUMP!! HODL!So, as u can see the chart has formed a ascending wedge pattern which is actually a bullish sign and the pump would go max up to 0.4600 , but would recommend to exit at 0.4500 for a safer trade.
Here's the long position details :
⭐Entry - 0.3950
⭐Take Profit - 0.4500
⭐Stop Loss - 0.3522
Wish You a Happy Trading!🚀🚀🚀
⚠️Not a Financial Advice, but a idea of the current market trend and more like a analysis.

BTC PUMP UP IN 2 DAYS TYM, HODl IT!!!With the recent pump and consolidation, the chart's been forming a ascending triangle that represents Bullish sign! also it forms in a uptrend so its a strong confirmation. HODL ur Bitcoin's and the pump is in 2 days!!...The PUMP will happen soon by 18th of Aug.
ENTRY POINT - 24300 (USD/USDT)
EXIT AT - 28500 (USD/USDT)
PROFIT PERCENTAGE - 17% (SAFE LEVEL) IF YOU WANT TO RISK A BIT, EXIT AT - 29000 (USD/USDT)
GOOD LUCK WITH YOUR TRADE! BYBIT:BTCUSDT 🚀🚀🚀

Audio to the moon?Audio,s fund is good.Price in a tr and a bullish trend linen is under it.Valume has a bearish divergence. If breaked with a candle has shadow under candle.
Thank you for follow,boost and comment.

Chainlink continues bearish trend $3.96-$4.20 possible future for Chainlink if support can't hold on second pump to $7.50 area. Long outlook possible retest $9 if this holds pump to $12.

looking the balance with Yinn after a yang yearThis ETF, is starting a bull trend, you just have tu buy and wait for more than 100%

don't cry ladiesok, stop crying, the uptrend is there, today $AMC just covered a gap, tomorrow should be green

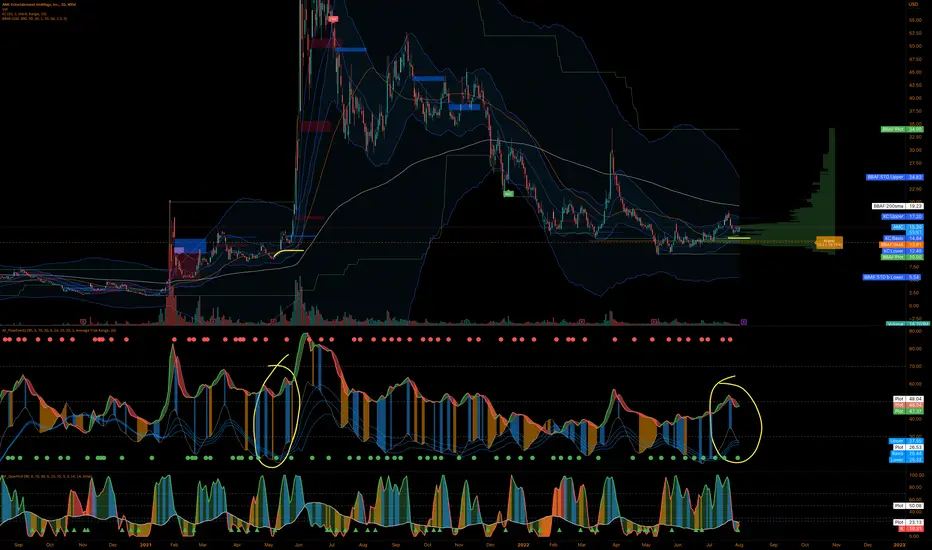
$50 is possibleWell, let me tell you what is going to happen, $AMC is going to $50, the dividend $APE share announcement will make this going to ths starts for the same people that was stopping it just because if this doesn't happen before August 19 the will have to pay to all the synthetic shares the dividend. They will send this high to see a lot of people selling and getting out.
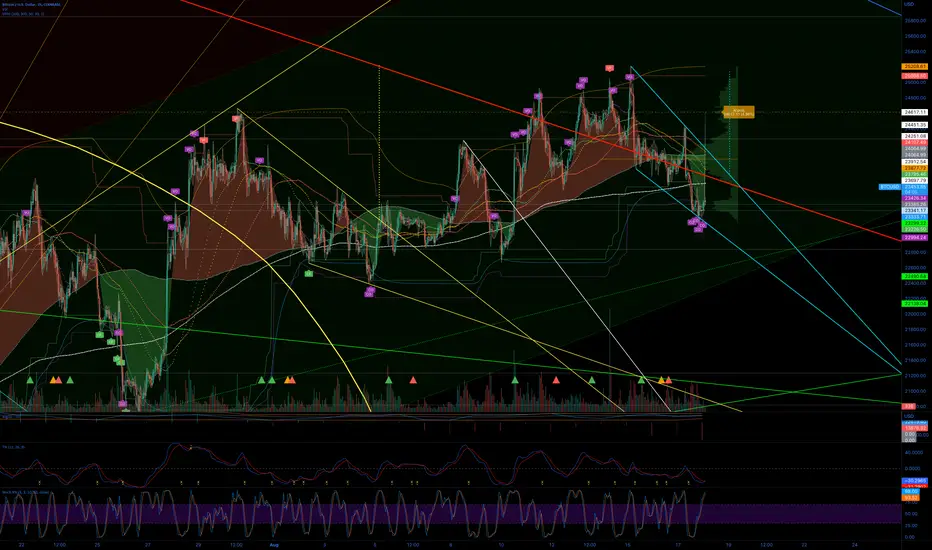
BTC - The Upcoming Move that Will Surprise Most Everyone?!? I’m just gonna leave this here. What you’re looking at is a bar pattern copy of a previous move bitcoin has made overlaid onto the current chart - One that just so happens to align nearly perfectly with the Fibonacci levels, from the last daily swing low, to the hypothetically soon-coming swing hight, which would put the upcoming 0.382 at around $23,421, the golden pocket $27,000-$27,500 range, the 0.786 at around $29,585 and the 1.0 at $32,850, peaking there, sometime around August 15th to August 18th.
Let me know what y’all think.
***I’m not a Financial advisor nothing I said is financial advice and you shouldn’t buy or sell anything just because I discussed it in this post. You, and you alone are responsible for your financial decisions and risk management.


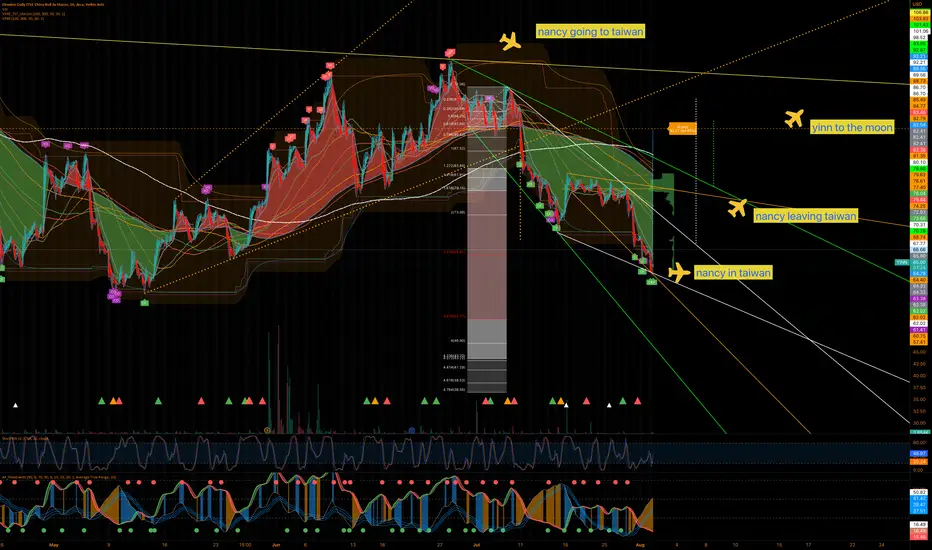
is time for the balance of the forces yin yangi have been tracking this activity and now switching to $YINN, something good is coming guys.

To the moon?Maybe it's the time, everything looks like the last time that we see the squeeze. #tothmoon
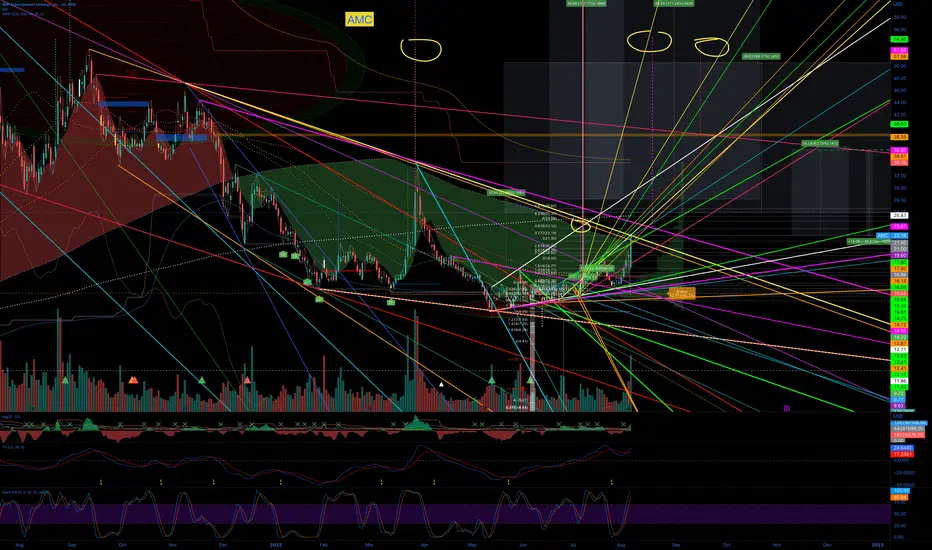
APECOIN OpportunityWe can see that APE is on a strong upward trajectory out of a recent consolidation that was put in from mid-June to mid-July. I am looking for this uptrend to continue using the support of that consolidation at least over the next 10 days and have a target of approximately $9.50. I will leave it up to you as to where you want to leave your stops and where to take profit. So far, the trend is intact. I will look forward to seeing how this idea plays out. I believe the demand for APE is inherent as the developers of the Bored Ape Yacht Club have created an incredible ecosystem. FTX:APEUSD


at least 30% with this ETFChina stuff is cheap today with all the rumors, but the true is that alibaba is the king of the ecommerce, so you will se a nice rebound in this ETF

mark my words$SBUX is going to cover the GAP at the $90s level, refused to go back, and still going forward

Iron ore miners to Bull hard Hey guys,
Good time to load up on iron ore miners who have been sold off recently but i dont see prices falling below that major long term support line it has bounced off.
This chart is part of my thesis on the Inflation cycle to calm down over the next few months but as commodities like iron ore, copper, Oil etc start to bull again as people still have cash at hand to deploy as prices come back down. The Bullwhip effect has certainly started with retailers increasing stock by +25% while sales Revenue only increases by 3% something that confirms prices have started to fall but Major support being hit here and in other commodity showing people are back to buying and the commodities will lead the way back up starting the next wave of inflation that will hit a higher peak then current levels.
