AUDCHF 4HR TIMEFRAME Market Structure: BULLISH
I am looking for buy setups on the 4hr for AUDCHF.
Ascending Channel pattern is happening on the 4HR chart. Since market structure is bullish I'm looking for Buy setups. This looks like it may take a while until structure fully breaks towards the upside.
However, if it breaks towards the downside of the Ascending Channel, I'm looking for a rejection, and a sell candle closing under the pink line.
TPS Are labeled on the blue lines.
Always place SL under where price broke structure.
REMINDER: Always take profit/partial profit at TP1. Price majority of the time rejects after TP1, goes toward entry, then back to smashing the TPS.
TP-SL

BreakOut | GBPUSD | Bullish| NOT FULL CONFIMEDHey everyone,
Before the full confirmation for the breakout, we will see a big candelstick with big volume,
so it so important to trade with TP and SL,
we will keep watching the pair, and analyse it's movement, until we get the full confirmation if it doe's,
enjoy it,

Analysis DXY for XXXUSD pairsSince it did not retest the GAP below, it looks like it will continue to go to the neckline of the Head & Shoulder and then shoot down to the gap. However it is making LH from the retest neckline

Is GOOGL/Alphabet going to bull??I believe we have a good entry point after the pullback with considering the next resistance line as TP.

Long position on MSFT/MicrosoftThe price has made a head and shoulders chart pattern, every line is a big resistance and after breaking through every line if we see a pullback to the line it might consider as a good entry point with considering the next line as TP .
FALLING WEDGE IN EURNZDHello my fellow traders, hope you all are making some profits. We are here with our new analysis so that we can increase those profits for you. Let’s get into the analysis.
As we can see that the pair started falling down after hitting the resistance line in a falling wedge. One can take a sell call.
Let us know your views on this in the comment section. Thank you all.
There is good news for our followers. We will be analyzing demand. So let us know which pair you want our analysis on and we will get it for you. Do like and follow us
Ryan.R.Lopes

So what?In order to classical view we have triangles which show increase of price and in wave analysis the exponential channel is obvious shows that we can see the big 5th motive wave.


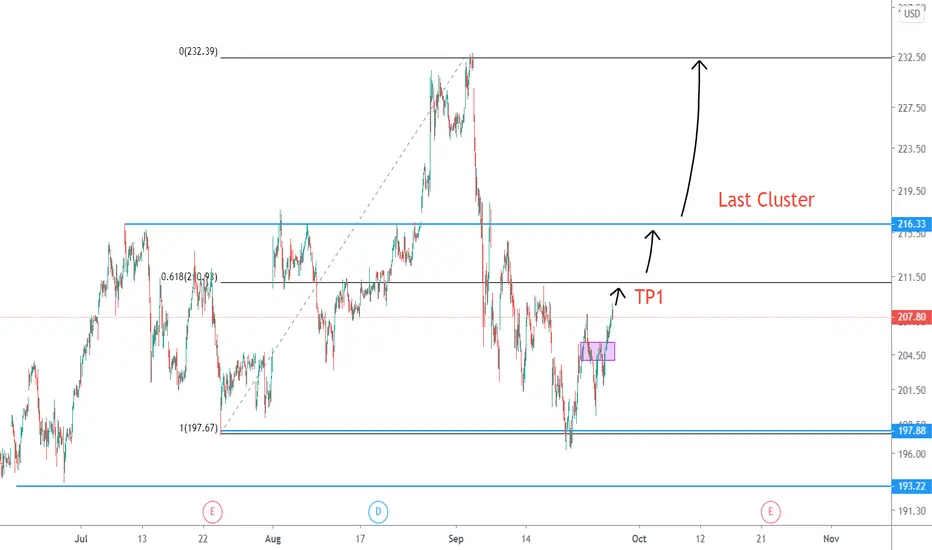
Trade the Fibonacci BounceUSDCAD was not able to break through the 61.8 fib level.
A possible trade on this setup is to open 2 small positions, both with the SL above the test of the 61.8 fib level. TP1 at the 50 fib level and TP2 at the support level showed in the graph. If TP1 is hit, move SL on the remaining positon to entry level.
If you have any questions or feedback on this analysis, feel free to share!
Happy Trading!


USDJPY Long IdeaDouble top forming
Upside break of channel looks like good entry depending on candles


uk100 FTSE bullishprice way below 50 ema. Price has been rejected from 6928 level a couple times with bullish jumps. Smaller time frames showing bullish momentum. Time to start buying to the weekly high. Stoch oversold.

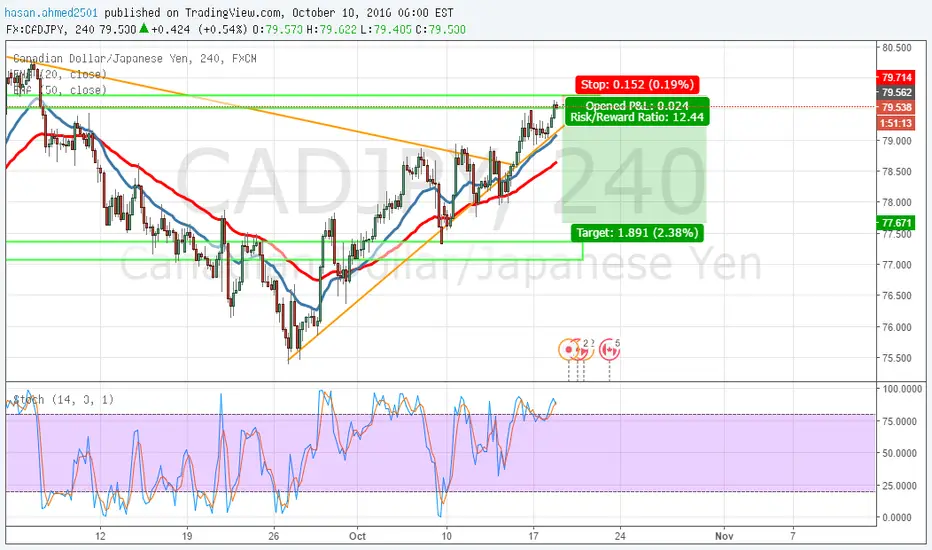
sell cadjpy nice reversal reversal in progress at 79.50 level from daily resistance way above price, price overbought, EMA and stoch all confirm my decision.
EUR AUD on the rise i think. WEEKLY FRAMEWell, strong up trend has been continuing for some time met with some overbuying resulting some downtrend lately. This weeks inverted hammer candle shows a bullish reversal along with the 1.480 level of resistance shows bullish jumps with past price analysis shown with the green rectangle. Price has touched the 20 EMA (red) line and is just below the 50 EMA too (blue)

SHORT EURCHF 1 HOUR Support and resistance self explanatory, price way above EMA's majorly overbought also so time for price to stablise and consolidate back to normal

SHORT the DAX at 10250 using a pending order.FX:GER30
Short the dax when it reaches the 10250 Highs, profiting on the back on the support level when it drops down again. Only a matter of time when it corrects itself. The stochastic shows alot of choppiness so this bullish wave will come to an end soon.


USD/TRY D1 Perspective I had a request from a friend to analyze USD/TRY:
On daily perspective I saw a nice classical Elliot Wave with double zigzag till point E correction waves.
Before starting the analyze I want you to eliminate the harmonic pattern that I draw there; First we start with trends and the potential of opening trade. PA (Price Action) creates trend and trends give us opportunity to open a position trade by its steep. On S2 line we had 2 potential of Buy and why we do not Sell on R1.2 is because of its upward steep and we will never Sell on upward trend and never do amateurish scalping and we do not close our deal until either S2 breaks or we see a PA TP Signal which we had it on the top and Also a good Sell Signal at the same time.
Remember as a good trader how we open Sell Position is not when ever we see double top just sell on it. Even though we have seen a bearish PA on the top we still should wait ti S 1.1 trend to break and then we can open Sell position with SL of above R 1 + Spread. Since price follows our expectation we will sell any time if price touches the R1.1 with SL of above it. (Remember you must first observe that does the price are going to touch and pull back or it will breaks the trend. You never Sell if your trend is broke out. You follow the price till you reach the Future Expected Price A (FEPA) and if price does not change direction; you will follow the same strategy till you reach FEPB. (If R 1.1 dose not break).
Since we have S 2 Trend line seems to be stronger than R1.1 you also can expect an uptrend around that area. If we see S 2 Breaks R 1.1 we get ready to see a harmonic pattern in future.
Our expected Patterns and Elliot are not our signal, it's just a map and idea that we can look at them some time. We trade based on your best friend (trend) and PA.
Any time if the harmonic pattern is completed you can expect for a bullish movement.
Remember you will close all the sell position if R 1.1 breaks and will not open any position till you reach on 1 safe trend. Hold is also an option.
FEP are found by Orbits strategy that I have explained in many of my previous perspective. If you are new to it please read my previous analysis and if still you have problem with it feel free and email me at farsi.masoud@gmail.com

GBP/USD Daily PrespectivePatterns can be failed very unexpectedly.
Patient is the key of success. Open your trad on a strong trend.
Later I will explain about how to adjust SL and TP.
I will also explain how to get reversal signal and have more confidence on your decision.
It's all about Risk to Rewards. Get yourself mentally ready and deal for long term instead of amateurish scalping.
Email me if you have any question: farsi.masoud@gmail.com
