ES - Channel Surfing 2hr - NQ YM RTY SOXS TQQQ TLT ZN ZB ARKKFriday's WRR was symptomatic of how the Order Book and Market @ depth can be
rung like a Bell - Every stop was smoked.
We held 493s @ 12 after peeling off the same ahead of Thursday. A solid and comfortable
buffer of 8 Handles giving us a 501 B/E - Stop was 96, the reaction level and prior PO.
Wrecked in minutes, All positions took the poker, hot.
NQ was the leader into Thursday close, making a lower low on the Hourly, while finishing
Friday @ new ATHs. The only trade taken in NQ was the initial higher high @ 428 to 390 on
80 MNQ scaled in from 426. This Sell became the fuel for the next stop run higher. Retail
Traders entered and reentered the Sell all day only to be crushed under the Futures bid.
The Semis bid took SOXS to new lows, ending our position on Stop - our largest loser in
17 months.
TQQQ stopped .38 below entry. TLT ZN ZB closed @ 0.12%+ ARKK Stopped at ~ Entry and on
and on it goes... stop stop stop run. 1st losing day in 17 days and a large loss on SMH's.
______________________________________________________________________________
ES Chart illustrates the higher targets - and lower 4441/4444 Support - 80 Handle range.
What it does not show is the following - Market on Close orders were followed on in
Globex - the Sell imbalances... were immense.
Perhaps those in the know, knew the Drone Strike retaliation was on Deck.
It is clear we are in a Large topping process, with stop run after stop run the tool in trade.
Where this terminates now is a WAG.
The very moment everything lines up in a large SELL, the rescue operation doubles down
and makes New ATHs on expanding divergences.
Frustrating in the extreme as it requires very large drawdowns, unacceptable drawdowns
on Capital.
Hedging DEC SELLs with SEP Bids Intra-Day has worked, although the Risks in continuing this
balance is so extreme, we are going to remain in CASH with an extreme negative position
structure.
TQQQ

TQQQ - Sell to open 143.55Globex SELL - 143.55 x 2K - 1st Position
SEC warns on China's Listings transparency.
China remains the 800lb Gorilla in the room.
The rising wedge broke, only to be retested with
the required new ATH.
Big tech with the exception of FB/GOOG will be
lowering guidance, reducing EPS to compound prior
Q2 negative guidance.
AMZN YOY Warning stuck, AMZN has had difficulty
moving higher - ie. dead $.
Big Data will excel while Semiconductors come under
further Duress (SOXS SELL 40K)
Our Sell Position is to 4K shares, the target below
remains a break of the prior lows.
Geopolitical Risks remain high within the SCS/Taiwan
areana.
Interest Rate pressure will continue to build as the Yield
Curve's 10 - 30 spread is setting up to decline in Price as
Yields move higher into Fall.
FX is projecting a Higher DX, consolidating as Consumers
continue to increasingly Hoard Dollars.

Supports and Resistances for TQQQI am a big believer of once the underlying asset breaks a support/resistance that it will test the next one (above/below). Here are my supports and resistances for TQQQ.

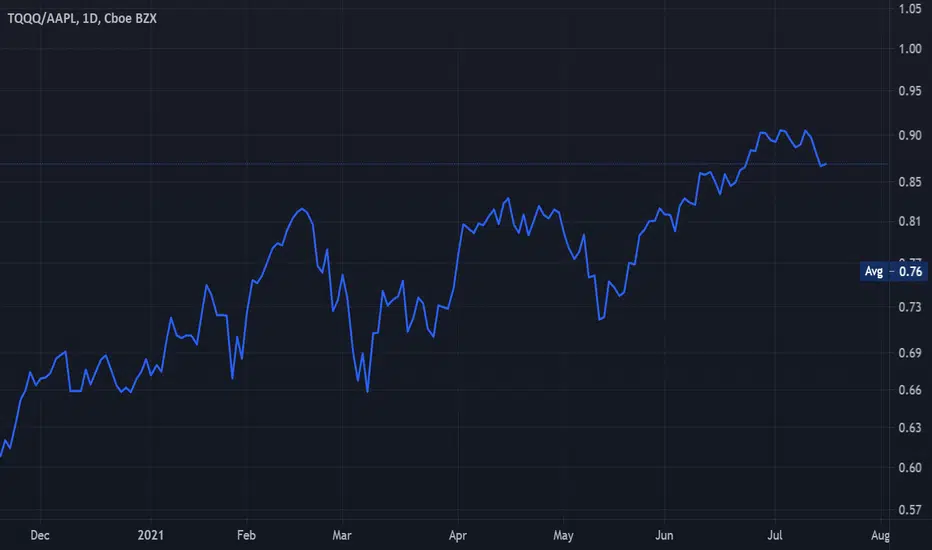
QQQs @ 363 363 will only be sustained by AAPL.
AAPL failed on Gamma again after
making a new ATH.
Those don't matter when 77% of Call
Volume is bought by DG's as opposed to
buying shares outright.
Simple.
363 EOW close is required or the decline
accelerates dramtically.


PANIC Ahead - August into OctoberThere is far more to "markets" than Charts.
Risks appear as IF unknown when all eyes are focused
upon Charts - this has been demonstrated time and again.
Yet it remains mostly ignored.
There are immense Risks to the Equity Complex.
Today is a Prime Example of Wall Street getting its fills for
the upcoming correction - it will be swift, violent and decidedly
nasty.
Buy the Dip is an almost religious, cult like adherence.
This too shall pass.
We anticipate a move to 200 EMAs happening with extreme
swiftness.
Timing it will be folly, it is best to begin positioning for it
as Geo Political Risk has not been this high in years.
Good Luck and may you prosper immensely in this next decline.

Incoming Market Correction!!The QQQ has remained within this parallel channel for months now.
As soon as it becomes over extended (top line), it corrects hard for about 20 days.
Get in now and wait, or hope for a small bounce and get in.
I believe we are headed for a correction.
Buckle in!

NAS100USD- Rising Wedge, 60% chance of bearish breakout.NAS100USD- Rising Wedge, 60% chance of bearish breakout (link to details below).
Bulkowski research.
thepatternsite.com

TQQQ : AAPLA clear divergence is forming between AAPL, TQQQ, QQQ
July will be the High for NQ IMHO, it will see a large correction
beginning next week.
Semiconductor Sector has immense issues.
We could see a 20% decline in Tech as shortages will crimp
earnings as Input Prices are being rejected.
The NQ has the potential to make a new high, it must break
the Range posted earlier this morning or failure will occur.
A decline will be rapid, NQ always follows RTY.
March and Sept quad witch are bear territoryMarch and Sept Quad witch are usually when big bear moves go down, well usually the month before. Contracts for the next month start the previous week. Usually end around the 19th and start the 21st.
Institutions and traders like to get in front of it and sell the month before. You can see clear patterns here the last 5 quad witches. So be prepared for some crazy price action early.

QQQs @ 386 and NQ Equivalent Highs aheadThe Chart illustrates both the potential Target for the QQQs high from a positive Draw
as well as the convergence from the Negative draw.
Where would this leave the NQ?
15,755 ~
Something to consider as the prior Squeeze ahead of the Algo's level for Sell Scale to
Open began a 500 point vertical move @ 4:02PM EST.
It created the largest Gap and Trap in Globex History.
And it promptly sold off off that evening and into the following session and continued
down significantly.
History will repeat, this is my sell level for NQ/MNQ - We will be scaling in from 15,500
to the target.

TQQQ Wave 5 Up (3 Cycles) - Not US10Y CorrelatedOn the long timeline TQQQ is in a wave 5 up, and could have another 2 months upward.
We're roughly 49 days into a 120 day period.
Wave lengths aren't constant but do seem to run 3-4 months up, then 2-3 months correcting, before ultimately heading upward again.
With a 50.8% Average Return Rate over the past 10 years even with the pandemic mess. I'm long TQQQ.
I was long for 5+ years prior to the Sept 4, 2020 drop, went to cash, and now regret it.
Pundits on the news keep trying to blame pullbacks in tech on interest rates.
Comparing them shows it to be untrue. There are times TQQQ goes up or down in synch with US10Y and times they don't.
* NOT FINANCIAL ADVICE * NOT A FINANCIAL ADVISOR *

Bear Flag at top of channel?Could see more regression next week towards the 20day MA..
(Not advice - Just my perspective/opinion)


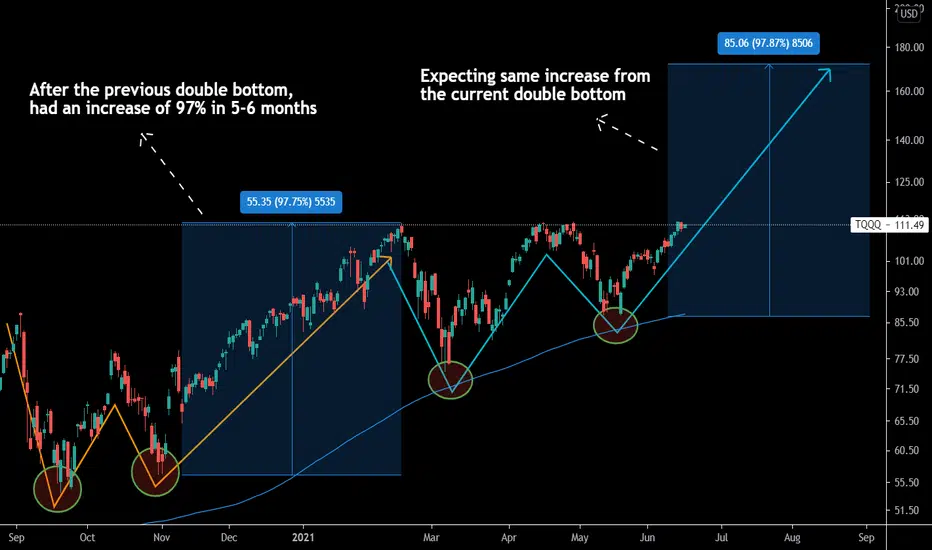
TQQQ - I'll be back (Terminator Voice)🤖-After having the recent tech turmoil, now it seems like the market has finally settled down.
-Last time a big double bottom was formed, TQQQ experienced a shocking 97% increase in just 5 months.
-Currently, we have the same formation again and it wouldn't be unrealistic to expect the same numbers again from these upcoming 5 months.
Our Opinion:
-We keep our target for the future 5 to 6 months at $170
QQQ Long Daily chart...kicking baby bullish candle.
Been range bound for 150ish trading days with no clear breakout or breakdown.
Be real, if you saw this on a 1 minute chart with momentum building you'd buy this breakout no?
Bullish as hell until otherwise.

QQQ ATHsGoing off my last $NQ1! idea published...near picture perfect and just a few hairs off fresh all time highs...
Obvious resistance again, but the grind up and growth leading for weeks is tilting towards a bullish breakout in a big way IMO. of course it's gonna be choppy, of course there's gonna be huge size on the bid and ask. No telling what could happen when price reaches that point...usually probes through to check it out. I'd expect something similar tomorrow or overnight even.
Good luck, and stay flexible.


Psychology of the indices.This is personal opinion only. Hoping to encapsulate all market participants on many timeframes and the thought process behind why some moves may seem illogical on the surface.

TQQQ LongMost definitely alot of short interest at these prices...but nuances my friends. Resistance flipping to support (tentatively holding) with another day of a lot of absorbing on the bids...Could see a breakout back up to retest ATH levels.
There is still a downside gap unfilled from last week...but as you should know the indices don't mind leaving them behind for a few weeks before eventually filling. Good luck.

$QQQ's Tentatively attempting to hold here for a move higher. OBV showing constructiveness, 25 day ROC curling back up to neutral. Resistance trying to flip to support, and a ton of absorbing on the bids intraday and a strong move up showed some character change...maybe not enough to push for new ATH's but in these 50/50 setups I'll lean bullish almost everytime. On watch.

TQQQ looking to start downswing to test 1YR support Looking a the TQQQ 1 year chart, looks like we are going to see a downswing to test support again after hitting a triple top at ~$111.89 since March. Current channel movement looks to mimic that from March. My entry point is $93 on June 14th but may come up to $95 to get lifted. What are your thoughts?

Upside vs Downside
You can see what the Nasdaq has been doing for the past few days - nothing.
There is serious overhead resistance. Unless it breaks through the easiest path is a 61% retracement and fill the gaps below and try again.
Again if the trendline get broken all bets are off.
Nasdaq is better at filling gasps better the SPX.
