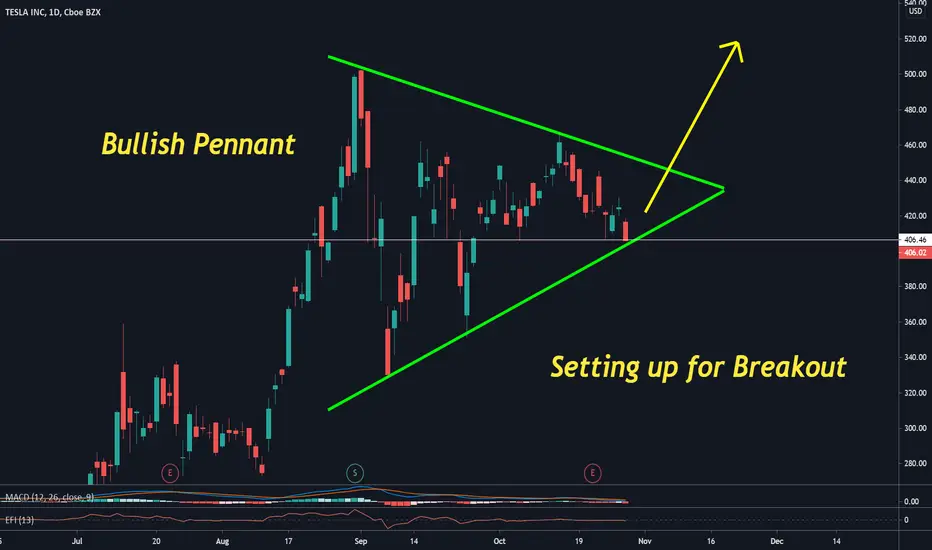
BUY TQQQ AND DONT GET GREEDYWE ARE ABOUT TO MAKE ALL TIME HIGHS IN QQQ, GET IN TQQQ AND MAKE A QUICK BUCK, DONT GET GEEEDY TQQQ IS NOT FOR THE FAINT OF HEART
TQQQ


NASA headed for correctionGot rejected multiple times Friday on 1 hour time frame to break thru resistance. Hanging man reversal candlestick at top exactly like Sept 2 correction. Bearish Symmetrical triangle

NDX Finding SupportNDX looks like it could find support at ~11,000 for the following reasons.
1) Potential Trend Line Forming; Break toward the top
2) I have the 2 Stdev Bollinger bands plotted: Price action is at the lower limit at this moment and could present buying pressure from the many who use this metric for entry points.
3) Fib levels show a retracement level at about 11,0000
4) VXN looks like it is hitting resistance at 43 and we are lower today than the values we saw on 10/28. Next resistance is ~46, and then ~60, so some risk there if volatility breaks out, but currently looks like the 43 level is holding.
5) PCC ratio is lower than the 10/28 value as of this moment, providing a little bit of comfort.
With this in mind, I believe this is a decent entry point for those willing to take the risk. If you have the ability to trade options, maybe consider selling some delta 30 covered calls to hedge your trade.

Hedging short equities positions with $TQQQOne of two things will happen:
Many puts will be OTM, we rally
- I will consider closing positions whether they are in profit/loss or roll over
The PC ratio will continue to push forward
- I lose a bit on this but net profit on overall positions

TQQQ Trends heading toward US Elections and Black FridayI anticipate the elections to continue to exert downward pressure on TQQQ as forecasts predict an administration that is less business-friendly will take control, and begin legislating an environment that is less supportive of profits and rapid growth. I suspect a bear condition on TQQQ and the broader tech market to persist into the new year, and think short positions or inverse positions are likely the spot to be for the foreseeable future as it relates to tech.


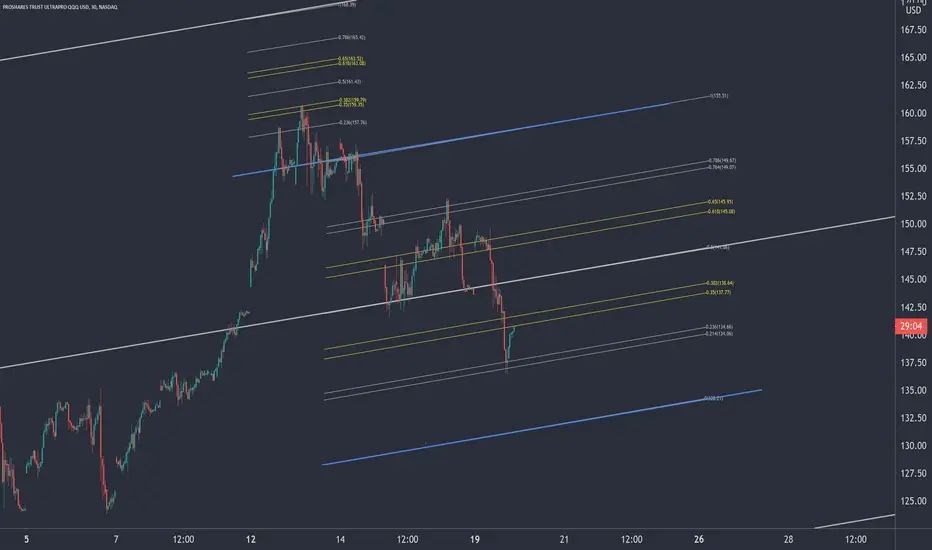
TQQQ - Hopin' to eek out a little at 141.25 then say goodbyeI see a downward channel the past few days on TQQQ and QQQ, an corresponding upward channels on SQQQ
Resistance around 135.40 on the downside.
Breaking move Up or Down out of trend coming soon.
Morning delight as the market rises, followed by afternoon drops seem to be the norm these days.
*NOT FINANCIAL ADVICE - NOT A FINANCIAL ADVISOR*

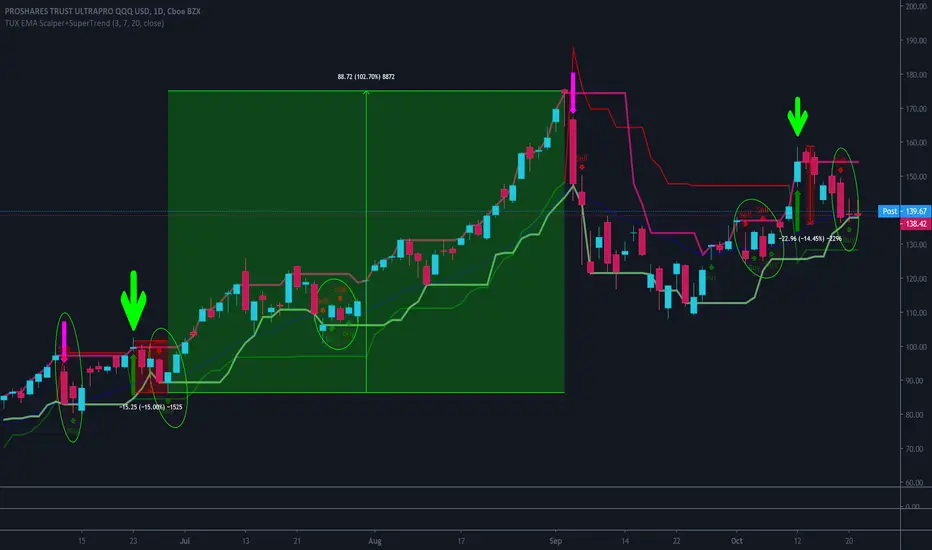
TQQQ Scalper PatternThere seems to be a pattern here. When a strong sell signal is followed by a buy signal, there are strong gains over the next few weeks. Also notice the Supertrend buy signals on 6/23 and 10/12. 6/23 was followed by a loss of ~15% followed by a 100% gain. 10/12 has now also lost ~15%.
TQQQ Exits Triggered TodayThis is my personal trading strategy, not trading advice. TQQQ triggered exits today, locking up more profit.


NASDAQ100- Big bust out confirmed?MASDAQ100 was in an uptrend channel since 2010.
Has busted out north of that uptrend channel and has confirmed what was once resistance is now support.
Looks pretty bullish, technically speaking.


KEEP IT SIMPLEThere are a lot of new traders getting wrecked. I'm sorry. Follow the trend. Follow price direction. Remember: The news is irrelevant. Follow price. Can you keep your money in the right direction?

Simple Trendline Breakout Trade on TQQQ today !This is another trade today that shows how trend line breakouts can help identify entry, stop loss and targets.. After first target is hit, rest continued to hold based on higher time frame charts.

Another Taffer in the Shadows?This is the NEW YORK COMPOSITE INDEX. Please see my previous post just a couple of weeks ago about this drop and what to expect from here. Based on all the data I can muster to analyze, the correction is not over. It's possible that we rally and/or drift sideways into the election but this looks very concerning to me.. I keep hearing from too many people that the Fed has their back. They believe the Fed will hold their hand to victory into an eternal upward rally. I am not one to dismiss the melt-up scenario and hyper-inflationary end game, but this is what I see right now.. I see the potential for another drop. The bigger question- what happens after this drop? Do we have a 08-like melt-down or is that just another dip to buy in this bull run? We'll take it as it comes. Please be smart, patient, and immune to public sentiment. Think for yourself but study, study, study!


TQQQ - 5 Year Trend Up, March drop, Elliot Wave to the TopAre we going to bounce off of the February High? or are we going to continue on the current downward trend? Thoughts?
March high is providing support two bounces so far. Possible A leg of correction. Trend channel down continues to provide resistance.
Still a long way down to the 200MA
Daily chart shows trading in a narrowing wedge.
*INFORMATION ONLY - NOT TRADING ADVICE - I AM NOT A FINANCIAL ADVISOR*

3 Gaps Down Bullish Reversal ConfirmedNASDAQ:TQQQ
On 9/8/2020, it broke support but recovered the next trading day. While doing so, the 3 gaps down bullish reversal got a confirmation when the prices crossed above the level of $124.00.

Quarterly rotation out of Tech and into Small-Mid cap stocks.
Equally weighted S&P 500 (RSP) and IWM had the smallest decline Thursday and Friday compared to other indices. This could signify that the sell-off was mostly over valued tech stocks and not a broader market sell off. Compare this to the price action in June, where RSP and IWM fell significantly, indicating a broad sell off of the S&P 500.
Using this chart, I measured the distance between the Nasdaq and the S&P 500 on June 10, just before the sell off. We can see that there is a 13% variance between the two indices. Compare this to August 12th variance of 21%. Considering that the RSP had a significant decline, we can conclude that there was a broad sell off of small-mid cap stocks and that money was then invested in large cap tech stocks (FANG).
Both of these declines happened in a two-day period but there is a big difference between the percentage lost. If you add up all of the declines in each of the indices, we see total loss for June 10 to be 31.4%. This is much less than that of August 12, which declined only 17.6%.
What is most interesting is when we look at the weighted average of these declines. It is almost exactly inverse! Meaning that in June the Nasdaq decreased the least but in August it decreased the most. The same is true with the Russell decreasing the most in June but the least in August.
I believe that going forward we will see greater percentage gains in IWM compared to the other indices. However, all of this is speculative and subject to change. But if you follow the wave counts for the S&P 500 and Dow you know we need a significant push to complete wave 5. A further decline in these indices would invalidate the wave count and cause significant bearish momentum.
In conclusion, assuming that this recent move was due to rotation I am bullish SPY and IWM and neutral QQQ. We should still see gains in tech but not as much as small to mid cap stocks.
To confirm this analysis, I will assess the weekly gains of each index over the next several weeks. If we do not see an increase in small-mid cap stocks then money is leaving the markets and not being reinvested. This would be very bearish.

Possible 20% Return on TQQQTQQQ has been on a strong upward trend follow the 180 day EMA. Last week had a significant drop but closed above the 180 day EMA. Great possible buy opportunity for a potential 20% return.
