Opening (IRA): TQQQ December 20th 74 Covered Call... for a 71.29 debit.
Comments: Selling the -75 delta call against stock to emulate the delta metrics of a 25 delta short put, but with built-in short call defense.
I'm looking at this as a starter position because I kind of have a feeling that I'm going to regret not putting this on in weakness/higher IV and will be adding at better strikes/break evens (only time will tell).
Metrics:
Buying Power Effect/Break Even: 71.29/share
Max Profit: 2.71
ROC at Max: 3.80%
50% Max: 1.36
ROC at 50% Max: 1.90%
TQQQ

Opening (IRA): TQQQ January 17th 65 Covered Call... for a 61.79 debit.
Comments: Adding a "rung" at a break even better than what I currently have on, selling the -75 delta call against stock to emulate the delta metrics of a 25 delta short put, but with the built-in defense of the short call.
Metrics:
Buying Power Effect/Break Even: 61.79/share
Max Profit: 3.21 ($321)
ROC at Max: 5.20%
50% Max: 1.62 ($162)
ROC at 50% Max: 2.60%
Will generally look to take profit at 50% max, roll out short call on take profit test (which is at 63.40).

Gold Spot intraday setup. The Pushmi - Pullyu animalRemember Dr. Dolittle? He was a vet who could talk to animals. One of the rarest was the “pushmi-pullyu,” a llama with two heads (one head was where the ass ought to be).
The pushmi-pullyu was a gentle creature that did not like to be stared at. And yet the other animals in Africa convinced him to go with the good Dr., and be put on display in Europe, because Dr. Dolittle was a kind soul who needed money to look after all the animals in his “care”.
It's gone a bit since Gold explosion last week, due to Biden's gaffe to authorize the yellow/blues regime use US-made missiles inside Russia's legal area, while the rods of Russia's retribution hanged like the sword of Damocles over all of Europe, on the basis of reciprocity.
Last week Gold spot added +153 US Dollars just in 5 Days. That was the best in history ever 1-week return, since January, 1980. Additionally, in percentage points Gold spot added +5.97 percent in a week. It was the 3rd best 1-week return over past decade.
Gold spot in Euro OANDA:XAUEUR at the same time continues its gain 11th straight month in a row.
The main intraday graph is for Gold spot OANDA:XAUUSD , and it indicates that Gold has retraced a bit to its key $2670 level (that was discussed in earlier published ideas), and ready to take Adv. again, since Trump-a-rally rolled out into the all-the-world fart.

UltraPro QQQ. Trump-a-rally gives no light for leveraged betsIt's gone 10 days or so, since Mr. Trump has secured a win over his Democrat-rival Kamala Harris in the 2024 U.S. presidential election, as it declared by the Associated Press.
Since that, a lot of stocks soared in a meme-style mode, while Bitcoin clears $93,000 and Dogecoin soared amid Trump-fueled crypto rally.
The main graph is for UltraPro QQQ NASDAQ:TQQQ and it indicates, that major 82-Dollars resistance for leveraged bets on Tech sector has not been broken yet.
👉 NASDAQ:QQQ is a traditional ETF that tracks the Nasdaq-100 Index, suitable for long-term investors seeking broad exposure to tech-focused stocks.
👉 NASDAQ:TQQQ is a leveraged ETF that aims to deliver triple (3x) the daily returns of the Nasdaq-100 Index, making it only suitable for short-term traders.
Since US dollar interest rates are still near multi year highs and Powell says the Fed is in no hurry to cut interest rates.. all of that means Trump-a-rally gives no light for leveraged bets (yet).
Potentially everything can be clear in January, 2025 only.
GL y'all. Cheers, @Pandorra 😎

Opening (IRA): TQQQ August 16th 73 Monied Covered Call... for a 70.80 debit.
Comments: High IV at 55%. Buying a one lot and selling a -75 call against in the August 16th monthly to emulate the delta metrics of a 25 delta short put, but with built-in short call defense. I looked at doing something in the 45 DTE wheelhouse, which would be the August 30th expiry, but it was less liquid than the monthly, so opted to go shorter duration, with the plan being to roll out to the September monthly should we get further weakness and/or a test of 73. Otherwise, I'll look to just take profit at my standard 50% max.
Metrics:
Buying Power Effect/Break Even: 70.80
Max Profit: 2.20
ROC at Max: 3.11%
50% Max: 1.10
ROC at 50% Max: 1.55%

Opening (IRA): TQQQ Sept 20th 63 Monied Covered Call... for a 59.60 debit.
Comments: High IVR/high IV at 68.7/63.1%. Selling the -75 delta call against stock to emulate the delta metrics of a 25 delta short put, but with the built-in defense of the short call.
Additionally, adding at strikes/break evens better than what I've current got on (the August 16th 73 covered calls; break even 70.80).
Metrics:
Buying Power Effect/Break Even: 59.60
Max Profit: 3.40
ROC at 50% Max: 5.70%
50% Max: 1.70
ROC at 50% Max: 2.85%
Will generally look to take profit at 50% max; roll the short call out for duration on side test.

Opening (IRA): TQQQ Oct 18th 59 Monied Covered Call... for a 56.10 debit.
Comments: This isn't at a lower strike than what I currently have on, but I'm (somewhat) fine with it, since I'm still below what I have in mind to be maximally deployed in this instrument.
Selling the -75 delta call against stock to emulate the delta metrics of a 25 delta short put, but with the built in defense of the short call.
Metrics:
Buying Power Effect/Break Even: 56.10
Max Profit: 2.90
ROC at Max: 5.17%
50% Max: 1.45
ROC at 50% Max: 2.58%
Will generally look to take profit at 50% max, roll out in-profit short call for duration and credit.

TQQQ I Next long opportunity - following correction from 74.87Welcome back! Let me know your thoughts in the comments!
** TQQQ Analysis - Listen to video!
We recommend that you keep this pair on your watchlist and enter when the entry criteria of your strategy is met.
Please support this idea with a LIKE and COMMENT if you find it useful and Click "Follow" on our profile if you'd like these trade ideas delivered straight to your email in the future.
Thanks for your continued support!Welcome back! Let me know your thoughts in the comments!

Opening (IRA): TQQQ Dec 20th 47 Covered Call.. for a 42.71 debit.
Comments: Since all my rungs are now out in Dec, adding one at lower break evens than what I currently have on, selling the -75 delta call against long stock to emulate a 25 delta short put, but with built-in short call defense.
Metrics:
Buying Power Effect/Break Even: 42.71
Max Profit: 4.29
ROC at Max: 10.04%
50% Max: 2.15
ROC at 50% Max: 5.02%

SQQQ I It will decline from top of the resistance channel
Welcome back! Let me know your thoughts in the comments!
** SQQQ Analysis - Listen to video!
We recommend that you keep this pair on your watchlist and enter when the entry criteria of your strategy is met.
Please support this idea with a LIKE and COMMENT if you find it useful and Click "Follow" on our profile if you'd like these trade ideas delivered straight to your email in the future.
Thanks for your continued support!Welcome back! Let me know your thoughts in the comments!

Sine Curve Analysis of Nasdaq working for meThis is an update to my previous post.
Shows that since the Nasdaq has left all bounds of normality, it tends to cross the sine curve in a predictable pattern. I'm using it with TQQQ and SQQQ and it is working for me.

Opened (IRA): TQQQ Sept 20th 58 Monied Covered Call... for a 54.85 debit.
Comments: Added to my position at a strike/break even better than what I currently have on.
Metrics:
Buying Power Effect/Break Even: 54.85/share
Max Profit: 3.15 ($315)
ROC at Max: 5.74%
50% Max: 1.58 ($158)
ROC at 50% Max: 2.87%

Opened (IRA): TQQQ Sept 20th 53 Monied Covered Call... for a 50.14 debit.
Comments: Added another rung here on weakness/high IVR/IV (83/69.8), selling the -75 delta call against stock to emulate the delta metrics of a 25 delta short put with the built-in defense of the short call.
Will generally look to take profit on rungs at 50% max, roll out the short call for duration and credit if it doesn't hit at 21 DTE.

Opening (IRA): TQQQ Sept 20th 49 Monied Covered Call... for a 45.45 debit.
Comments: Last rung in Sept ... . Selling the -75 call against stock to emulate the delta metrics of a 25 delta long put with the built-in defense of the short call.
Metrics:
Break Even/Buying Power Effect: 45.45
Max Profit: 3.55 ($355)
ROC at Max: 7.81%
50% Max: 1.78 ($178)
ROC at 50% Max: 3.91%

SPY short into the 540-543 zoneSPY short into the 540-543 zone on the first touch would most likely pay.

SPX 666The S&P has proven itself a safe haven over the years and will likely continue doing so. There are a ton of reasons why the markets should collapse, nonetheless here we are rallying into the sunset. Taking a step back on the logarithmic scale we can see the pattern clearly. We are in the midst of a 3rd wave up with plenty of room to run... but where to?
Near term and long term targets below.
Using the Fibonacci extension tool we can overlay a road map to the next destinations. No surprise there is a near perfect match.
The Near Term Top
The 2.618 level above at 4,500 is an area to pay attention to and is the current near term target. My strategy continues to be 'buy the dip' all the way up to these macro levels using the 1 hour chart with an RSI set to 10. However, 4,500 on the S&P does not look like the end of this cycle.
The Long Term Top
My long term call for the top is around 6,660. Not only is it sandwiched in between the last fib extensions. It is a historically significant pivot point.
No, I'm not a conspiracy guy but I do think it's hilariously entertaining that the major pivot points all happen near 666 levels. Looks to me as if the market is flying towards 6,660 like a bat out of hell.
Trading is risky. Don't do it.
Live trades with entries and exits will be updated on the post linked below titled "S&P 5,000,000"
Long:
MES futures
+ a basket of other equities

SPY on weekly stays the course LONGSPY on the weekly chart is up 25% in the past six months. This is beyond its historical norms
even during a presidential election year. While there has been some volatility in both directions
the climb is consistent and persistent. The indicators serve to document this. The predictive
algo predicts more of the same. A price cut when the fed gets around to it will serve to sustain
the trend. Lack of it through the summer may cause a fade of momentum. Make hay while the
sun shines.

QQQ Intraday $100 to $2500 with options RECAPQQQ is shown here on the 15 minute time frame. Overlaid are a HMA 7 and SMA 5 to provide
moving average crosses. QQQ made a "M" pattern. Options charts are shown in the updates.
First Trade SQQQ is opened at 9:48 for $ 6.00 per call contract times 16 contracts. It is closed
at 10:05 less than 20 minutes later at $20.00 per contract. $96 dollars the only risk in the trade
is waiting to settle as is the $ 224.00 in profit. ( This is a same day expiration intraday trade)
Second Trade QQQ as QQQ has topped and is pivoting down. The second trade of the day
is not a same day expiration as it is now Friday afternoon, a put option in the direction of the
trend is taken for Tuesday the 20th, there being no puts for the Monday holiday.
The floating profit is $ 224 and the strike is set for below the money in the current direction of
the trend. A strike of $ 429 selected. The options chart is shown in the updates.
The premium was 0.37 so $37 per contract so six contracts were taken for a total of
which is $222 or slightly less than the profit on the first trade. The trade is taken at 14:47
market time and closed about 90 minutes later at 15:52 before the close.
The contracts sold at close for $ 1.41 each yielding $ 141 per contract or $ 2256 overall.
Between the two trades $100 was risked and $ 233 + 2256 or 2489 overall.
The Reward to Risk ratio was about 25. The profit and the initial $100 into the trades
awaits settlement after the holiday.
This trade was made to teach a mentee about the power of options leveraged with narrow
expirations to optimize profits and not spend a lot of time in the trade to minimize risk
in the market from any number of potentials. Alerts and notifications centered on moving
averages and rise or fall of intraday low time frame relative strength are used to lessen
screen time. Twenty baggers may not be everyday but then again with practice and patience
they can come along often enough.

QQQ rangbound bearish bias SHORTQQQ on the daily chart hit a hpivot high on 3/21 followed by a slight downtrend of 1-1.5 %
overall this past week. Buying volumes are low. The Price Momentum Oscillator has
reversed to bearish and the Raltive Trend Index has entered the chop zone and is heading
bearish. Price is presently one standard deviation above the intermediate-term anchored
VWAP. Reversion to the mean suggests another 1% move downside before VWAP support
exerts itself. Price is compressing in a symmetrical triangle. Accordingly, I am expecting
a move down before a potential reversal in a VWAP bounce from that support.

SQQQ leveraged inverse QQQ LongSQQQ on the 15 minute chart has trended down into a reversal at the end of the last trading
session. A snapshot of the 3 minute chart inlaid shows a reversal about 14:45 EDT 75 minutes
before market close. I took a long trade of shares and call options striking $10.00 for June 14th
at that point. I am expecting a 5% quick return on the shares and far more on the options.
The relative volatility indictor is helpful to further pinpoint the reversal for best entry.
(red to green) The set of Hull Moving Averages ( 14 and 35) also serves to signal "death" and
"golden" crosses which serve to further aid trade entry accuracy. The relative volume indicator
( of veryfid) also helps in that regard. It has extreme volume spikes in black. OF particular
interest, the last 15 minutes of the trading week has a volume spike of buying in SQQQ.
This comforts me to know that other traders saw what I saw. I am fortunate that I saw it
about 45 minutes before them and got a better price. This demonstrates the value of indicators
and knowing how to apply and interpret them. Trading is not as complicated as the pundits
and the fee for services and trading room coaches will have you to believe to make you
financially dependent on their "guidance and assistance".

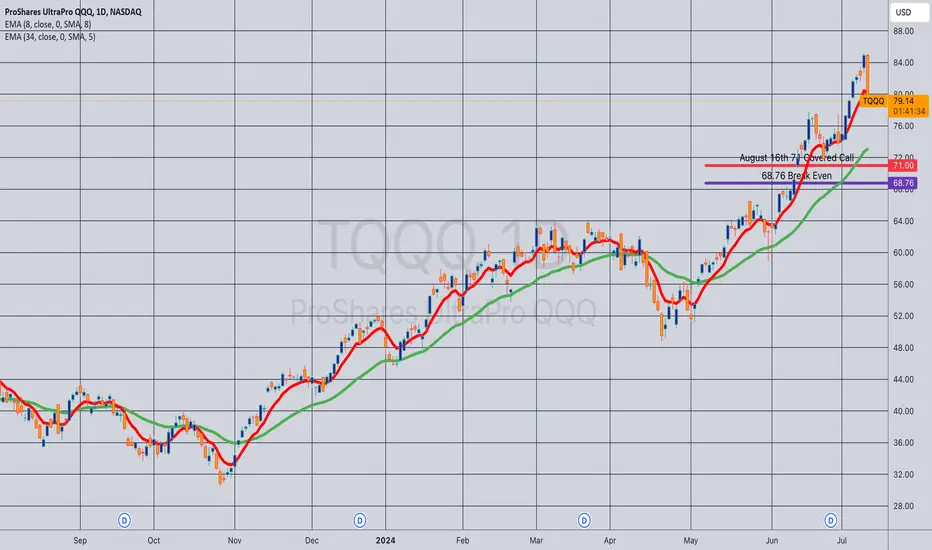
Opening (IRA): TQQQ August 16th 71 Covered Call... for a 68.76 debit.
Comments:
Buying stock and selling a -75 delta call against to emulate the delta metrics of a 25 delta short put with the built-in defense of the short call. As usual, this only makes sense in a cash secured environment where you don't get much BP relief going with the short put over the covered call; on margin -- stick with the short put.
Metrics:
Buying Power Effect/Break Even: 68.76/share
Max Profit: 2.24/contract
ROC at Max: 3.26%
50% Max: 1.12/contract
ROC at 50% Max: 1.63%
Will generally look to take profit at 50%, roll out the short call on side or break even test. (It's entirely possible that I will regret this trade later).
$RUT FANTASTIC STRENGTH, $NDX is the opposite!WOW what a phenomenal day!
There was HUGE volume on the TVC:RUT AMEX:IWM & it closed near the highs of the day!!!
NASDAQ:NDX on the other hand had heavier than normal volume and closed near the lows of the day
Add to the misery, bearish engulfing was formed today. NASDAQ:QQQ
Did we just see the initiation of money rotation?

Nasdaq is gonna crash in the next two weeks! SAME PATTERN!CAUTION: AWESOME OPTIONS PLAYS AT THE END OF THE POST! NFA ;-)
Look at this weekly chart and don't tell me that this is a repeating fractal!? The same color trend lines are almost the same length to a T. The upper trend line channels are gonna be the same distance, which extrapolates this going south for a very long time. (check out my AMEX:SILJ thread to show the repeating fractal line up)
Now of course these lines aren't gonna be what happens, you can see there was some out of the ordinary channel reactions on the downtrend last time.
I personally think that Biden is gonna mess up the debate, then pardon his son and leave the presidency while Kamala will tap Hillary Clinton as VP (via Ford Agnew redux) and then pardon Biden for any crimes done in office or out of office.
The markets will melt down, the FED will cut rates, maybe by 250 basis points since they keep going larger with their reactions to contain the ponzi scheme.
I'd buy puts right now, 400 December Puts for 4.10, sell them for 5x for a nice Christmas/New Year's present.
OR you can go the supersize route and buy puts on TQQQ for 42$ for the $25 strike price (it'll go lower imo) for a 25x return, if the price goes down to $15, that's around a 4200% return!! NFA ;-)
Also this shows the road forward, via a Livermore Accumulation Pattern. So we go very UP for the long term.
