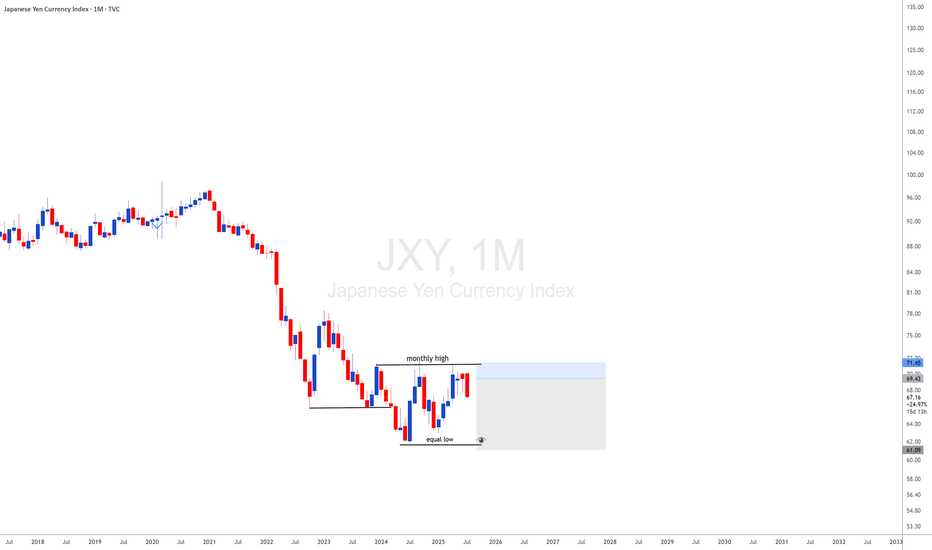
JXY with JXY looking monthly downside and DXY looing upside i will be looking for 35 years breakout of usdjpy meanning uj is a long therm upside
How to View the Assets in Japan
It should be noted that many of the assets the government owns are not marketable, or, if so, their
price can sharply drop in the case of fiscal crisis. Therefore, the financial situation should be assessed
first by gross debt.
In addition, the assets earmarked with the liabilities (such as pension reserves and FILP loans) are
not directly related to fiscal consolidation because they are not included in “Bonds outstanding of
central and local governments”, which is the benchmark of fiscal consolidation target
Trad
✅ GBP/USD Movement: Factors Affecting Price ActionFollowing a notable rebound at the daily 61.8% Fibonacci retracement level, the GBP/USD appears poised for a potential bullish impulse continuation, particularly from the level around 1.23500. The recent downturn in the US Dollar's value, which concluded the week on a significant decline, correlates with a broader trend of decreasing US yields across various timeframes. This movement aligns with investors' current preference for a potential interest rate cut by the Federal Reserve in September. Looking ahead, upcoming economic indicators include the RCM/TIPP Economic Optimism Index and Consumer Credit Change on May 7, followed by the release of the weekly MBA’s Mortgage Applications and Wholesale Inventories on May 8, with Initial Jobless Claims expected on May 9. The week concludes with the publication of preliminary Michigan Consumer Sentiment data and the Monthly Budget Statement.
Despite a continuation of the GBP/USD's upward momentum observed in the preceding week, the breach of the 1.2600 resistance level toward the end of the week failed to sustain momentum. On May 7, market watchers anticipate the release of the BRC Retail Sales Monitor ahead of the S&P Global Construction PMI. The Bank of England's meeting on May 9 is a notable event, alongside the expected release of GDP figures, Trade Balance data, Industrial and Manufacturing Production statistics, and the NIESR Monthly GDP Tracker toward the end of the week.
In summary, market sentiment leans towards a bullish continuation in the GBP/USD, with key economic indicators and central bank decisions shaping the trajectory of the currency pair in the coming days.
Basic Understanding of Market StructureWelcome to the Game Of Resilience .. Structure is the King structure tells everything that you can go for buy or sell trades . sometimes structure will confuse you too so understanding the structure is some what tricky point all over the internet because everyone have a different perspective so coming to the point just this post is to understand the basics of what is market structure and what strong highs and low .
FTM/USDTHello, TradingView community and my subscribers, please if you like ideas do not forget to support them with your likes and comment, thank you so much and we will start.
Today I want to talk with you about FANTOM the chart.
Price came down to the support level.
FANTOM is a LONG position and we expect that level to hold.
Determine The Market BNB TrendHi My Friend
I Have a question for you to the BNB Market , pleas Help Me to this Night
Do this is the flag Pattern ?
Market collapse ?
Market reform ?
Return pattern ?
But My Answer this is the Flag Pattern
Enter In 205 USDT
Target1 348 USDT
Target2 541 USDT
In your opinion is this good
pleas Talk About this Idea
Thank You
fast analyse on EURUSD 4HAccording to the previous and current analysis, the pair knows a rapid rise in line with the geopolitical tensions and the upcoming war as the dollar is known as a major deterioration against most currencies and this is a suitable opportunity for traders for quick profits
Last analyse
For more follow on Twitter & Instagram
TRENDLINERS OUT THERE! THE EURO IS NOT OUT OF THE WOODS YET!I have seen countless charts for the Euro with trendlines that are typical to the yellow one I drew - they all hit somewhere at 1.05. If you trade using trendlines or incorporate them in your analysis, then you have be as objective as possible with them. The only way we could really be objective about trendlines is by perfectly lining up price points. Using that logic, here is where the Euro stands with regard to the monthly trendline from early 2000/2001.
My trade:
Short @ 1.11
Stop @ 1.12
Target - small time frame determined


