Trade!

DOT/USD LONG SET UPTime Frame: 1D
Entry Price 1: $4.40
Entry Price 2: $3.40
Stop Loss: $2.40
Take Profit 1: $5.40
Take Profit 2: $7.50
Take Profit 3: $9.50
Take Profit 4: $11.50
Status: ACTIVE


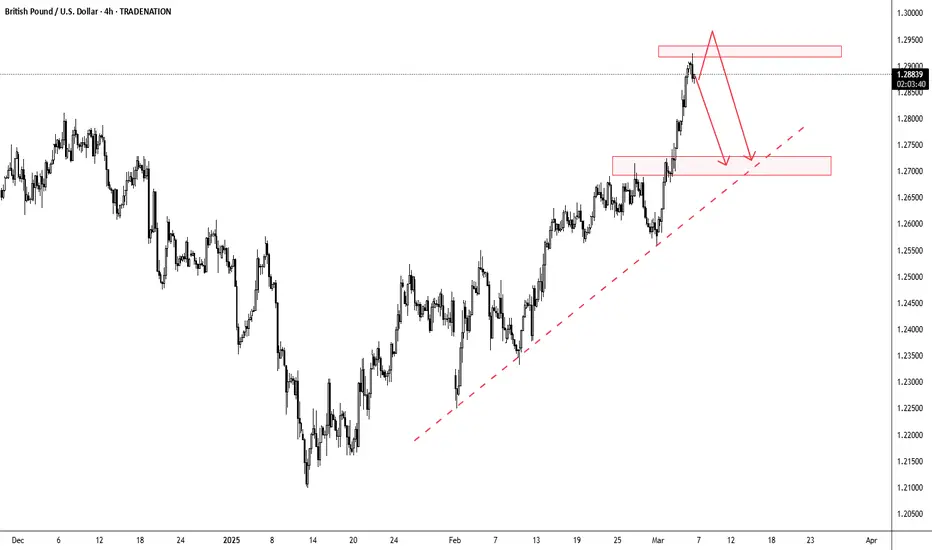
GBPUSD - Retracement to the trendline?The GBP/USD pair has exhibited a strong bullish trend since its January lows, currently trading at 1.2876. After reaching recent highs, the price is now at a critical decision point as shown by the chart's resistance area (upper red box) and ascending trendline. The sharp upward movement followed by the recent pullback suggests potential exhaustion of buying momentum, with the red downward-pointing arrows indicating a possible corrective phase ahead.
Two scenarios appear most likely from this technical formation: either price continues higher to break above the upper resistance box before initiating a correction, or an immediate correction begins from current levels. In both cases, the lower orange box around the 1.2700-1.2720 area serves as a reasonable target, as does the ascending trendline (marked by the red dashed line) that has supported the uptrend since January. Traders should watch for potential reversal signals or consolidation patterns to confirm which scenario is unfolding. As always don't jump into trades and wait for confirmation!
Disclosure: I am part of Trade Nation's Influencer program and receive a monthly fee for using their TradingView charts in my analysis.
GBPJPY - More downside?GBP/JPY appears to be in a potentially bearish setup after recently testing resistance. The chart shows that price has formed a significant consolidation zone with clear upper and lower boundaries marked by the red horizontal lines. After making a recent high, the price seems to be struggling to break above the upper resistance zone highlighted by the pink box. The long downward-pointing red arrow marked on the chart is our highest probability move that we anticipate right now.
Given the recent price action and failure to establish new highs above resistance, the higher probability move is likely downward. This bearish outlook is supported by the apparent double top formation near the resistance zone and the pronounced selling pressure that has emerged after testing these levels. Traders should watch for a potential breakdown below recent support levels, which could accelerate the downside move toward the lower boundary of the range as indicated by the arrow's trajectory.
Disclosure: I am part of Trade Nation's Influencer program and receive a monthly fee for using their TradingView charts in my analysis.

LONG GOLD NOWWW !!!Hi dear traders.
Xauusd will grow to 2960$ from live 2900$ price!
Take a Long position now and enjoy.
follow us, Be aware and enjoy.

BITCOIN MAJOR PUMP! Price Analysis I hope you guys enjoyed the video!; let me know if you have any questions or comments and be sure to check out my Stock Market Idea

Gold in MONTHLY Time frame ( important) Hi friends this is my analysis about XAUUSD in monthly time frame ..
gold is on the dynamic resistance
what do u think about reaction to this resistance ?
((i think it have respect to the blue dynamic trend ))
but then in the longterm its bullish
what do u think ?
plz tell me in the coment

Oscars about to BREAKOUT - 64% UpsideNYSE:OSCR - BREAKOUT IMMINENT!
Williams % Range is Breaking Out
Foreshadowing a Falling Wedge Breakout?!
- I think so!
Breakout = $28 🎯
- Volume Shelf Launchpad
- Above H5 Indicator (GREEN)
Not financial advice

UPS SET UP im going long, but this is what can happen
United Parcel Service, Inc. is an American multinational shipping & receiving and supply chain management company founded in 1907 and headquartered in Sandy Springs, Georgia

Usdjpy sell zoneThis is a USD/JPY (U.S. Dollar/Japanese Yen) 1-hour timeframe technical analysis from FXCM, indicating a sell trade setup with the following details:
1. Resistance Level: Identified around 149.546, marked in yellow. This is the level where price is expected to face selling pressure.
2. Entry Point: Around 148.990, which aligns with a key resistance zone.
3. Target Level: 147.459, representing the expected price drop where traders may take profit.
4. Market Outlook: The analysis suggests a bearish setup, expecting price rejection from the resistance zone and a downward move toward the support level.
5. Price Action Strategy: The price is likely to consolidate near resistance before making a decisive move downward.
This setup signals a potential short (sell) opportunity, anticipating that USD/JPY will decline after hitting resistance, making it favorable for sellers.

JPN225 Short 1. There are multiple patterns on this trade
2. This is with the H4 trend
3. Stop loss of 150 pips
4. M15 and M30 are overbought but might be too early to say there is a lot of divergence


Gold📌 **Sell:**
✔ In short-term timeframes (M1, M5, M15), both MACD and Stochastic indicate overbought conditions and a potential downward correction.
✔ The M30 timeframe is still in an uptrend, but a pullback to the downside is possible.
🎯 **Conclusion:**
Success rate for selling: ✅ **70%** (more reliable than buying in the short term).
📌 **Strategy:** Short-term selling with a tight stop-loss and a corrective target towards lower support levels.
📌 **Buy:**
✔ In H1 and H4 timeframes, signs of a trend reversal are emerging, but MACD has not yet given a solid confirmation.
✔ If MACD turns bullish on H1 and Stochastic exits oversold territory, buying will be a safer option.
🎯 **Conclusion:**
Success rate for buying: ✅ **55%** (higher risk, requiring more confirmation).
📌 **Strategy:** Wait for MACD confirmation on H1, then enter a buy position upon resistance breakout.
🚀 **Final Recommendation:**
🔹 Enter short-term sell positions in lower timeframes with a tight stop-loss and proper risk management.
🔹 Wait for a confirmed buy signal on H1 and H4, as MACD has not yet turned fully bullish.
🚀 **Short-term selling (scalping) is more probable**, but additional confirmation is needed for a buy position.
### **Suggested Targets Based on Timeframes & MACD + Stochastic Analysis**
🔴 📉 **Sell Targets:**
Considering overbought conditions in lower timeframes and a potential downward correction, the best sell targets based on different timeframes are:
✅ 📌 **First Target:** 2850 (Short-term support in M5 & M15)
✅ 📌 **Second Target:** 2842 (Key support in M30)
✅ 📌 **Third Target:** 2830 - 2825 (Strong support in H1, aligning with the moving average)
🛑 **Stop Loss for Sell Positions:**
🔹 **2862** (Breakout of the current resistance in M15 & M30)
🔹 **2868** (If the price reaches this level, the trend may reverse)
---
🟢 📈 **Buy Targets:**
A **full confirmation from MACD in H1 and H4** is required for a buy setup. However, if the price rebounds from the **2830 support zone**, the following targets are expected:
✅ 📌 **First Target:** 2865 (Initial resistance in H1)
✅ 📌 **Second Target:** 2880 - 2890 (Strong resistance zone in H4)
✅ 📌 **Third Target:** 2915 (Long-term target if resistance levels are broken)
🛑 **Stop Loss for Buy Positions:**
🔹 **2825** (If this level is broken, the downtrend is likely to continue)
🚀 **Suggested Strategy:**
📌 **Short-term sell (scalping) from 2857**, targeting **2850 and 2842**, with a **stop loss at 2862**.
📌 **Buy if confirmed at 2830 - 2825**, targeting **2865 and 2880**, with a **stop loss at 2825**.
🔍 **Important:** Before entering positions, confirm with **trading volume and candlestick patterns in higher timeframes**. 🚀

Gold Price Analysis February 28⭐️Fundamental Analysis
This week, the US Dollar (USD) continued to recover on expectations that the Federal Reserve (Fed) will keep its monetary policy tight as inflation remains high. This caused money to flow out of gold - a non-yielding asset.
In addition, gold prices fell as investors adjusted their positions ahead of the US release of important inflation data, a factor that could affect the Fed's interest rate decision and the short-term direction of gold. However, concerns about former US President Donald Trump's tariff policy and risk-off sentiment could help gold hold its price. In addition, falling US Treasury yields also contributed to limiting gold's decline
⭐️Technical Analysis
After closing yesterday's candle, gold confirmed a clear downtrend. The SELL zone that is being watched by investors today is around 2889. Any price increase today is considered a great opportunity to sell. 2840 is considered as the support zone today. The wider price range is being watched when there are signs of Break out from the narrow range at 2920 and 2806. Currently, gold needs to break through 2870 to reach the upper range and if it fails to break 2870, we can set SELL signals at 2840 today.

Secure Profits of LONGBTC/USDT 1H Technical Analysis – Updated Insights
🟢 BitcoinMF Signal: TP Hit – Key Resistance Zone
The BitcoinMF PRO indicator's long signal successfully hit the Take Profit (TP) target, aligning with a resistance level around $94,410. This area is now a critical decision point for BTC's next move.
📊 Advanced Technical Breakdown:
1️⃣ Fibonacci Retracement & Extensions:
To assess potential support and resistance levels, key Fibonacci levels have been recalculated based on the recent price movement:
0.236 Fib Retracement (Support) → $87,416
0.382 Fib Retracement (Support) → $85,991
0.618 Fib Retracement (Stronger Support) → $80,423
1.618 Fib Extension (Bullish Target) → $98,217
2.618 Fib Extension (Aggressive Target) → $104,500
These levels suggest that maintaining support above $87,000 could pave the way for a move toward 98K, while a breach below this support might lead to a deeper retracement.
2️⃣ CME Gap – Key Risk Factor
A CME gap exists between $77,930 and $81,210, formed in November 2024. Historically, such gaps tend to be filled over time, indicating a potential retracement to this zone before resuming the macro uptrend.
3️⃣ Bitcoin Dominance – Altcoin Impact
BTC Dominance is currently at 52.8%, indicating that Bitcoin is leading the market rally. This dominance suggests that if BTC corrects, altcoins may experience more significant declines in the short term.
4️⃣ Exchange Flows – Whale Activity
There has been a significant outflow of BTC from exchanges, signaling accumulation by investors and reduced selling pressure. This trend supports the potential for further upside unless a reversal pattern emerges.
5️⃣ Fear & Greed Index – Market Sentiment
The Fear & Greed Index currently reads 81 (Extreme Greed), reflecting strong bullish sentiment. While this indicates market confidence, it also warrants caution, as extreme greed can precede corrective phases.
6️⃣ Fisher Transform & Stochastic RSI
Fisher Transform: The indicator is in the overbought zone but has not yet signaled a reversal.
Stochastic RSI: Recently crossed above 80, indicating overheated conditions and suggesting a potential cooldown or sideways movement.
🔮 Next Most Probable Move:
📊 Probability Score (Scale 1-10)
Bullish Continuation Probability: 6.5/10
Short-Term Correction Probability: 7.5/10
🔹 Scenarios:
If BTC maintains support above
87K, a move toward
98K is plausible.
If BTC falls below 87K, the 80K region becomes the next significant support level.
🚨 Most Likely Outcome: A short-term retracement toward 87K-85K is anticipated before the uptrend potentially resumes, targeting 98K-100K.

Bitcoin longReason for this trade is that price is very cheap and good support around here. Bitcoin long entry 79,414 Stoploss 78,750 target profit 120k or 200k or higher.

BITCOIN'S LAST CALL📢 Bitcoin is currently at $86,107, and the world is SLEEPING on what’s about to happen next. The biggest wealth transfer in human history is happening right in front of us – will you seize the moment or regret it forever?
🔥 WHY BITCOIN IS ABOUT TO SHOCK THE WORLD:
✅ Spot ETFs are eating up BTC supply FASTER than miners can produce! 🏦
✅ The 2024 Halving is coming – a supply shock like NEVER before! ⏳
✅ Banks, hedge funds, and even GOVERNMENTS are secretly stockpiling BTC! 💰🌍
✅ Fiat is collapsing – Bitcoin is positioning itself as the world’s new financial backbone!
💰 BITCOIN PRICE PREDICTIONS – SAVE THIS POST!
🔹 $100K – The Next Psychological Barrier (And It’s Closer Than You Think!)
🔹 $250K – The Institutional FOMO Era (Big Money Can’t Ignore BTC Anymore!)
🔹 $500K – The Supply Crisis Hits (BTC Becomes Scarce Like Never Before!)
🔹 $1,000,000 – The Endgame (Bitcoin Becomes the World’s Reserve Currency!) 🚀
📉 They laughed at Bitcoin at MIL:1K … They doubted it at $10K… They ignored it at $50K… And soon, they’ll regret missing $1M BTC!
⏳ This is the LAST CYCLE before Bitcoin becomes untouchable for the average person. Will you act, or will you watch others make history?
💬 COMMENT your Bitcoin price prediction below! Will BTC hit $1M? LIKE & SHARE if you believe Bitcoin is the future! 🚀🔥

TTD LONG SET UPEntry 1 $75.00
Entry 2 $72.50
Stop loss $60.00
Take profit 1- $85.00
(Close 33%)
Take profit 2- $97.50
(Close 66%)
Take profit 3-$115.00
(Close 100%)

Gold Analysis May 25⭐️Fundamental Analysis
Market sentiment remained cautious on Tuesday due to concerns over Trump tariffs and Nvidia's upcoming earnings report. The US dollar continued to hold its strength on risk-off sentiment, limiting gold's gains. However, gold prices remained supported by falling US Treasury yields and rising trade war risks.
Bond yields fell on a strong auction and weak PMI data, raising expectations that the Fed will cut interest rates twice this year. Meanwhile, trade tensions escalated as the Trump administration considered tightening controls on chip exports to China.
⭐️Technical Analysis
Gold prices are still operating in a wedge of 2928 and 2952. The 2958 zone is also quite easy to create a false ATH. 2968-2970 acts as the most important resistance for Gold at the moment, which is considered the weekly resistance level. Watch out for gold falling, there could be a deep drop to 2906-2900.

Bullish on Monthly TF.Bullish on Monthly TF.
Double Bottom with Bullish Divergence is a
Positive Trigger.
2 Important Support Levels
S1 around 819 - 820
S2 around 720 - 722
Upside Targets can be around 970 - 975
Next Resistance is around 1000 - 1020

TRISIG/UDST NEW INCREASE VOLUMETRISIG/UDST NEW INCREASE VOLUME
Data shows that this coin can get a new increase volume coming time.

EURUSD Will Collapse! SELL!
My dear friends,
Please, find my technical outlook for EURUSD below:
The instrument tests an important psychological level 1.0497
Bias - Bearish
Technical Indicators: Supper Trend gives a precise Bearish signal, while Pivot Point HL predicts price changes and potential reversals in the market.
Target - 1.0474
About Used Indicators:
Super-trend indicator is more useful in trending markets where there are clear uptrends and downtrends in price.
———————————
WISH YOU ALL LUCK
