Time to Enter MDB Again?On Thursday afternoon, the King Trading Momentum Strategy signaled alongside eleven other alerts that day, followed by five more on Friday. This activity doesn’t exactly scream “bearish” to me, but the market has a way of keeping you on your toes! With markets once again approaching all-time highs, I’ve been treading cautiously. My positions have been limited to just a few, with low allocation sizes in TNA, ADBE, PYPL, and XYZ.
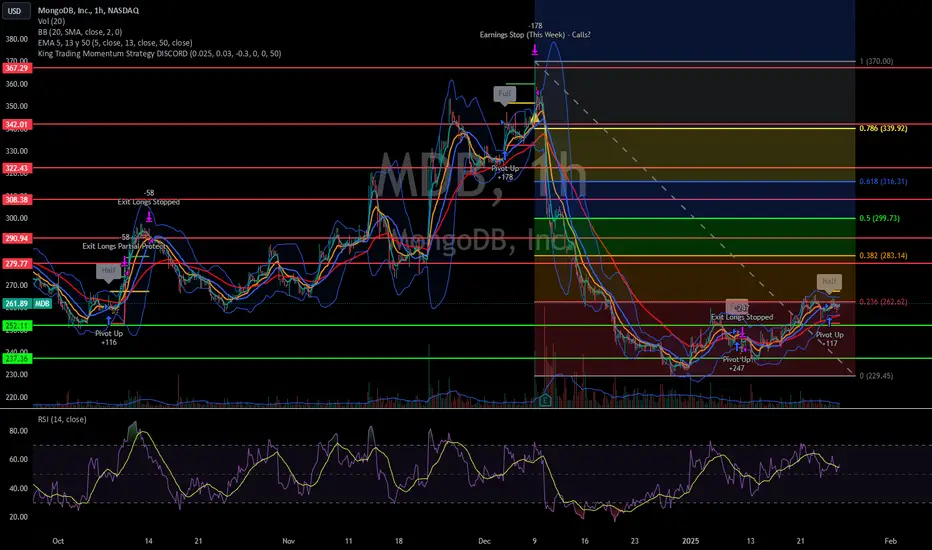
When I looked at MongoDB (MDB), I found myself wondering why it was hammered after posting a double beat on earnings and providing decent guidance. It turns out the recent drop was primarily driven by the announcement that Michael Gordon, MongoDB's Chief Operating Officer and Chief Financial Officer, will be stepping down on January 31, 2025. Is this reaction overblown? After all, the company delivered a strong earnings report.
That said, MDB seems to have planted its bull flag in the ground. Even if this news creates headwinds, there’s a possibility it could retrace back to the 38% Fibonacci level. Even if the broader market eventually pulls MDB lower, this setup suggests an 8% potential upside, and I’ve set an initial take profit at 5% with a 3% stop loss. If this can hit the take profit, I will sell half to protect the trade and then set a trailing stop loss of 1.5% on the remainder, trying to sell of much of it as possible on the way up!
Unless Monday brings a complete washout due to fears surrounding the Fed meeting on Wednesday or the PCE data on Friday, I’ll likely use the typical morning volatility as an opportunity to enter this trade. Let’s see how this one plays out!
The King Trading Momentum Strategy combines the 5 EMA crossing above the 13 EMA, RSI strength, favorable momentum as measured by ADX plus evaluating recent volume changes and even something that measures breakout momentum called Beta for this one! MDB and over 100 equities are built into this script with optimal backtest take profits and stop losses and can be toggled on by simply checking a box (default they are turned off).
Trade!
OM/USDT Analysis The price is breaking out of the red resistance zone.
🎯 Targets:
1️⃣ First Target: Green line level
2️⃣ Second Target: Blue line level

SAFEMOON - Not so safe for the medium termIt looks as though there could be a fractal for SAFEMOON. Historiclally, we've seen rises like this but only to be dissapointed and for the trend to be reversed again. I've drawn out a blue line of what the most likely trajectory will occur. The only other alternative is that the upward trend will continue, buying action will surge and we will see a bursting through of the upper trend line and escape the channel. If it comes back within the channel momentarily, that's fine - but not if the volume dies down and we stay within. So, it doesn't look great for an investment and I wont be putting anyting into it. Follow for more.

JUNO: Signs of a Trend Reversal? Key Indicators Align!It looks very much as though JUNO is showing promising signs of a trend reversal. What I mean by this is a breach of the upper trend line, which may only be a matter of time. We have a very strong indication from volume with the wonderful large green bars we're seeing, a 'pinch' in the Bollinger bands and a very tiny, but hugely important 'up ward pointing' signal line within the MACD. As always, use many indicators to create a 'cocktail' of methods which adds to the strength of your decision making. Due to low liquidity, I'm not going in. But, take don't fall foul to FOMO here. Just because it's seen a spike, it doesn't mean it's going to break out of the channel and continue up. Good luck. Follow for more.

H5 Day Trade Review! Crushed $BE Trade x2🚀 H5 Day Trade Review
Check out how we absolutely nailed NYSE:BE day trades two days in a row! 👇

Bitcoin Price Analysis! Over 100k!I hope you guys enjoyed the video! Feel free to comment down below any questions

Scenario on usdjpy 23.1.2025 The market has formed sfp above the high which gives me an idea of where the market could go the likely scenario is a return back to the price around 158 from where a rebound and return back to lower levels could follow

$TMDX - Bottom is in, higher from here!If you are a NASDAQ:TMDX bull you are going to want to see this!
In my opinion, we've just bottomed!
🎯$80
Not financial advice

BONK/USDT: BIG MOVE Incoming (stay tuned)BONK/USDT: 24-Hour Market Sentiment and Trade Analysis
I spend time researching and finding the best entries and setups, so make sure to boost and follow for more.
Market Overview (Current Price $0.00003269):
- BONK/USDT is trading above the entry price of $0.00002295, awaiting entry as it retraces from recent highs.
- The token is riding on speculative interest, fuelled by increased activity in meme and low-cap altcoins.
Technical Overview:
- Support Levels: $0.00002295 (Entry), $0.00001135 (Stop-Loss)
- Resistance Levels: $0.00006132 (TP1), $0.00013343 (TP2)
- Indicators: MACD shows decreasing bullish momentum as the price consolidates, while RSI is in a neutral zone, leaving room for further moves.
Fundamental Catalysts:
- Community Sentiment: BONK is gaining traction as a meme coin, with a vibrant social media presence driving speculative interest.
- Liquidity: Trading volumes remain elevated, providing opportunities for significant price movement once the entry is triggered.
- Market Context: Broader crypto market sentiment remains positive, favouring meme tokens and low-cap projects like BONK.
Scenario Planning:
- Bullish Scenario: If BONK reclaims momentum, it could trigger entry at $0.00002295 and move toward TP1 ($0.00006132) and TP2 ($0.00013343) over time.
- **Risk Scenario:** A breakdown below key support levels or broader market corrections could lead to a stop-out at $0.00001135.
Trade Setup:
- Entry Price: $0.00002295 (Awaiting Entry)
- Stop-Loss: $0.00001135
- Take-Profit Targets:
- TP1: $0.00006132
- TP2: $0.00013343
When the Market’s Call, We Stand Tall. Bull or Bear, We’ll Brave It All!
**Disclaimer:**
This analysis is for informational purposes only and does not constitute financial advice. Traders should conduct their own due diligence before making investment decisions.

H5_L Screener Run Through! 22Jan2025In this video, I run through my H5_L Screener!
Todays date: 22Jan2025
Found some great trades and setups using my screener!
Not financial advice

SHOP Go Long! Will it break out this time?Recently SHOP has retraced and held the 50% Fib level and has been trading within a channel where it is about at the mid point of it. The King Trading Momentum Strategy yesterday issued a buy signal. This strategy combines the 5 EMA crossing above the 13 EMA, RSI strength, favorable momentum as measured by ADX plus evaluating recent volume changes. It has been forming a bull flag on the hourly and pre-market suggests this may be ready to break out. I followed the signal and bought a half position, looking to protect the trade at take-profit of 4%. During backtest this proved to be an optimum area and a stop-loss of 3% is warranted. SHOP and over 100 equities are built into this script. If trade protects at 4%, a trailing stop-loss of 2% will be adhered to in order to lock in as much profit as possible if this stock breaks out of the descending channel! I'm thinking its not too late for me to add to this position given typical morning volatility.

GBP/USD Short and GBP/JPY ShortGBP/USD Short
Minimum entry requirements:
• Corrective tap into area of value.
• 4H risk entry or two 1H high test rejections.
Minimum entry requirements:
• 1H impulse down below area of value.
• If tight 5 min continuation follows, reduced risk entry on the break of it.
• If tight 15 min continuation follows, 5 min risk entry within it, or reduced risk entry on the break of it.
GBP/JPY Short
Minimum entry requirements:
• Tap into area of value.
• 1H impulse down below area of value.
• If tight 5 min continuation follows, reduced risk entry on the break of it.
• If tight 15 min continuation follows, 5 min risk entry within it, or reduced risk entry on the break of it.

Bloom Energy ($BE) - H5 Swing of the Week!🚨 25% Upside H5 Swing Trade 🚨
NYSE:BE ran for over 200%, got some rest and is now breaking out!
Energy is hot right now too.
🎯$28🎯$32
High Risk/ High Reward here!
I'm in on the March $26 Calls.
NOT FINANCIAL ADVICE!

XAUUSD SHORT OPPORTUNITY 1:5
Fundamental Sentiment
Inauguration Day- Anticipating a bullish dollar NY open
Directional Bias
New York bias - Bearish bias
Price Action:
AMD Model this session: Accumulative price action in Asia, Bullish Manipulation start of London session. Anticipating a bearish distribution in New York
15mins market structure shift with a clear AOI at the bearish orderblock.
Setup invalidation
If price rallies above the high of London open, this will invalidate this setup.

BTC - Time cycles unlock some key insights BTC is very clearly able to be carved out into time cycles, or 'Hurst' cycles, which are regular appearing patterns of units of time which can help us in informing price action. Looking at BTC, it's clearly cutting into cycles of about 40 days with the price action within each cycle very clearly going in either direction - apart from one! Looking at the most recent cycle we just entered into, the price action is likely to rise and continue to rise until either the middle of the cycle (target) or the end of the cycle (vertical line). So please add Hurst cycles to your cocktail of methods for understanding 'when' an event is likely to take place, or at least give you a marginally higher percentage probability. Good luck. Follow and share for more.

GREAT LONG?!"START OF A TREND WHERE THE EMA STARTED TO BALLOON.
QUESTIONS TO ASK YOURSELF:
How does the company look fundamentally?
Has the stock shown full respect for the 50 EMA?
Has the stock created a bottom and a breakout?
Are we holding above the 20 EMA?
Trail the stop approximately 8%.
Sell 50% at overbought levels (RSI).

BTC Analysis BINANCE:BTCUSD
Approximately a month ago, Bitcoin (BTC) reached $108,000, followed by a significant drop to $90,000. A strong support zone formed around $92,000, leading to a rebound. We also had a crucial zone at $99,000 to $100,000, which has been broken and flipped into support.
Currently, as long as the price remains above this zone, there's a strong possibility of moving toward higher levels, potentially reaching around $110,000.
BINANCE:BTCUSD

btc breakout happening as we speak, double div up to 108kbtc chart - double 4h div into breakout, i think is good chance for blaster

GBP/JPY Short, NZD/JPY Long, USD/CAD Short and CHF/JPY ShortGBP/JPY Short
Minimum entry requirements:
• Tap into area of value.
• 1H impulse down below area of value.
• If tight 5 min continuation follows, reduced risk entry on the break of it.
• If tight 15 min continuation follows, 5 min risk entry within it, or reduced risk entry on the break of it.
NZD/JPY Long
Minimum entry requirements:
• 1H impulse up above area of interest.
• If tight 15 min continuation follows, 5 min risk entry within it, or reduced risk entry on the break of it.
USD/CAD Short
Minimum entry requirements:
• If tight 15 min continuation forms, 5 min risk entry within it, or reduced risk entry on the break of it.
CHF/JPY Short
Minimum entry requirements:
• Corrective tap into area of value 1.
• 4H risk entry.
Minimum entry requirements:
• Tap into area of value 2.
• 1H impulse down below area of value 2.
• If tight 15 min continuation follows, 5 min risk entry within it, or reduced risk entry on the break of it.

GOLD 30m CHART ROUTE MAP & TRADING PLAN FOR DAILYGold (XAU/USD) Outlook for the Upcoming Week:
The outlook for XAU/USD in the coming week depends on a combination of technical, fundamental, and economic factors, including the Federal Reserve's policy, economic data, and the strength of the U.S. dollar. Here's an analysis based on the provided chart:
Technical Analysis:
Overall Trend:
The chart shows a medium-term uptrend, with higher highs and higher lows forming.
A small pullback is observed toward the end of the chart, which could potentially act as a retracement before resuming the uptrend.
Key Levels:
Support Levels:
$2,700 is the nearest support level.
A deeper support is located at $2,685.
Resistance Levels:
Immediate resistance lies between $2,715 and $2,720.
A breakout above this zone could push prices toward $2,735.
Indicators (if applicable):
Indicators such as RSI or MACD (not shown in the chart) can confirm whether gold is in overbought or oversold territory. If RSI is above 70, it might suggest selling pressure could emerge soon.
Fundamental Analysis:
U.S. Economic Data:
Key economic releases, such as inflation data (CPI) or employment reports, could influence the dollar. Weak U.S. data typically supports gold prices.
Federal Reserve Policy:
Any dovish signals from the Fed, such as reluctance to raise interest rates further, would be bullish for gold as a non-yielding asset.
Geopolitical Risks:
Heightened geopolitical tensions could increase demand for gold as a safe-haven asset.
Forecast for the Week:
If prices hold above the $2,700 support level and break the $2,720 resistance, a continuation of the uptrend is likely.
Failure to hold $2,700 could lead to a decline toward $2,685 or even $2,665.

Bitcoin Market Insights | Pre-Inauguration (January 2025)Bitcoin ( $BTC&USD ) is once again at the forefront of market discussions as traders analyze its price movement and macroeconomic factors.
As of January 19, 2025, Bitcoin (BTC) is trading at $104,936, reflecting an increase of approximately 1.8% from the previous close. The intraday high reached $105,505, with a low of $102,875.
Market Dynamics:
Regulatory Environment: The inauguration of President Donald Trump has introduced a more crypto-friendly regulatory landscape. Analysts anticipate that smaller cryptocurrencies, or altcoins, may experience more significant gains compared to Bitcoin under the new administration.
Price Projections: Some analysts predict that Bitcoin's value could reach up to $400,000 in 2025, driven by favorable cryptocurrency policies and the potential establishment of a strategic Bitcoin reserve.
THE AUSTRALIAN
Technical Analysis:
Support and Resistance Levels: Immediate support is identified around $100,000, with resistance near the all-time high of $108,309.
On-Chain Metrics: Data from Glassnode indicates a decline in short-term demand momentum, with "Hot Capital" decreasing by 66.7% from its December 12th peak. This suggests potential consolidation or further correction in the near term.
Conclusion:
As markets gear up for the upcoming inauguration, Bitcoin remains in the spotlight. Bitcoin's market is influenced by a combination of favorable regulatory developments and technical indicators pointing toward potential consolidation. Traders should monitor support and resistance levels closely and stay informed about policy changes that could impact market dynamics.
Outlook Ahead of Inauguration
Bitcoin is likely to remain volatile leading up to the inauguration, driven by Policy announcements related to cryptocurrency regulation & Broader macroeconomic cues, such as inflation reports and Fed commentary.
Trading Ideas
Bullish Scenario:
Long above $105,500, targeting $108,000 and $110,000, with a stop at $103,000.
Bearish Scenario:
Short below $102,500, targeting $100,000, with a stop at $104,000.

LTC - Loads more up to goI've had a lot of requests for custom analysis on LTC. Its looking strong within the channel and there's potential for lots more up to complete the X wave, which would still look corrective in a very straightforward looking ABC. I actually don't like LTC too much. It's slow, sluggish, doesn't keep up with market trends. But, it's looking strong for some more up. Follow and share for more.

BTC, higher highs incomingBTC has shown huge confidence in with a trendline breakout on price, volume and MACD is looking near vertical too. These are what I call signals that 'jive' together. I would never place a trade on one signal alone, I try and gain as many signals to jive as possible before risking any assets. It's great to see and that means we're within the long awaited wave 5 of larger degree of trend 1. Which, would see at least 135k. Exciting, high confidence here. Follow and share for more.
