Another RR1 Buy Setup on Gold
TimeFrame: m30
Position Type: BUY
Entry Price: 3395
Stop Loss: 3372
Take Profit: 3417
R/R: 1
Please Manage Your Risk...
Trading is a risk management game...
Trade!

17.06.25 Morning ForecastPairs on Watch -
FX:EURUSD
FX:CADCHF
OANDA:XAUUSD
A short overview of the instruments I am looking at for today, multi-timeframe analysis down to what I will be looking at for an entry. Enjoy!

Traders, it's time to pay close attention! 🚨 USDJPY 4H Setup Alert – High-Probability Play Unfolding! 🚨
Traders, it's time to pay close attention! 🧠📊
The USDJPY pair has just perfectly tapped into a key bullish Fair Value Gap (FVG) on the 4-hour chart — a classic move in the smart money playbook. What’s more? We've just seen a clean sweep of internal range liquidity (IRL) — a textbook liquidity grab that signals potential accumulation by larger players. 💥💼
This is not just noise — it's a significant signal. The market structure is hinting at a possible shift in momentum, and bullish pressure is building. The trap has been set, the weak hands have been shaken out, and smart money may be preparing for a strong upward push. 📈🐂
🔮 What’s the next move?
All eyes are now on the external range liquidity (ERL) — a prime liquidity pool sitting above current price levels. If price accelerates toward it, this zone could act as the magnet and the catalyst for the next explosive move upward. 🚀
🔥 Key Points to Watch:
Bullish FVG reaction ✅
IRL liquidity swept ✅
Bullish market structure forming 🏗️
ERL liquidity resting overhead — potential target 🎯
Volume profile & order flow confirming accumulation? 👀
⚠️ Stay alert and don’t chase — let the setup come to you.
Smart money might already be stepping in, and if this momentum follows through, we could be witnessing the beginning of a strong leg up.
Mark your charts and monitor closely — opportunity is knocking. 📍🕵️♂️

Top 5 Most Effective Forex Trading StrategiesTop 5 Most Effective Forex Trading Strategies Used by Professional Traders
Forex trading requires not just knowledge, but discipline and a clear strategy. So what are the most effective forex trading strategies that professional traders consistently use to achieve sustainable profits?
Let’s explore the 5 most trusted strategies that have stood the test of time – helping you level up your skills and reduce risk in this trillion-dollar market.
1. Breakout Strategy – Catching the Wave When the Market Explodes
A breakout occurs when price moves beyond a key support or resistance level after a period of consolidation. This usually signals the start of a new trend.
Best for: Traders who love strong momentum.
Pro tip: Confirm breakout with volume or candlestick patterns (e.g., engulfing).
Caution: Avoid entering right after the breakout – wait for a retest.
2. Trend Following Strategy – Trade with the Market, Not Against It
“Trend is your friend” – one of the most famous sayings in trading. This strategy helps traders ride the main trend, buying in uptrends and selling in downtrends.
Recommended tools: MA 20, MA 50, RSI, MACD.
Insider tip: Combine with pullback entries (enter when price retraces to dynamic support/resistance).
3. Price Action Strategy – Reading the Market Without Indicators
Price Action focuses on interpreting pure price behavior, without relying on indicators. Many pro traders prefer this approach to understand market psychology in real time.
Advantages: Clean, flexible, sharpens decision-making.
Popular candlestick patterns: Pin Bar, Inside Bar, Fakey, Engulfing.
4. News Trading Strategy – For Quick Thinkers and Fast Hands
When major news events like CPI, NFP, FOMC, or rate decisions hit the market, volatility surges. This creates both high-profit opportunities and high risks.
Common tactic: Straddle – place Buy Stop & Sell Stop before news release.
Risk warning: Watch out for slippage and widened spreads.
5. Fibonacci & Confluence Strategy – High-Probability Entries
This strategy combines tools like Fibonacci retracement, trendlines, support/resistance zones, and moving averages to find high-probability entry points.
Strength: Optimizes Risk: Reward ratio.
Tip: Focus on Fib levels 0.382 – 0.618 (commonly used retracement zones).
Conclusion: The Best Strategy is the One That Matches Your Style
There’s no perfect strategy – but understanding and applying the one that best fits your trading style will help you avoid emotional decisions and build long-term consistency.
Remember: Risk management – Emotional control – Systematic discipline = Long-term trading survival.

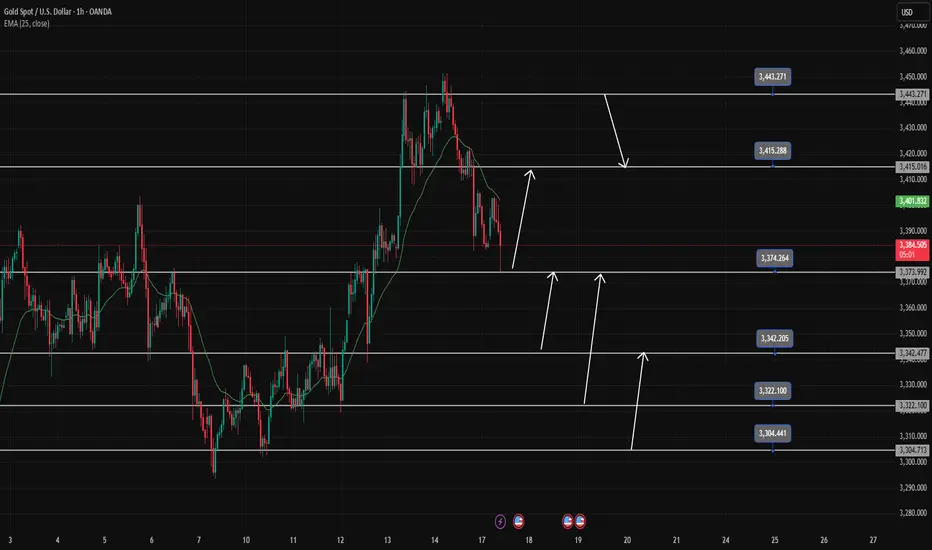
Gold trading strategy June 17D1 candle shows profit taking by sellers pushing the price back below 3400. In the current context, the pullback is only short-term and has not confirmed the reversal, but long-term Buy signals can still be noticed at important support zones.
Today, there are many price zones that can BUY Gold, so wait for confirmation before placing an order. Gold is heading towards the first support around 3375-3373 (this zone has just reacted 100 pips). This is also the Breakout zone. If it breaks this zone, Gold will reach 3343-3341 before it can BUY.
Note that to sell break 3373 and the SELL resistance point must wait for 3415 and the daily resistance 3443-3445
If there is a sweep to 3343 and bounces and closes above the 3373 breakout zone, it confirms that the uptrend will continue strongly in the near future.
The next BUY support zone to pay attention to is 3322-3320 and the 3305-3303 zone. The BUY target is always pushed further back to 3415 or to the peak around 3443.
SUPPORT: 3373;3342;3322;3304
RESISTANCE: 3415;3443
EURUSD Long Setup – Bullish Rejection from Demand ZoneEURUSD remains supported by strong eurozone fundamentals and broad USD softness. The pair has retraced into a key demand zone around 1.1490 and is showing signs of bullish rejection. With the Fed likely to pause further rate hikes and the ECB maintaining a steady tone, the bias favors further upside toward recent highs.
⚠️ Geopolitical tensions in the Middle East (Israel-Iran conflict) have introduced mild safe haven demand, but so far the USD has underperformed versus the euro, suggesting EUR remains relatively insulated.
Watch for confirmation and entries within the blue demand box.
🔍 Technical Analysis:
Structure: Clear uptrend with higher highs and higher lows. Price retraced to a well-defined 1H demand zone between 1.1490–1.1500.
Setup: Anticipating a bounce from the demand zone targeting the recent high near 1.1620–1.1630.
Entry Zone: 1.1490–1.1500 (bullish reaction area)
Target: 1.1620–1.1630 (previous supply zone)
Stop Loss: Below 1.1439 (recent swing low)
Risk-Reward Ratio: Approximately 1:2.5
🧠 Fundamental Context (as of June 16):
EUR Bias: Bullish – ECB has paused cuts; euro is resilient despite geopolitical headwinds.
USD Bias: Bearish – Fed is on pause; soft inflation data and geopolitical risks weigh on dollar strength.
Key Drivers:
Fed dovish tone (FOMC pause, lower CPI)
Strong EU resilience despite global tensions
CHF and JPY attracting safe haven flows over USD
📅 Key Events to Watch:
US Core PCE (next major inflation readout)
FOMC commentary and Fed speakers
Eurozone CPI and sentiment data

Bitcoin/USD 2-Hour Price ChartChart showing Bitcoin's 2-hour price movement against USD, currently at $106,647.03 (+0.96%), with a recovery trend from $105,000 and key levels at $109,000.92 and $104,544.34.

16.06.25 Morning ForecastPairs on Watch -
FX:NZDUSD
FX:CADJPY
OANDA:XAUUSD
FX:EURCAD
A short overview of the instruments I am looking at for today, multi-timeframe analysis down to what I will be looking at for an entry. Enjoy!

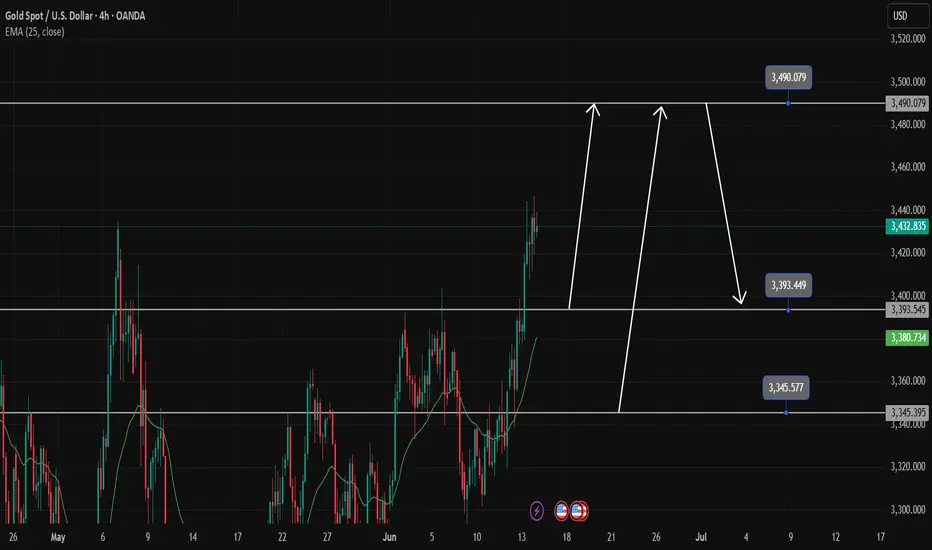
Gold price is sure to make ATH in the new weekGold confirms a long-term uptrend. The ATH 3500 zone is likely to have a reaction before 3490.
Any pullback in Gold next week is still considered a good opportunity to Buy Gold. And the bullish price gap is likely to continue on Monday.
3495 and 3345 are accumulated with many people waiting to Buy there, setting up a Buy signal with SL 10 price at the weekly support and resistance zones.
The possibility of breaking ATH next week is very high
Support 3393-3345
Resistance 3490
GBPUSD will continue to rise and break last week's highGBPUSD is correcting lower in the range at the end of the week. This pullback is heading towards the 1.350 support. There will be a bullish reaction at this area. Or if the selling pressure really takes over the market at this support area, then pay attention to the 1.346 bottom for the BUY strategy of this currency pair.
On the other hand, 1.360 will prevent the price increase. It will act as strategic resistance before a new extended breakout to the upside.
The uptrend is more likely to continue than the downtrend, so prioritizing BUY signals will bring better profits to the currency pair.
Support: 1.350, 1.346
Resistance: 1.360, 1.366

Gold Price Analysis June 13Yesterday's D1 candlestick increased, confirming the continuation of the uptrend. Following that uptrend, the Asian session saw a strong increase in price to the highest peak of 3443. If there is still confirmation from the h4 candlestick above 3395, today will still be a bullish candlestick with a large amplitude at the end of the day.
After reaching the highest peak of the month, Gold is having a downward correction at the end of the Asian session. This correction lasts until the support of 3397 to have a good BUY signal. In case you want to SELL, you must wait for a 50% test of the previous full-force downtrend H1 candle (around 3434) and the continuation of the Selling side.
If the 50% test does not appear, you must reverse to find a BUY Breakout point. Note that the False break at the peak of 3343 should wait for confirmation of the small-frame DOW wave to enter the order, which will be safer for this morning's break.
If you get a BUY order, the target will be 3364 and this area will have a profit-taking reaction from the Buyers, causing the price to decrease. Gold may touch the threshold before ATH 3394 and there will be a reaction.
In the opposite direction, there is a sweep to 3376, which is considered the daily support zone and you can buy in this area.
All SELL signals are considered obstacles, so set a short target and a new BUY signal sets a long expectation.

EUR/USD Short and GBP/USD ShortEUR/USD Short
Minimum entry requirements:
- If tight non-structured 15 min continuation forms, 5 min risk entry within it if the continuation is structured on the 5 min chart or reduced risk entry on the break of it.
- If tight structured 15 min continuation forms, reduced risk entry on the break of it or 15 min risk entry within it.
- If tight non-structured 1H continuation forms, 15 min risk entry within it if the continuation is structured on the 15 min chart or reduced risk entry on the break of it.
- If tight structured 1H continuation forms, 1H risk entry within it or reduced risk entry on the break of it.
GBP/USD Short
Minimum entry requirements:
- If tight non-structured 1H continuation forms, 15 min risk entry within it if the continuation is structured on the 15 min chart.
- If tight structured 1H continuation forms, 1H risk entry within it.

13.06.25 Morning ForecastPairs on Watch -
FX:GBPUSD
FX:EURUSD
A short overview of the instruments I am looking at for today, multi-timeframe analysis down to what I will be looking at for an entry. Enjoy!

Opportunity to buy EURUSDI see an opportunity to buy the EUR/USD pair from the support shown in the image and the target will be 1.16316

Gold Trading Strategy June 12Yesterday's D1 daily frame bounced and closed above 3347. That led to a price gap today.
3375 is a resistance zone that is showing a price reaction in the European session. If it cannot be broken by mid-European session, it is possible to set up a sell at 3355. The 3355 zone for BUY strategies is in the price gap created at the beginning of today's trading session.
Any price decrease today is considered a good opportunity for buying Gold to aim for 3432
Pay attention to the 3355-3347-3321 zone for today's BUY signals. Target is still 3432 but you need to pay attention to the 3397 zone where there may be a reaction from the Sellers.
Support: 3355-3347-3321
Resistance: 3397-3432

GBPUSD is rising towards the resistance zone of 1.35600GBPUSD is heading towards 1.35600. If the gold price closes around this area, it confirms that the buyers have entered the market. You can set up a BUY signal now with SL placed below the candle wick. After touching 1.356, we can wait for the price reaction and set up a SELL signal again following the sideways border.
Do you agree with our view of buying 1.34900 and SL 1.34600?
Leave a comment

12.06.25 Morning ForecastPairs on Watch -
OANDA:JP225USD
FX:AUDJPY
FX:USDJPY
FX:GBPJPY
A short overview of the instruments I am looking at for today, multi-timeframe analysis down to what I will be looking at for an entry. Enjoy!

USD/CHF ShortUSD/CHF Short
Minimum entry requirements:
- Corrective tap into area of value.
- 4H risk entry or 1H risk entry after 2 x 1H rejection candles.
Minimum entry requirements:
- Tap into area of value.
- 1H impulse down below area of value.
- If tight non-structured 5 min continuation follows, reduced risk entry on the break of it.
- If tight structured 5 min continuation follows, reduced risk entry on the break of it or 5 min risk entry within it.
- If tight non-structured 15 min continuation follows, 5 min risk entry within it if the continuation is structured on the 5 min chart or reduced risk entry on the break of it.
- If tight structured 15 min continuation follows, reduced risk entry on the break of it or 15 min risk entry within it.

11.06.25 Morning ForecastPairs on Watch -
PEPPERSTONE:COCOA
FX:GBPAUD
FX:CHFJPY
A short overview of the instruments I am looking at for today, multi-timeframe analysis down to what I will be looking at for an entry. Enjoy!

BTC - Be mindful of resistance around 109,800 to 110,000Per my second last post about this red trendline - be mindful that there is a resistance located 109,800 to 110,000 zone.
Although Bitcoin can break above, that doesn’t mean the resistance is invalid. Price will weave above and below until it sticks and plays out.
Personally I watch these levels for sudden fast movement and confirmation that it’s holding as resistance.
If you see a fast drop initiate from these levels, be mindful that this could be indicative of intention to hit the lows around 20,000.
For more information see my previous posts.
Happy trading

$VKTX Trade Alert - 42% Upside🚨 NASDAQ:VKTX Trade Alert 🚨
☕️ CupnHandle Breakout:
🎯 $41.76
⏳ October 1st 2025
💸 Jan. 16th $30 Calls
Not Financial Advice

Gold drops over 20 USD, pressured by US-China negotiations.In the early trading session on Tuesday (June 10th), the price of gold XAUUSD dropped sharply from around 3,328 USD/ounce to about 3,305 USD/ounce.
Bloomberg pointed out that the price of gold decreased during the early Asian trading session on Tuesday when both sides in the US-China trade talks hinted at a willingness to make concessions.
The easing of tensions between Washington and Beijing could reduce the appeal of gold. Senior officials from the US and China initiated the second round of trade talks in London, the first since the Geneva meeting in early May.
On the afternoon of June 9th, local time, the first meeting of the China-US Economic and Trade Consultation Mechanism was held in London, UK. The meeting will continue on June 10th, local time.
The US delegation, led by Treasury Secretary Benjamin Bessant, also included Commerce Secretary Lutnick and US Trade Representative Greer. Bessant told reporters in London that they had a "good meeting," while Lutnick called the discussions "effective."
Bloomberg reported that the US hinted at the possibility of lifting export controls on certain technologies in exchange for China easing restrictions on rare earth exports.
The easing of tensions in the US-China trade war is a key factor currently creating downward pressure on gold, which has already risen more than 26% this year.
Gold traders are also awaiting the release of the US Consumer Price Index (CPI) data this week to assess the "health" of the US economy and predict the Federal Reserve's interest rate cut trajectory.
Technical Outlook for XAUUSD CAPITALCOM:GOLD
After recovering in yesterday's trading session, supported by the confluence of the EMA21 and Fibonacci retracement at 0.382%, gold has dropped back to test this area at the start of today's trading session.
Gold may continue to face selling pressure in the short term once the price breaks below the 0.382% Fibonacci retracement level, with the short-term target at around 3,250 USD, followed by the 0.50% Fibonacci retracement level.
However, as of now, the technical positions still show potential for price increase, as the support from EMA21 and the 0.382% Fibonacci retracement has not been broken. The short-term recovery target remains at 3,350 USD, followed by the key resistance level at 3,371 USD, which is also the price point of the 0.236% Fibonacci retracement.
Considering the current position, gold still has a bullish outlook, with the potential for a price drop mentioned earlier. The key levels to watch are as follows:
Support: 3,300 – 3,292 – 3,250 USD
Resistance: 3,350 – 3,371 USD

Analysis of Gold Trading Strategy for June 10th - 11th, 2025Identify strategies through this video:
Key Support and Resistance Levels of XAUUSD
Support Levels: 3,300 – 3,292 – 3,250 USD
Resistance Levels: 3,336 – 3,346 USD
With the current technical backdrop, gold still has short-term bullish potential, but it is essential to closely monitor key support and resistance levels. The gold market remains full of potential, but also presents challenges. Wishing you successful and effective trading!"
