AUD/JPY Short, EUR/JPY Short, GBP/JPY Short and USD/CHF ShortAUD/JPY Short
Minimum entry requirements:
- 1H impulse down below area of value.
- If tight non-structured 5 min continuation follows, reduced risk entry on the break of it.
- If tight structured 5 min continuation follows, reduced risk entry on the break of it or 5 min risk entry within it.
- If tight non-structured 15 min continuation follows, 5 min risk entry within it if the continuation is structured on the 5 min chart or reduced risk entry on the break of it.
- If tight structured 15 min continuation follows, reduced risk entry on the break of it or 15 min risk entry within it.
EUR/JPY Short
Minimum entry requirements:
- If structured 1H continuation forms, 1H risk entry within it.
GBP/JPY Short
Minimum entry requirements:
- If tight non-structured 1H continuation forms, 15 min risk entry within it if the continuation is structured on the 15 min chart.
- If tight structured 1H continuation forms, 1H risk entry within it.
USD/CHF Short
Minimum entry requirements:
- Corrective tap into area of value.
- 4H risk entry or 1H risk entry after 2 x 1H rejection candles.
Minimum entry requirements:
- Tap into area of value.
- 1H impulse down below area of value.
- If tight non-structured 5 min continuation follows, reduced risk entry on the break of it.
- If tight structured 5 min continuation follows, reduced risk entry on the break of it or 5 min risk entry within it.
- If tight non-structured 15 min continuation follows, 5 min risk entry within it if the continuation is structured on the 5 min chart or reduced risk entry on the break of it.
- If tight structured 15 min continuation follows, reduced risk entry on the break of it or 15 min risk entry within it.
Trade!

EUR/USD BUY LIMIT / FOREX POSITIONHERE IS eurusd SIGNAL
for you guys on live trade on 15 time frame
by chart analasis and OB + fibonacci

BTCUSD – continuing to buy as breakout confirms bullish setupBTCUSD is forming a classic “cup and handle” pattern, now breaking above key resistance. Price is holding within an upward channel, and if momentum stays strong, the next target could reach 160,000 and beyond.
It might seem hard to believe, but the structure points to continued bullish momentum. I’m not missing this opportunity and continue to build long positions as this breakout develops.

Trading Gold with Leverage: Smart or Dangerous?XAUUSD trading (Gold vs. US Dollar) is a popular choice among global traders due to its high liquidity, strong volatility, and profit potential. One of the tools that help traders amplify their returns is financial leverage. However, using leverage also carries significant risks if not managed properly. So, what exactly is leverage in XAUUSD trading? Should you use it? Let’s explore the advantages and disadvantages below.
1. What is Leverage in XAUUSD Trading?
Leverage is a financial tool that allows traders to control a larger position in the market than the capital they actually own. For example, with 1:100 leverage, you only need $1,000 to trade a position worth $100,000.
In the XAUUSD market, brokers often offer leverage ranging from 1:50 to 1:500, or even up to 1:2000—depending on their risk policies and regulations.
2. Pros of Using Leverage in XAUUSD Trading
🔹 Amplifies Potential Profits
Leverage allows traders to maximize profits with a relatively small amount of capital. When the market moves in the expected direction, the gains can be multiplied significantly.
🔹 Lower Capital Requirement
Instead of needing $10,000 to trade 1 lot of gold, a trader may only need $100–$500 depending on the leverage. This lowers the entry barrier and offers greater flexibility in capital management.
🔹 Enables Strategy Diversification
With the same amount of capital, traders can open multiple positions across different timeframes or strategies. Leverage allows for broader portfolio diversification while still maintaining control over total risk.
🔹 Takes Advantage of Short-Term Opportunities
Gold markets often react strongly to news and economic data. Leverage lets traders capitalize on short-term price swings, enabling faster profits without needing to hold positions long-term.
3. Cons and Risks of Using Leverage in XAUUSD Trading
Risk of Account Blowout
The higher the leverage, the lower the safety margin. A small market move against the position can trigger a margin call or stop-out, resulting in a full loss of the initial capital.
Emotional and Psychological Stress
High leverage often leads traders to gamble instead of follow a strategy, increasing the likelihood of emotional decisions and impulsive trading behaviors.
Difficult to Manage During Volatility
XAUUSD is a highly volatile asset, especially during U.S. sessions or major news releases (like CPI, Fed announcements, NFP). Over-leveraging can lead to rapid losses in seconds during sudden price spikes.
Increased Emotional Pressure
When using high leverage, every small fluctuation feels significant, causing stress and encouraging poor decisions—like exiting too early or revenge trading.
4. Conclusion: Should You Use Leverage in XAUUSD Trading?
Yes, but only with a disciplined and strategic approach.
Use moderate leverage (e.g. 1:100 or lower if you're a beginner)
Always set clear stop-loss and take-profit levels
Risk no more than 2% of your account per trade
Avoid “all-in” trades and don’t let emotions dictate position size
In Summary
Leverage in XAUUSD trading is a double-edged sword. Used wisely, it accelerates your profit potential. Used recklessly, it can wipe out your account in moments. The key is to trade with discipline, knowledge, and a solid plan to harness the power of leverage without falling into its traps.

10.06.25 Morning ForecastPairs on Watch -
FX:GBPJPY
FX:EURJPY
FX:USDCHF
A short overview of the instruments I am looking at for today, multi-timeframe analysis down to what I will be looking at for an entry. Enjoy!

Gold Price Analysis June 10Gold price reacted at the Trenline and EMA 34 yesterday and bounced back but still closed below the breakout zone of 3335.
The downtrend can still continue as long as 3335 remains strong today.
H4 shows the provincial port area at 3295 and 3275 in the opposite direction of the provincial port at 3339 and 3365.
H1 is still forming a clear downtrend. 3309 is the immediate resistance zone. is the price zone that can scalp breakout if it closes above this zone. break 3309 Gold will head to 3327 in this zone, if you want to SELL, you have to wait for confirmation from the selling candle. When the buyers push the price strongly through 3327, you have to wait for the US session resistance around 3338 yesterday. Resistance and support during the day are noted around 3275 and 3365

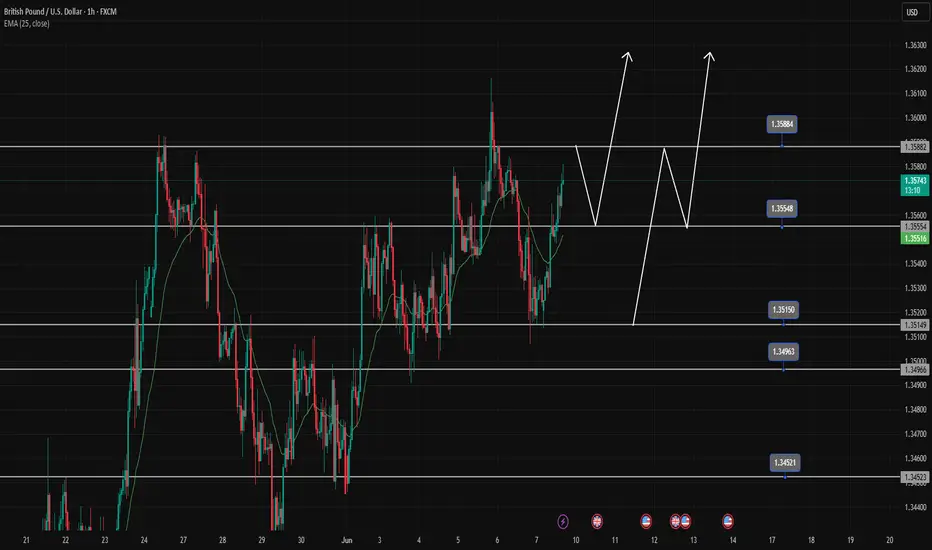
Buy opportunity when price retraces to break the topGBPUSD encounters resistance at 1.358, there is a high possibility that there will be a price reaction to 1.35500 to create a Dow break 1.358 towards higher levels.
GBPUSD is increasing very strongly again in the main trend, we wait for a retracement to the support zones, which is a strong buying opportunity.
1.358-1.355-1.351-1.345 are BUY zones when the price has a reaction of buying force at these price zones.
How to Use Fibonacci Extension for Effective ProfitHow to Use Fibonacci Extension for Effective Profit-Taking in Forex.
Fibonacci Extension is a powerful tool for identifying profit-taking levels in Forex, including XAU/USD trading. Here’s a concise, SEO-optimized guide to maximize your gains:
1. Understand Fibonacci Extension Levels
The 127.2%, 161.8%, and 261.8% extension levels predict price targets after a breakout, making them ideal for setting profit goals.
2. Identify Key Price Swings
Select swing low (e.g., 3.300 USD), swing high (e.g., 3.344.70 USD), and retracement low (e.g., 3.312.570 USD) on the chart.
3. Apply Fibonacci Extension
Draw from swing low to high, then extend from the retracement low. For example, 161.8% may project to approximately 3.360 USD.
4. Set Profit-Taking Targets
Conservative: Target 127.2% (e.g., 3.350 USD).
Aggressive: Aim for 161.8% (e.g., 3.360 USD), aligning with resistance levels.
5. Manage Risk
Place a stop-loss below the retracement low (e.g., 3.300 USD) and aim for a 1:2 risk-reward ratio.
6. Pro Tips
Combine with resistance, RSI, or volume; exit early if momentum fades. Update levels with new swings.
Leverage this strategy to optimize profits in volatile Forex markets like XAU/USD!

What is a Fibonacci Sequence and Its Application in Forex?What is a Fibonacci Sequence?
The Fibonacci sequence is a series of numbers where each number is the sum of the two preceding ones, typically starting with 0 and 1 (e.g., 0, 1, 1, 2, 3, 5, 8, 13, 21, ...). In trading, the Fibonacci retracement levels are derived from key ratios (23.6%, 38.2%, 50%, 61.8%, and 100%) based on this sequence. These levels are used to identify potential support and resistance zones where price reversals or continuations may occur.
Application in Forex
In Forex trading, Fibonacci retracement is a popular technical analysis tool applied to chart price movements to predict future price action:
- Identifying Support and Resistance**: Traders draw Fibonacci levels between a significant high and low on a chart. For example, after a price drop, the 61.8% retracement level often acts as support where the price might bounce back.
- Entry and Exit Points**: Forex traders use these levels to determine optimal entry points (e.g., buying near a 50% retracement) or exit points (e.g., taking profit near a 23.6% retracement after a rally).
- Stop-Loss and Take-Profit**: Fibonacci levels help set stop-loss orders below support (e.g., below 61.8%) or take-profit targets near resistance (e.g., 38.2% or 50%).
- Trend Confirmation**: In a downtrend, if the price retraces to the 38.2% level and resumes falling, it confirms the bearish trend. Conversely, a break above this level in an uptrend may signal bullish momentum.
Example in Practice
On the XAU/USD chart, if the price drops from 3.344.70 USD to 3.312.570 USD, Fibonacci levels can be plotted. The 38.2% retracement might fall around 3.330 USD, serving as a potential support zone for traders to watch.

USD/JPY Short, AUD/NZD Short, AUD/JPY Neutral and EUR/USD ShortUSD/JPY Short
Minimum entry requirements:
- If tight non-structured 5 min continuation forms, reduced risk entry on the break of it.
- If tight structured 5 min continuation forms, reduced risk entry on the break of it or 5 min risk entry within it.
- If tight non-structured 15 min continuation forms, 5 min risk entry within it if the continuation is structured on the 5 min chart or reduced risk entry on the break of it.
- If tight structured 15 min continuation forms, reduced risk entry on the break of it or 15 min risk entry within it.
AUD/NZD Short
Minimum entry requirements:
- If tight non-structured 15 min continuation forms, 5 min risk entry within it if the continuation is structured on the 5 min chart or reduced risk entry on the break of it.
- If tight structured 15 min continuation forms, reduced risk entry on the break of it or 15 min risk entry within it.
AUD/JPY Neutral
Minimum entry requirements:
- If structured 1H continuation forms, 1H risk entry within it.
Minimum entry requirements:
- 1H impulse down below area of value.
- If tight non-structured 5 min continuation follows, reduced risk entry on the break of it.
- If tight structured 5 min continuation follows, reduced risk entry on the break of it or 5 min risk entry within it.
- If tight non-structured 15 min continuation follows, 5 min risk entry within it if the continuation is structured on the 5 min chart or reduced risk entry on the break of it.
- If tight structured 15 min continuation follows, reduced risk entry on the break of it or 15 min risk entry within it.
EUR/USD Short
Minimum entry requirements:
- Tap into area of value.
- 1H impulse down below area of value.
- If tight non-structured 15 min continuation follows, 5 min risk entry within it if the continuation is structured on the 5 min chart or reduced risk entry on the break of it.
- If tight structured 15 min continuation follows, reduced risk entry on the break of it or 15 min risk entry within it.

Gold Price XAU/USD: Downtrend and OpportunitiesGold FX:XAUUSD Price XAU/USD Analysis Today: Downtrend Signals, What Opportunities for Investors? Updated at 13:57 on 09/06/2025 (+07) - The 1-hour trading view chart for the XAU/USD (Gold Spot / U.S. Dollar) pair indicates that gold prices are experiencing a significant decline, drawing attention from investors. Let’s dive into a detailed analysis of the current trend and short-term outlook based on the latest data.
Current Gold Price and Recent Movements According to the chart, the spot gold price is currently fluctuating around 3.322.44 USD/ounce, down 0.24% in the latest trading session (as of 13:56 UTC-7). The highest point in the past hour reached 3.323.020 USD, while the lowest was 3.312.570 USD. A clear downtrend began from a local peak near 3.344.70 USD, with dominant red candlesticks reflecting strong selling pressure.
Technical Analysis Support and Resistance: The nearest support level is around 3.300 USD, where the price may find buying interest to rebound. The next key resistance level is 3.350 USD, a threshold that the price has failed to break in the recent session. If selling pressure persists, a deeper support level could be 3.280 USD. Trading Volume: Trading volume spiked during the decline, particularly between 6 AM and 7 AM (UTC), indicating significant participation from investors offloading their positions. Market Momentum: The price is currently below the short-term moving average, signaling a bearish trend in the short term. However, if the price holds above 3.300 USD, it could open opportunities for a recovery toward 3.330-3.350 USD. Factors Influencing Gold Prices Recent U.S. economic data, particularly the non-farm payrolls report, may be the primary driver behind the pressure on gold prices. A stronger U.S. dollar and rising bond yields have reduced gold’s appeal. Additionally, global market sentiment, including geopolitical factors and the upcoming CPI data release on June 11, 2025, will also impact the next trend.
Outlook and Investment Suggestions Short-Term: With the current decline, investors might consider buying in the support zone of 3.300 USD if reversal signals appear (e.g., a strong bullish candlestick or increased buying volume). However, caution is advised if the price breaks below 3.280 USD. Long-Term: The bullish trend for gold remains intact due to demand from central banks and its role as a safe-haven asset. This could be an opportunity to accumulate if the price corrects further. Conclusion The XAU/USD gold price is facing downward pressure in today’s trading session, but the 3.300 USD support level is a critical point to watch closely. Investors should combine technical analysis with economic news to make informed decisions. Stay updated regularly to seize opportunities in this volatile market!
SEO Keywords: Gold price today, XAU/USD analysis, gold price forecast 2025, gold investment, gold support and resistance, latest gold news.

09.06.25 Morning ForecastPairs on Watch -
FX:USDJPY
FX:AUDNZD
FX:AUDJPY
FX:CHFJPY
A short overview of the instruments I am looking at for today, multi-timeframe analysis down to what I will be looking at for an entry. Enjoy!

GBPJPY - Major Resistance Zone Threatens Further UpsideThe GBP/JPY 4-hour chart reveals the pair is approaching a critical resistance zone around the 196.00-196.50 level, marked by the upper boundary of the highlighted rectangular area, which represents a significant technical ceiling that has been tested multiple times over the past month. This resistance level coincides with previous swing highs and appears to be acting as a formidable barrier to further upside progress, suggesting that traders should exercise heightened caution as selling pressure is likely to intensify in this area. The pair's recent rally from the May lows around 190.50 has been impressive, but the multiple rejections from this upper resistance zone indicate that institutional sellers may be positioned to defend these levels aggressively. Given the historical significance of this resistance area and the potential for profit-taking after the substantial advance, market participants should be prepared for increased volatility and possible reversal signals as the pair approaches or tests this key technical barrier, making risk management particularly crucial at current levels.
Disclosure: I am part of Trade Nation's Influencer program and receive a monthly fee for using their TradingView charts in my analysis.

XAUUSD - $3,260 Support Level to Determine Next Directional MoveLooking at this Gold 4-hour chart, the precious metal is approaching a critical inflection point as it tests the key support zone around $3,260, which represents a confluence of previous swing lows and represents the lower boundary of the recent consolidation range. Two distinct scenarios emerge from this technical setup: first, gold could find buyers at this support level and stage a bounce back toward the $3,400 resistance area, particularly if broader market conditions favor safe-haven assets or if dollar weakness provides additional tailwinds for the metal. Alternatively, a decisive break below the $3,260 support could trigger further selling pressure and open the door for a deeper correction toward the $3,180-$3,160 zone, especially if risk appetite improves or if stronger economic data reduces demand for defensive assets. The outcome will largely depend on how price action unfolds at this crucial support level, with volume and momentum providing key clues about which scenario is more likely to play out in the near term.
Disclosure: I am part of Trade Nation's Influencer program and receive a monthly fee for using their TradingView charts in my analysis.

BTCUSD - Technical Setup Points to Renewed UpsideLooking at this Bitcoin/USD daily chart, the technical setup strongly favors upside continuation despite the recent pullback from the $113,000 highs. The cryptocurrency has demonstrated remarkable resilience by maintaining support above the $100,000 psychological level after its dramatic surge from the March lows around $60,000, representing an 80%+ rally that established a clear bullish trend structure. The current consolidation pattern around $104,000 appears to be a healthy correction within the broader uptrend, with the green arrow projection suggesting potential for further gains toward the $115,000+ region. Key supporting factors include the sustained break above multiple resistance levels, the formation of higher lows throughout the uptrend, and the relatively shallow nature of the current pullback compared to the magnitude of the preceding advance. While short-term volatility remains elevated, the overall momentum and trend structure indicate that buyers are likely to step in on any weakness, making a resumption of the uptrend the higher probability scenario.
Disclosure: I am part of Trade Nation's Influencer program and receive a monthly fee for using their TradingView charts in my analysis.

CAD/JPY "Loonie-Yen" Forex Bank Bullish Heist Plan🌟Hi! Hola! Ola! Bonjour! Hallo! Marhaba!🌟
Dear Money Makers & Robbers, 🤑 💰💸✈️
Based on 🔥Thief Trading style technical and fundamental analysis🔥, here is our master plan to heist the CAD/JPY "Loonie-Yen" Forex Bank. Please adhere to the strategy I've outlined in the chart, which emphasizes long entry. Our aim is the high-risk Red Zone. Risky level, overbought market, consolidation, trend reversal, trap at the level where traders and bearish robbers are stronger. 🏆💸Book Profits Be wealthy and safe trade.💪🏆🎉
Entry 📈 : "The vault is wide open! Swipe the Bullish loot at any price - the heist is on!
however I advise to Place buy limit orders within a 15 or 30 minute timeframe most recent or swing, low or high level for pullback entries
Stop Loss 🛑:
Thief SL placed at the recent / nearest low level Using the 30Min timeframe (104.800) swing trade basis.
SL is based on your risk of the trade, lot size and how many multiple orders you have to take.
🏴☠️Target 🎯: 106.000 (or) Escape Before the Target
🧲Scalpers, take note 👀 : only scalp on the Long side. If you have a lot of money, you can go straight away; if not, you can join swing traders and carry out the robbery plan. Use trailing SL to safeguard your money 💰.
CAD/JPY "Loonie-Yen" Forex Market Heist Plan (Scalping / Day Trade) is currently experiencing a bullishness,., driven by several key factors.☝🏻👆🏻☝🏻👆🏻
📰🗞️Get & Read the Fundamental, Macro, COT Report, Quantitative Analysis, Sentimental Outlook, Intermarket Analysis, Future trend targets..., go ahead to check 👉👉👉🔗
📌Keep in mind that these factors can change rapidly, and it's essential to stay up-to-date with market developments and adjust your analysis accordingly.
⚠️Trading Alert : News Releases and Position Management 📰 🗞️ 🚫🚏
As a reminder, news releases can have a significant impact on market prices and volatility. To minimize potential losses and protect your running positions,
we recommend the following:
Avoid taking new trades during news releases
Use trailing stop-loss orders to protect your running positions and lock in profits
💖Supporting our robbery plan 💥Hit the Boost Button💥 will enable us to effortlessly make and steal money 💰💵. Boost the strength of our robbery team. Every day in this market make money with ease by using the Thief Trading Style.🏆💪🤝❤️🎉🚀
I'll see you soon with another heist plan, so stay tuned 🤑🐱👤🤗🤩

GBPUSDHI
According to our style, we should wait for the formation of a pivot to confirm the bullish trend.

Gold Market Update Ahead of US Jobs Data
On Friday, gold edged up slightly ahead of key US jobs data (NFP). Optimism over a US-China deal and USD profit-taking are capping gold’s gains. A weak NFP (<100,000) would bolster expectations of a Fed rate cut (54% chance in September), supporting gold, while a strong NFP (>200,000) would pressure it downward.
Technically, the market is bullish, with prices consolidating in the 3300-3340 range after breaking resistance. A shakeout at support is possible before the trend resumes.
Resistance: 3375, 3391, 3414
Support: 3339, 3331
Forecasting prices before NFP is tough, so it’s best to wait for the data and monitor price reactions. Prices may stay range-bound until next week, depending on fundamentals.
Best regards,

Harmonic AB=CD Pattern Guide for TradingViewThe Harmonic AB=CD pattern is a powerful technical analysis tool used to predict price reversals in financial markets. Based on Fibonacci ratios, it helps traders identify high-probability entry and exit points. This concise guide is designed for TradingView users to apply the pattern effectively.
Pattern Overview
- Structure: Four points (A, B, C, D). AB and CD legs are equal in length or follow Fibonacci ratios.
- Fibonacci Ratios:
- BC retraces 61.8%-78.6% of AB.
- CD equals AB (1:1) or extends 1.272/1.618 of BC.
- Types:
- Bullish: Signals a buy at point D (price rises).
- Bearish: Signals a sell at point D (price falls).
How to Identify and Trade
1. Spot AB: Find a clear price swing from A to B.
2. Measure BC: Use TradingView’s Fibonacci Retracement tool to confirm BC retraces 61.8%-78.6% of AB.
3. Project CD: Use Fibonacci Extension to project CD, matching AB’s length or extending 1.272/1.618 of BC.
4. Confirm D: Check for confluence with support/resistance, candlestick patterns (e.g., doji), or indicators (e.g., RSI divergence).
5. Trade Execution:
- Bullish: Buy at D, set stop-loss below D, target point C or A.
- Bearish: Sell at D, set stop-loss above D, target point C or A.
Tips for TradingView
- Use TradingView’s Fib tools for precision.
- Confirm signals with additional indicators (e.g., MACD, volume).
- Avoid choppy markets; focus on trending or range-bound charts.
The AB=CD pattern is a reliable method for spotting reversals when used with proper confirmation. By mastering Fibonacci tools on TradingView and combining the pattern with other signals, traders can enhance their decision-making and improve trade outcomes. Practice on historical charts to build confidence.

What are Harmonic Price Patterns?Harmonic price patterns are chart patterns based on Fibonacci ratios and market geometry, used to identify potential reversal points in Forex. They rely on Fibonacci levels (e.g., 0.618, 0.786, 1.618) to measure price structures, predicting reversal zones (PRZ - Potential Reversal Zone).
Key Features:
- Based on Fibonacci ratios.
- Geometric structure with 4-5 points (X, A, B, C, D).
- Identifies PRZ for buy/sell opportunities.
- Symmetrical, reflecting market psychology.
Key Harmonic Patterns in Forex:
1. Gartley:
- AB retraces 61.8% of XA.
- D at 78.6% of XA.
- Buy/sell at D.
2. Bat:
- AB retraces 38.2-50% of XA.
- D at 88.6% of XA.
- High-precision at D.
3. Crab:
- CD extends 161.8% of XA.
- D at extreme levels.
- Suited for strong volatility.
4. Butterfly:
- AB retraces 78.6% of XA.
- D extends 127-161.8% of XA.
- End of strong trends.
5. Shark:
- AB retraces 113-161.8% of XA.
- D at 88.6-113% of XA.
- Volatile markets.
6. Cypher:
- CD retraces 78.6% of XC.
- Short-term timeframes.
How to Use:
1. Measure Fibonacci ratios to identify the pattern.
2. Locate PRZ at D, combine with support/resistance, RSI, or candlestick patterns.
3. Set stop-loss beyond PRZ, aim for risk/reward ≥ 1:2.
4. Enter trades at D after price/indicator confirmation.
Notes:
- Requires precise measurements.
- Combine with other tools for reliability.
- Practice on a demo account first.
- Avoid during high-volatility events (e.g., news releases).
Let me know if you need details on a specific pattern!

06.06.25 Morning ForecastPairs on Watch -
FX:EURUSD
FX:AUDUSD
FX:USDJPY
FX:AUDCAD
A short overview of the instruments I am looking at for today, multi-timeframe analysis down to what I will be looking at for an entry. Enjoy!


Gold Price Analysis June 63 D1 candles closed without breaking through 50% of the previous bullish main candle. Today's main view will be BUY up to 34xx
Today's resistance is around 3413 for the SELL strategy of the US Session. The Asian and European Session is looking for a BUY point. There was just a nice BUY beat around 3363 where the price swept liquidity to 3369.
3382 is the target for the BUY order and this area can SELL Scalp in today's Asian and European session because today's target is up to 3413.
In the direction of Gold Down, contrary to the analysis, the support zone 3341 and support 3324 will support the upward force of gold prices.
Breakout boundary zone 3382 and 3341. Note that the break out does not block the train
