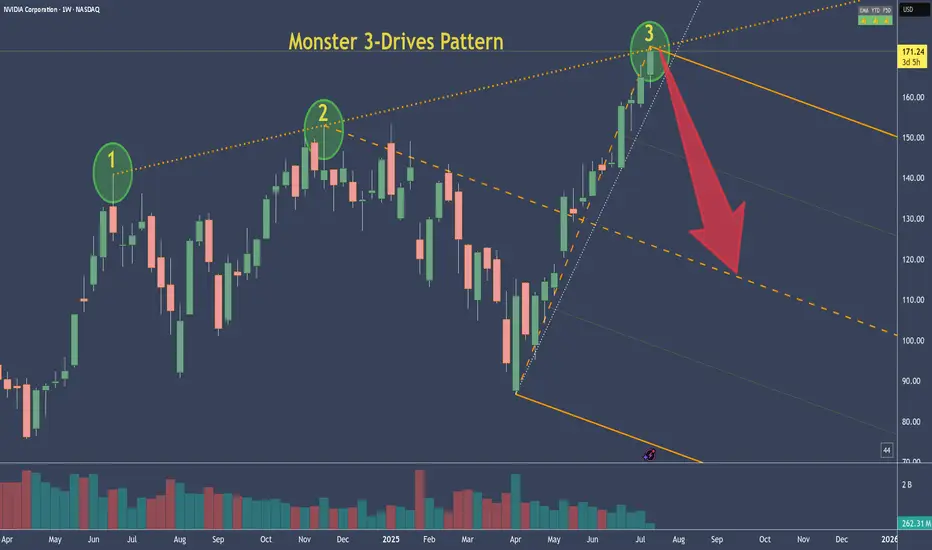
NVDA - NVIDIA's 3-Drive Pattern target if it plays outThis is the weekly chart of NVDA.
We can clearly see a 3-Drives pattern forming.
If this pattern plays out, the centerline would be my target. Of course, it's still too early to short.
But I’ve got my hunting hat on and I'm watching for signals on the daily chart.
One would be a break of the slanted trendline—but there are a couple of other conditions that need to align as well.
Always ask yourself: What if?
Trade-setup
SAFEMOON - Not so safe for the medium termIt looks as though there could be a fractal for SAFEMOON. Historiclally, we've seen rises like this but only to be dissapointed and for the trend to be reversed again. I've drawn out a blue line of what the most likely trajectory will occur. The only other alternative is that the upward trend will continue, buying action will surge and we will see a bursting through of the upper trend line and escape the channel. If it comes back within the channel momentarily, that's fine - but not if the volume dies down and we stay within. So, it doesn't look great for an investment and I wont be putting anyting into it. Follow for more.

Scenario on usdjpy 23.1.2025 The market has formed sfp above the high which gives me an idea of where the market could go the likely scenario is a return back to the price around 158 from where a rebound and return back to lower levels could follow

LTC - Loads more up to goI've had a lot of requests for custom analysis on LTC. Its looking strong within the channel and there's potential for lots more up to complete the X wave, which would still look corrective in a very straightforward looking ABC. I actually don't like LTC too much. It's slow, sluggish, doesn't keep up with market trends. But, it's looking strong for some more up. Follow and share for more.

BTC, higher highs incomingBTC has shown huge confidence in with a trendline breakout on price, volume and MACD is looking near vertical too. These are what I call signals that 'jive' together. I would never place a trade on one signal alone, I try and gain as many signals to jive as possible before risking any assets. It's great to see and that means we're within the long awaited wave 5 of larger degree of trend 1. Which, would see at least 135k. Exciting, high confidence here. Follow and share for more.

JAZZ downtrend intactWe can observe how the price continues to decline within the descending channel. Current pullback might present a solid RR selling opportunity.


EURPLN updated trade ideaPreviously we shared EURPLN short trade setup, which was closed at break even. This time is a new setup with different downside target.

Premium Long Trade Setup: DUSKUSDTToday, I’m excited to share our premium long trade setup for DUSKUSDT. Let’s start by focusing on the critical $1.45 support level, where we observed a clean rejection of the 161.8% Fibonacci support. This rejection is a strong positive signal, indicating a potential trend reversal for DUSK.
Currently, we see the completion of a 5-wave move to the upside, which confirms that this rally is not merely an ABC correction. With the 5-wave structure complete, it’s logical to anticipate an ABC correction to the downside.
We’ve strategically placed our buy limit order at $0.2211, offering a robust 1:3 risk-reward opportunity. Additionally, we’ve set three upside targets. Upon reaching the first target, we plan to secure 50% of the profit and simultaneously eliminate the trade’s risk. This approach allows us to manage the trade with confidence, knowing that we’re in a strong position for potential gains.
Let’s monitor this setup together and enjoy the process. Happy trading!


Prime Opportunity: Golem (#GLMUSDT) Major Bullish Move!I’m excited to share a trade setup for my favorite coin at the moment: Golem (#GLMUSDT).
Both the GLMUSDT and GLMBTC pairs are showing extremely bullish potential, and the price action is aligning perfectly with our trading strategy.
Key Points:
*Elliott Wave Pattern: The current chart reveals a compelling Elliott Wave pattern. Notably, wave 5 hasn't commenced yet, presenting an excellent buying opportunity, especially with the recent completion of the ABC correction.
*Perfect Pullback: This recent pullback is exactly what I've been waiting for. It marks the end of the correction phase and the beginning of a potential new upward movement.
Trade Setup:
*Entry Triggered: Today, my trade setup was triggered, offering a solid 1:3 risk/reward ratio. The current setup is highly favorable for entering a long position, capitalizing on the anticipated wave 5.
Conclusion:
Bullish Outlook: The bullish sentiment for Golem is strong, and this setup provides a promising opportunity for substantial gains. If you follow this trade, you might be thanking me later.
Happy trading!

Bullish trade setup in REC LtdThere are 2 points to be noticed in the daily chart of REC Ltd
1. There was a breakout from the downtrend on 26th April
2. The resistance was broken on 2nd May but then we saw a selling pressure in the stock but the candle made today is a decent bullish candle and this could be a breakout as well.
Can buy for targets of 570 & 590.
Educational purpose only

EURUSD Top Down Analysis Long Term BearishWe see that the pair is overwhelmingly bearish. But is there is chance for a little bit of bullishness in all of these...?
Watch the video to find out.

Anticipating Explosive Growth for SUIUSDT🔅SUIUSDT has showcased significant respect for the $0.51 demand zone, highlighting a crucial support level within the price action. Concurrently, a notable surge in volatility suggests an imminent explosive move in the near future. Analyzing the current price dynamics, particularly the bounce observed from the demand area coupled with the formation of higher highs (HHs) and higher lows (HLs) pattern, strengthens our expectation for a substantial growth surge.
🔅Our upside target aligns with the 78.6% Fibonacci retracement level, correlating with a previously established supply area. Achieving this target could result in a robust 50% gain. We've already shared our comprehensive trade setup in our channel, positioning ourselves to capitalize on this potential opportunity.

Hit All TPs, 13.47% to 269.4% in 3 daysOK guys, Hit All TPs and this are profits:
Spot and 1X Future: +13.47%
2X: +26.94%
3X: +40.41%
4X: +53.88%
5X: +67.35%
10X: +134.7%
20X: +269.4%
This is the power of SRM.
If you want to hold it (10 - 20% of your position) I'll tell you new TPs.

OGNUSDT View on Projected 150% UpsurgeOGNUSDT exhibits a clear uptrend pattern with consistent higher highs (HHs) and higher lows (HLs). The price maintains respect for the uptrend trendline, with the Demand/Supply zone transitioning into a reliable support area.
Our perspective suggests a substantial potential price increase for OGN, positioning it as one of our top coins for investment currently. Not financial advice, but our view indicates the potential for over a 150% surge in the coming months.

AAVEUSDT 100% UpsideAAVEUSDT has established a significantly vast demand zone adjacent to the $50 psychological level, consistently respected over four consecutive instances, emphasizing substantial buying pressure within this zone. Preceding the recent bounce, AAVE broke above a downtrend trendline, signaling readiness for further upside potential. Subsequent to a robust correction and the last retest of the $50 support, a formation of higher highs and higher lows has become evident, indicating a bullish reversal.
The $80 supply zone has transformed into a demand area, witnessing a bounce off the average-price uptrend trendline. Presently, AAVEUSDT appears poised to initiate a significant rally. Overall, our projections anticipate a 100% price surge from the most recent demand area. This surge is aimed towards the 361.8% Fibonacci retracement level, aligning with the top of the extended ascending channel.

USDJPY Looking BearishOn the Monthly chart, this pair is currently retracing bearish inside a Bullish PB.
On the Weekly, we can see that this pair is in a large bearish grind. We sent out a bearish analysis a few weeks back. If you didn't see it, be sure to take a look at it.
Let's go further down in our analysis of this pair.
On the Daily Chart, this pair has continued its bearish push, and it is currently holding 3 PBs to the downside. The story is not different on the 4-hour chart. The market is making 5 PB down on the 4 hour chart, and 4 PB down on the 1 hour chart. It is not very often to find a pair that aligns on bias across all of its timeframes. Here is a rare exception.
To take our trade, we will be waiting for price to retrace bullish into our refined zone. When that happens, we will look to jump on the trade using the Panz Pips trader checklist.

Near 1000 Pip Dip ExpectedThe EURUSD has been pushing bullish for a while now. On the Weekly chart, we see that the market has been in a down swing that started on July 17, 2023. The market dipped to form a low at 1.0446, following which it began to retrace bullish on October 4.
Since October until now, the market has gone through a bullish retracement. Upon seeing the retracement, we were able to find and mark our order block and refine it to the expected reversal zone.
Last week saw prices come into our zone and push away in a bid to commence the reversal. If this perspective holds, this pair is expected to dip all the way down to take out the liquidity target at 1.4663 and push beyond it.
This down extension push is expected to give us a push in excess of 700 pips and can push as far as 1000 pips and more.

SUSHIUSDTBullish Bias and Potential 70% Price SurgeSUSHIUSDT recently marked a decisive break above a descending channel, signaling a significant shift in price dynamics. Preceding this breakout, the price consistently respected both a minor and a major demand zone, indicating robust bullish pressure within the market. Further reinforcing this bullish bias is the clear bounce observed from a simple uptrend trendline, coupled with a distinct formation of higher highs (HHs) and higher lows (HLs) pattern.
Considering these bullish confirmations, there's a higher probability of the uptrend's continuity, potentially leading the price towards a massive supply zone formed back in 2022. Upon reaching this supply zone, it could signify a noteworthy 70% price increase for SUSHI.

FXSUSDT Bullish Signals and Price Surge ExpectationsFXSUSDT has recently demonstrated compelling bullish movements, showcasing a transformation of two previous supply zones into demand areas. This shift, coupled with the presence of a consistent higher highs and higher lows pattern, reaffirms the underlying bullish trend.
Anticipating an over 80% surge in the coming weeks, today might mark the inception of the anticipated uptrend. The combination of these bullish signals suggests a strong potential for substantial growth in the near term.

SXPUSDT Double Fibonacci Resistance and Potential GainsSXPUSDT showcases a transition from supply to demand zones, successfully respected within its price action. Notably, the bounce off the 61.8% Fibonacci retracement level, coupled with the subsequent rebound from the 38.2% support and the clean bounce off the simple uptrend trendline, indicates the initiation of an upward wave.
As a result, our forecast anticipates SolarNetwork to persist in its upward trajectory towards the double Fibonacci resistance area near $0.54. Should this level be attained, traders and investors could secure a solid 30% gain.

XRPUSDT at least 20% UpsurgeXRPUSDT appears poised for a potential jump, evident in its adherence to the uptrend trendline and critical demand zone near $0.56. The recent decisive bounce off the 78.6% Fibonacci support amplifies the probability of a rapid upside swing.
Our trade signal suggests a swift movement towards the $0.73 resistance area, supported by a double Fibonacci level. Should this scenario unfold, Ripple might witness a minimum 20% price increase.
