LIMIT ORDER - TUT/USDTLIMIT ORDER - $TUT/USDT
Direction: #Long 🟢
Entry Price: 0.02494
Stop Loss: 0.020896
Target 1: 0.028031
Target 2: 0.031122
Target 3: 0.034213
Target 4: 0.037304
Target 5: 0.040395
Trade

LIMIT ORDER - #EOS/USDTLIMIT ORDER - $EOS/USDT
Direction: #Short 🔴
Entry Price: 0.766
Stop Loss: 0.85406
Target 1: 0.70734
Target 2: 0.64868
Target 3: 0.59002
Target 4: 0.53137
Target 5: 0.47271

BITCOINS BIG MOVE IS COMING! I hope you guys did enjoy this trade idea; feel free to comment down below if you have any questions or comments.

EURUSD update 20.03After a successful swing long
that was taken
We've reached external liquidity
Now, I expect a correction to the green box; from it, we will go even higher—reaching liquidity from above.
The current correction will take some time to form. It may happen faster, but I have indicated the targets on the chart.
Best regards EXCAVO

Gold Analysis April 4Gold is pushing up to 3116 at the end of the European session. If it breaks this zone, the possibility of an uptrend is high and heading towards 3134. Pay attention to 3080 for BUY zones in the US session and today's main BUY zone is around the 3065 price zone. Money management is the time you survive with the market.

XAUUSD / GOLD | 15M | BULL | SCALPING TIMEHey There My Friend
SIGNAL ALERT
🚨BUY ( GOLD & XAUUSD ) 3091,0 / 3078,0 / 3066,0 / 3053,0
🟢TP1: 3093,0
🟢TP2: 3096,0
🟢TP3: 3156,0
🔴SL: 3043,0
High Risk - Yüksek Risk
Hey Guys, Please don't forget to like 🙏🏻

IS THE GLOBAL “BIG SHORT” ON ITS WAY?TRADE WAR WARNING – IS THE GLOBAL “BIG SHORT” ON ITS WAY?
In the last 24 hours, global financial markets were rattled after Donald Trump unveiled a sweeping set of new global tariffs. This wasn’t just a political move — it may well mark the beginning of a new wave of global economic instability.
Markets across the board took a hit:
📉 US, European, and Asian equities
📉 Gold (XAU/USD), the US Dollar Index (DXY), and even crypto — all plunged into the red.
🔍 So, What Actually Happened?
Gold dropped by over 100 points in a single session — and strangely, the US dollar also fell.
Normally, a weaker USD would support gold. So why did gold sell off this time?
➡️ One likely explanation is that institutional investors sold gold positions to cover losses in equity markets, or to free up margin amidst the chaos.
📉 This wasn’t just a correction — it might be the early signal of a global BIG SHORT forming across multiple asset classes.
🧨 The Start of Something Bigger?
Markets aren’t just reacting to tariffs. They’re pricing in the risk of a full-scale trade war, which could disrupt global supply chains and hammer corporate earnings.
Industries like construction, healthcare, logistics, and manufacturing are already showing signs of strain.
If this escalates, we could be looking at something far more serious than a short-term sell-off.
📉 The Data Doesn’t Look Great Either
While inflation in the US continues to cool, other key data points are deteriorating:
ISM Services PMI (March): 50.8 (vs 53.0 expected)
Employment sub-index: 46.2 (down sharply from 53.9)
New orders, export orders and backlogs also fell
👉 These are real signs of economic slowdown, especially considering that services make up over 70% of the US economy.
🧠 Market Sentiment: FOMO, Fear, and Panic
At the moment, it’s hard to ignore how unsettled sentiment has become.
Retail and institutional traders alike are acting on fear. And that’s dangerous.
🔔 Tonight’s Non-Farm Payrolls (NFP) report could either calm things down — or add more fuel to the fire.
🏦 Will the Fed Cut Rates Sooner?
Markets are rapidly shifting their expectations:
A rate cut could come as early as May or June 2025
Traders are now pricing in 2 to 4 cuts this year (previously just 2)
There’s now a strong chance the Fed pivots earlier than expected
If jobs data continues to soften, the Fed may have no choice but to act faster — despite core inflation not yet fully under control.
⚠️ Trading Strategy: Observation Over Action
Right now, your best position might be… no position.
"Sometimes, the most profitable trade is the one you don’t take."
This isn’t the time to chase wild price action.
It’s the time to prepare and plan with logic — not emotion.
📊 Key Technical Levels on XAU/USD
🔺 Resistance:
3110 – 3119 – 3136 – 3148 – 3167
🔻 Support:
3086 – 3075 – 3055 – 3040 – 3024
🟢 BUY ZONE: 3056 – 3054
SL: 3050
TP: 3060 – 3064 – 3068 – 3072 – 3076 – 3080
🔴 SELL ZONE: 3148 – 3150
SL: 3154
TP: 3144 – 3140 – 3136 – 3132 – 3128 – 3124 – 3120
💬 Final Thoughts
The combination of tariffs, recession fears, and rate cut speculation is building into what could become a perfect storm.
Gold is in the eye of that storm.
Now is not the time to panic — but to trade with clarity and control.
📌 Don’t let emotion drive your trades.
Stick to the chart. Stick to your plan. Protect your capital.
🧠 Patience is what separates the lucky from the consistently profitable.

USD/CAD(20250404)Today's AnalysisMarket news:
Countermeasures from many countries against the United States - ① It is reported that Europe will slow down the pace of tariff retaliation; EU member states will vote on countermeasures against US steel and aluminum tariffs on April 9; ② Macron said that the response to US tariffs will be larger than before, and called on French companies to suspend investment in the United States. France may plan to impose retaliatory tariffs on large US technology companies. ③ Canadian Prime Minister Carney: Canada will impose a 25% tariff on all cars imported from the United States that do not comply with the US-Mexico-Canada Agreement.
Technical analysis:
Today's buying and selling boundaries:
1.4147
Support and resistance levels:
1.4436
1.4328
1.4258
1.4036
1.3966
1.3858
Trading strategy:
If the price breaks through 1.4147, consider buying, the first target price is 1.4258
If the price breaks through 1.4036, consider selling, the first target price is 1.3966

Gold Analysis March 4Fundamental Analysis
Persistent concerns over the potential economic impact of US President Donald Trump’s tit-for-tat tariffs could act as a catalyst for the safe-haven precious metal.
Meanwhile, risk-off sentiment, coupled with expectations that a tariff-induced slowdown in the US economy could force the Federal Reserve (Fed) to resume its rate-cutting cycle early, has caused a sharp decline in US Treasury yields. This, in turn, has pushed the US dollar (USD) to its lowest level since October 2024 and helped limit the downside in non-yielding gold. Therefore, it would be prudent to wait for a sharp sell-off to confirm that XAU/USD has topped out.
Technical Analysis
Today’s trading range is likely to see a fairly high probability of a drop. If it breaks 3116, gold will find its way back to 3081. In case gold breaks the downward structure as analyzed in the upward direction, pay attention to the SELL zone around 3148-3150. Wishing everyone a successful trading day.

Gold Price Analysis April 2The D1 candle has a red candle and the selling pressure has started to take profit of Gold but it is still unclear.
The most recent H4 candle cluster shows 2 important price zones 3135 and 3108. Breaking this boundary will form a new trend.
Trading plan: Gold pushes to 3108 and does not break this zone in the European session, then BUY GOLD to 3124. At the end of the European session, if it breaks 3124, then keep the order to 3135 and 3164 in the US session if it breaks the resistance. If it breaks 3108, do not buy anymore but wait for Sell Break out 3108, target day 3084, pay attention to the price reaction at 3100 (resistance of last night's session). If 3100 is broken, then SELL DCA, not BUY at 3100. Scenario 2: Price does not return to 3108 first but to 3124 in the European session. If it is not broken, then SELL 3124 to 3108 and breaks the 3108 area in the US session, then the TP scenario is the same as scenario 1. If 3124 is broken, then 3135 waits for a breakout when it breaks, it will be better to SELL down today. (Note the SELL scalp point around 3142)

GBPAUD | SCALPING TIME | BUY NOW HEY THERE;
SIGNAL ALERT
BUY GBPAUD - 2,05048 / 2,04900
🟢TP1: 2,05221
🟢TP2: 2,05689
🟢TP3: 2,06374
🔴SL: 2,04570
RISK REWARD - 3,00
Please don't forget to like 🙏🏻

Trading opportunity for TELUSDTBased on technical factors there is a Buy position in :
📊 TELUSDT
🔵 Buy Now
🪫Stop loss 0.004500
🔋Target 0.006200
📏 R/R 1,7
💸RISK : 1%
We hope it is profitable for you ❤️
Please support our activity with your likes👍 and comments📝

Trading opportunity for GPSUSDTBased on technical factors there is a Buy position in :
📊 GPSUSDT
🔵 Buy Now
🪫Stop loss 0.02200
🔋Target 0.04300
📏 R/R 3,2
💸RISK : 1%
We hope it is profitable for you ❤️
Please support our activity with your likes👍 and comments📝

Trading opportunity for WUSDTBased on technical factors there is a Buy position in :
📊 WUSDT
🔵 Buy Now or Buy Stop by 0.89
🪫Stop loss 0.0740
🔋Target 0.1240
📏 R/R 4,2
💸RISK : 1%
We hope it is profitable for you ❤️
Please support our activity with your likes👍 and comments📝

Rocket Lab about to Fly! But which way?!Rocket Lab - NASDAQ:RKLB
Breakout = $26 🎯
Breakdown = $11.51 🎯
- Symmetrical Triangle
- Volume Shelf with Gaps above and below
- Bearish Wr% right now
- Price Gap below
Can go either way but I'm leaning bearish here.
Not financial advice

SPX500 Long at 55301. All timeframes are massively oversold due to the huge sell-off on Friday night
2. It is the start of the week, and it opened at the low, which tends to mean there would be some strength to go up
3. Unfortunately, I cannot check if there is a harmonic pattern due to technical difficulties.
4. This is at excellent support as it is at the year low
5. There is a lot of divergence due to this not being a long consolidation try to exit at M15 overbought
6. Stop loss below 5500

Will the Fear Gauge Flash Red?The Cboe Volatility Index (VIX), Wall Street's closely watched "fear gauge," is poised for a potential surge due to US President Donald Trump's assertive policy agenda. This article examines the confluence of factors, primarily Trump's planned tariffs and escalating geopolitical tensions, that are likely to inject significant uncertainty into the financial markets. Historically, the VIX has proven to be a reliable indicator of investor anxiety, spiking during economic and political instability periods. The current climate, marked by a potential trade war and heightened international risks, suggests a strong likelihood of increased market volatility and a corresponding rise in the VIX.
President Trump's impending "Liberation Day" tariffs, set to target all countries with reciprocal duties, have already sparked considerable concern among economists and financial institutions. Experts at Goldman Sachs and J.P. Morgan predict that these tariffs will lead to higher inflation, slower economic growth, and an elevated risk of recession in the US. The sheer scale and breadth of these tariffs, affecting major trading partners and critical industries, create an environment of unpredictability that unsettles investors and compels them to seek protection against potential market downturns, a dynamic that typically drives the VIX upward.
Adding to the market's unease are the growing geopolitical fault lines involving the US and both China and Iran. Trade disputes and strategic rivalry with China, coupled with President Trump's confrontational stance and threats of military action against Iran over its nuclear program, contribute significantly to global instability. These high-stakes international situations, fraught with the potential for escalation, naturally trigger investor anxiety and a flight to safety, further fueling expectations of increased market volatility as measured by the VIX.
In conclusion, the combination of President Trump's aggressive trade policies and the mounting geopolitical risks presents a compelling case for a significant rise in the VIX. Market analysts have already observed this trend, and historical patterns during similar periods of uncertainty reinforce the expectation of heightened volatility. As investors grapple with the potential economic fallout from tariffs and the dangers of international conflicts, the VIX will likely serve as a crucial barometer, reflecting the increasing fear and uncertainty permeating the financial landscape.

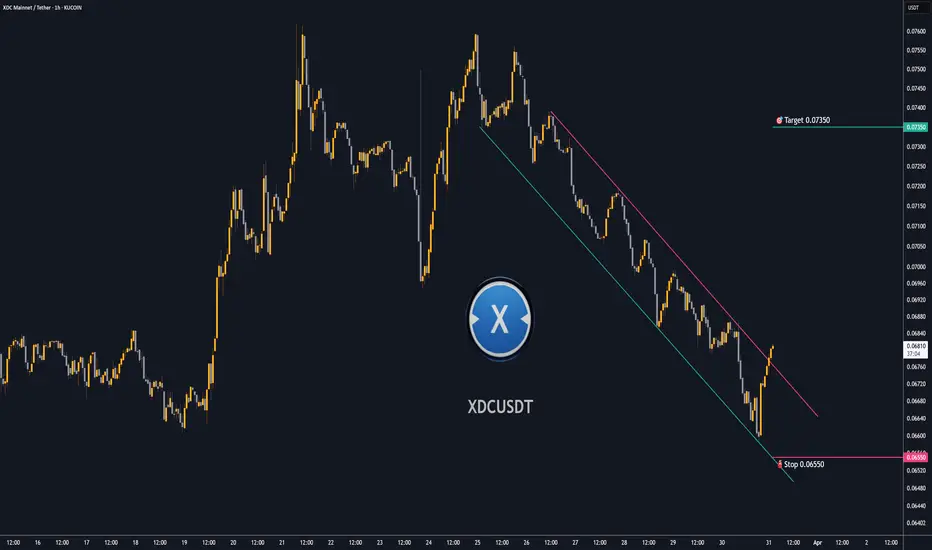
Trading opportunity for XDCUSDTBased on technical factors there is a Buy position in :
📊 XDCUSDT
🔵 Buy Now
🪫Stop loss 0.06550
🔋Target 0.07350
📏 R/R 2
💸RISK : 1%
We hope it is profitable for you ❤️
Please support our activity with your likes👍 and comments📝
EURUSD Buy Position 31 March 2025I am looking for buying opportunities on FOREXCOM:EURUSD chart. EUR is going well. On the other websites, they think about that EURUSD is going to hit 1.08550 level. I am also agree with them.
Time is a weapon. Be careful.
dzhvush

USDJPY - Critical area for the pair!The USD/JPY pair currently sits at a critical technical juncture, trading around the 149.84 level, where market participants are closely watching for directional cues. The price action has been respecting an ascending trendline since early March, suggesting underlying bullish momentum, while simultaneously testing the lower boundary of a significant resistance zone highlighted in blue on the chart. This confluence creates a decisive moment for traders – a break below the trendline could trigger another downward leg toward support near 149.00, while sustained strength above the current level might signal continuation of the uptrend toward the upper resistance band at 151.00. The chart's annotated projection suggests the possibility of one more pullback before resuming higher, making this a pivotal area for determining whether bears will gain temporary control or if bulls will maintain dominance without further consolidation.
Disclosure: I am part of Trade Nation's Influencer program and receive a monthly fee for using their TradingView charts in my analysis.

XAUUSD - Uptrend is strong, pullback for buysThe gold market is displaying remarkable strength, with the XAU/USD pair recently breaking above the $3,085 level to establish new historical highs. The upward trajectory has been supported by a robust ascending trendline dating back to late February, indicating persistent bullish momentum. While the immediate trend remains decidedly positive, technical indicators suggest a potential short-term correction may be forthcoming, which would likely present advantageous buying opportunities for traders. The highlighted support zone around $3,030-$3,040 could serve as an ideal entry point for those looking to establish long positions, with the expectation that after this healthy pullback, gold will resume its upward march toward the projected target of $3,100 and potentially beyond.
Disclosure: I am part of Trade Nation's Influencer program and receive a monthly fee for using their TradingView charts in my analysis.

Trading opportunity for GRASSUSDTBased on technical factors there is a Sell position in :
📊 GRASSUSDT
🔴 Sell Now
🪫Stop loss 1.9000
🔋Target 1.3200
📏 R/R 1,5
💸RISK : 1%
We hope it is profitable for you ❤️
Please support our activity with your likes👍 and comments📝

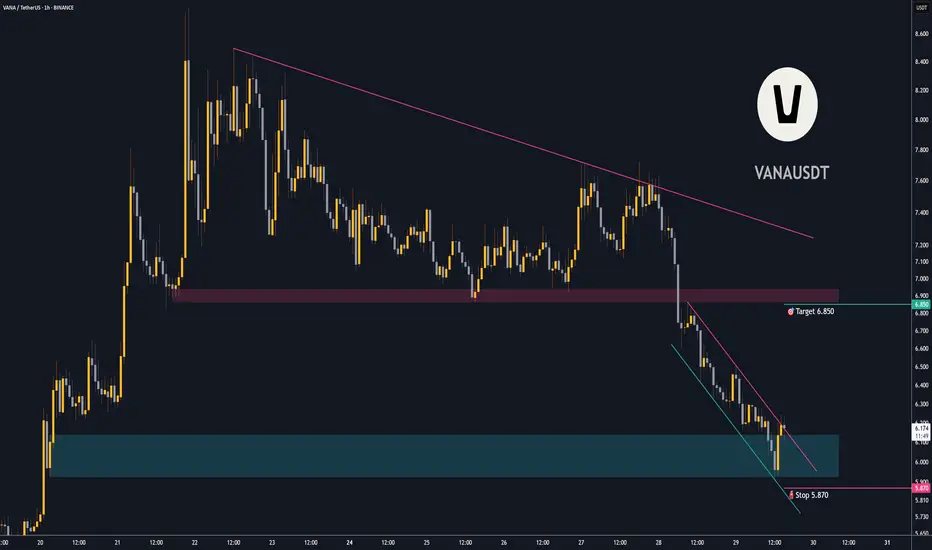
Trading opportunity for VANAUSDTBased on technical factors there is a Buy position in :
📊 VANAUSDT
🔵 Buy Now
🪫Stop loss 5.870
🔋Target 6.850
📏 R/R 2
💸RISK : 1%
We hope it is profitable for you ❤️
Please support our activity with your likes👍 and comments📝