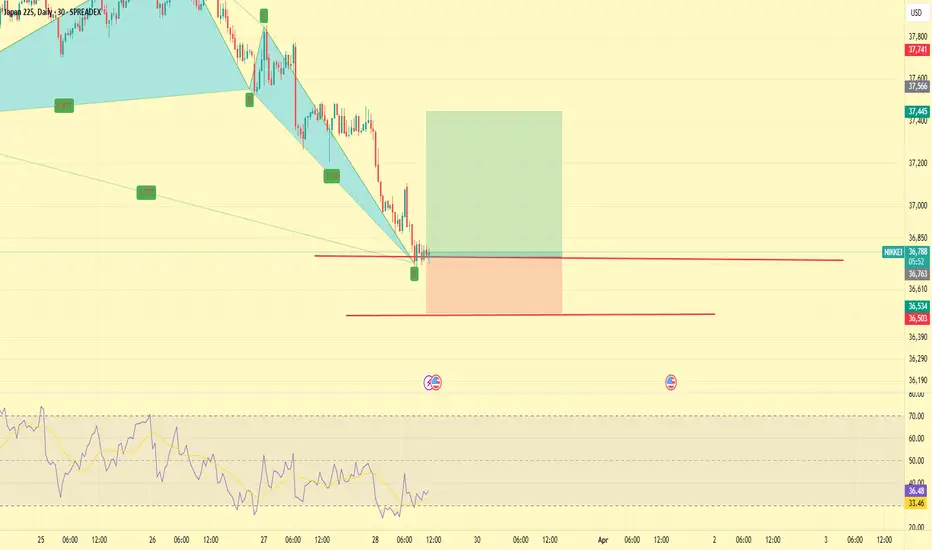
JPN225 Short 1. This trade is against the trend
2. There are multiple patterns on all timeframes
3. This trade is oversold on all timeframes
4. There is a triple bottom on M15 with divergence
5. 200 Pip stop loss
6. First target at M15 overbought since this is counter trend
Trade
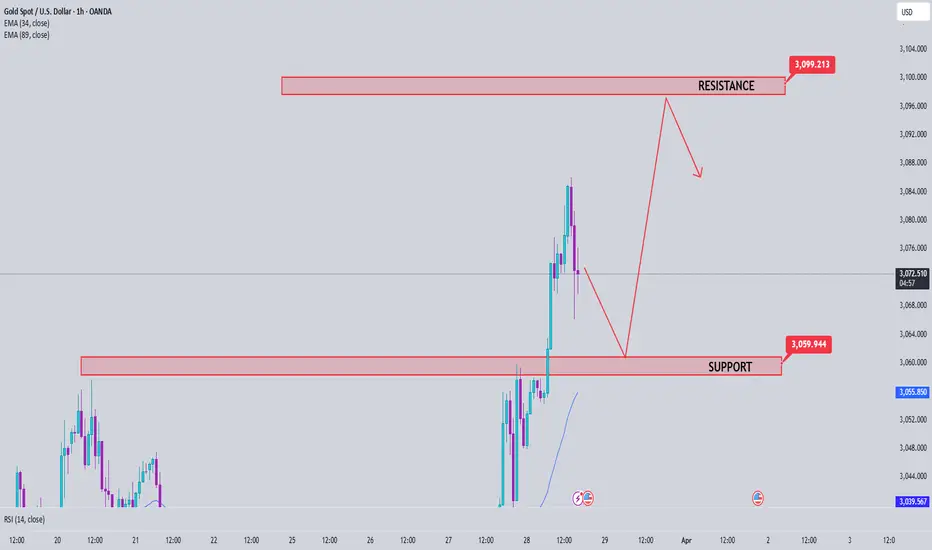
Gold Price Analysis March 28Fundamental Analysis
Gold (XAU/USD) continued its upward trend, hitting a record high of $3,086 during the European session on Friday. Global risk sentiment weakened due to concerns over US President Donald Trump's auto tariffs and uncertainty over upcoming tariffs, boosting safe-haven demand for gold.
In addition, expectations of an early Fed rate cut due to concerns over Trump's trade policies affecting US economic growth also supported gold's gains. Although the USD recovered slightly ahead of the US personal consumption expenditure (PCE) price index report, this did not reduce the appeal of XAU/USD.
Technical Analysis
Gold is quite difficult to trade around the ATH zone today. Note that the lower boundary zone of 3060 is converging with the EMA 34 zone and the SELL zone around the 3100 round-trip barrier. The basic trading strategy requires your patience as the market is not easy to trade at the moment.
28.03.25 Morning ForecastPairs on Watch -
FX:EURAUD
FX:AUDJPY
A short overview of the instruments I am looking at for today, multi-timeframe analysis down to what I will be looking at for an entry. Enjoy!

TAO SHORTDisclaimer 👉 This is my personal analysis for educational purposes , Buy/Sell/Trade at your own risk. I am not a financial Advisor

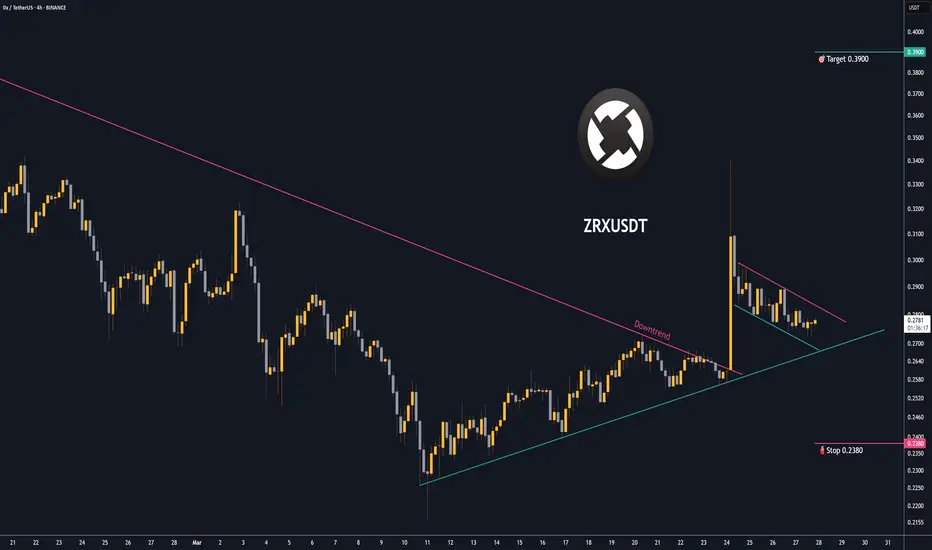
Trading opportunity for ZRXUSDTBased on technical factors there is a Buy position in :
📊 ZRXUSDT
🔵 Buy Now
🪫Stop loss 0.2380
🔋Target 0.3900
📏 R/R 2,7
💸RISK : 1%
We hope it is profitable for you ❤️
Please support our activity with your likes👍 and comments📝
Trading opportunity for Bitcoin BTCUSDT Based on technical factors there is a Buy position in :
📊 BTCUSDT
🔵 Buy Now
🪫Stop loss 85000.00
🔋Target 93000.00
📏 R/R 2,1
💸RISK : 1%
We hope it is profitable for you ❤️
Please support our activity with your likes👍 and comments📝

Trading opportunity for CTCUSDTBased on technical factors there is a Buy position in :
📊 CTCUSDT
🔵 Buy Now
🪫Stop loss 0.6100
🔋Target 0.9500
📏 R/R 2,2
💸RISK : 1%
We hope it is profitable for you ❤️
Please support our activity with your likes👍 and comments📝

Expecting 90k in BTCAs per daily chart, I'm expecting BTC to hit 90k and face resistance.
If that resistance is broken, we may see one more move towards ATH.
Given global instability, it's not that hard to imagine BTC becoming safe heaven.
There have been signs recently that BTC is getting bought in large QTY. So keeping fingers crossed and holding longs.

27.03.25 Morning ForecastPairs on Watch -
FX:NZDCAD
OANDA:XAGUSD
FX:NZDUSD
A short overview of the instruments I am looking at for today, multi-timeframe analysis down to what I will be looking at for an entry. Enjoy!

Trading opportunity for BIDUSDTBased on technical factors there is a Buy position in :
📊 BIDUSDT
🔵 Buy Now
🪫Stop loss 0.04350
🔋Target 0.08000
📏 R/R 2,6
💸RISK : 1%
We hope it is profitable for you ❤️
Please support our activity with your likes👍 and comments📝

Gold Analysis March 26Candle D still shows that the battle between buyers and sellers has not yet been defeated.
3033 Plays an important role in the current downtrend structure. H4 Closes above the 3033 zone, officially breaking the wave and giving priority to the BUY side.
Gold is pushing up and wants to break the dynamic resistance of 3027. Closes above 3027, gold is heading towards 3033-3035. If it does not break this zone, you can SELL to 3005 and if the US breaks 3005, hold to 2983. If the 3033 zone is broken, wait for BUY to break 3033, the daily target is towards 3045.

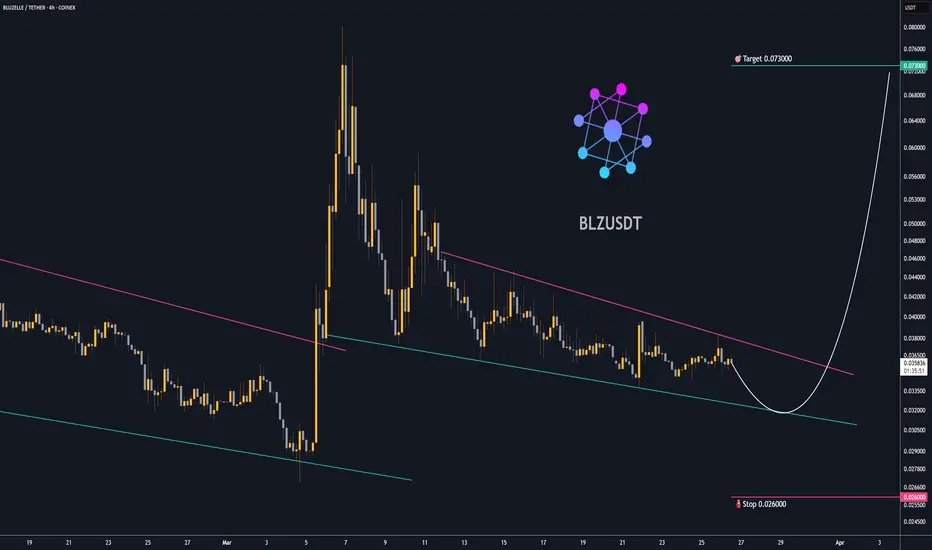
Trading opportunity for BLZUSDTBased on technical factors there is a Buy position in :
📊 BLZUSDT
🔵 Buy Now
🪫Stop loss 0.026000
🔋Target 0.073000
📏 R/R 3,8
💸RISK : 1%
We hope it is profitable for you ❤️
Please support our activity with your likes👍 and comments📝
26.03.25 Morning ForecastPairs on Watch -
OANDA:XAGUSD
FX:EURUSD
FX:NZDUSD
A short overview of the instruments I am looking at for today, multi-timeframe analysis down to what I will be looking at for an entry. Enjoy!

Trading opportunity for Tensor TNSRUSDTBased on technical factors there is a Buy position in :
📊 TNSRUSDT
🔵 Buy Now
🪫Stop loss 0.1950
🔋Target 0.2500
📏 R/R 2
💸RISK : 1%
We hope it is profitable for you ❤️
Please support our activity with your likes👍 and comments📝

Trading opportunity for AVAILUSDTBased on technical factors there is a Buy position in :
📊 AVAILUSDT
🔵 Buy Now
🪫Stop loss 0.03700
🔋Target 0.04700
📏 R/R 2
💸RISK : 1%
We hope it is profitable for you ❤️
Please support our activity with your likes👍 and comments📝

Gold Price Analysis March 25The D1 gold candlestick confirmed a clear decline. Some late-day buying pressure around 3000 pushed the gold price a bit.
H4 has formed a bearish wave with an important price of 3028. If H4 cannot break 3028 today, there will likely be a strong sell-off of gold at the end of the day.
Trading scenario. Gold is pushing up from the 3015 price zone. Target in the European session is 3027-3028. If this zone cannot be broken at the end of the session, SELL and hold at 3008. If the US confirms a break of 3008, hold at 2983. In case of a break of 3028, the sellers are weak. Be careful of false break of 3028. If the break is real, wait for 3035 to SELL today.
Gold does not push up to 3027 but closes below 3015, then SELL to 3008. At the end of the session, if it breaks 3008, hold to 2983. If it doesn't break, then BUY again to the 3008 area, target 3028.

Trading opportunity for AMP AMPUSDTBased on technical factors there is a Buy position in :
📊 AMPUSDT
🔵 Buy Now or by Breakout
🪫Stop loss 0.003700
🔋Target 0.006000
📏 R/R 3,5
💸RISK : 1%
We hope it is profitable for you ❤️
Please support our activity with your likes👍 and comments📝

BTC/USD – Bearish Rejection, Targeting SupportChart Analysis:
BTC/USD is trading within a descending channel, showing a bearish trend.
Price recently tested the resistance zone but faced rejection.
A strong sell signal is indicated, suggesting a move towards the support level around $79,877.
If price breaks below support, further downside is possible.
Trading Plan:
Sell below resistance with a target at support.
Watch for confirmation signals before entering a position.
If price breaks above resistance, a trend reversal could be possible.

$UBER is HOTT! H5 Swing Trade with 10% Upside!NYSE:UBER is looking nice. Currently in it as a swing.
Undervalued and has been a holding up really well in this correction.
Markets get going next few weeks this name will get to $100 QUICK!
PTs: $82 / $85
WCB forming
Bullish H5_S indicator is bullish Cross
Volume Shelf Launch
Bull flag breakout!
Not financial advice.

Ready to $DASH! H5 Swing TradeReady to NASDAQ:DASH 🏃💨
🎯$215📏$227⏳May2025
Falling Wedge Breakout ✅
Breakout Retest ✅
Bullish WCB ✅
Volume Shelf ✅
Bullish H5_S Indicator ✅
Not Financial Advice

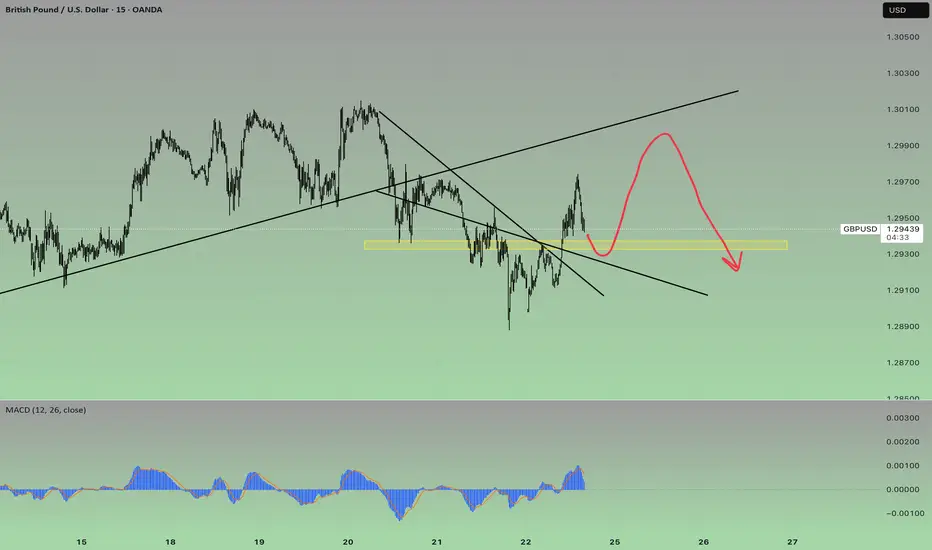
Pedramfxtrader | GBPUSD BUY We have a specific type of divergence on the 1-hour timeframe ⏳, indicating a potential drop 📉 in the higher timeframe. On the other hand, the lower 15-minute timeframe 🕒 gives us a buying perspective 📈. So, the analysis will be as shown in the image.
#GBPUSD #ForexTrading #PriceAction #ForexSignals #TradingAnalysis 💹
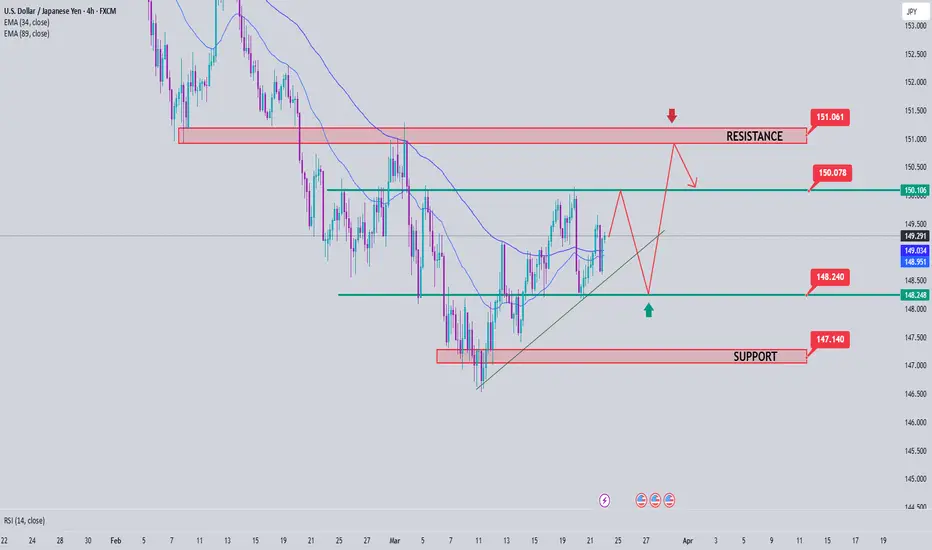
USDJPY Analysis week 14Fundamental Analysis
The US dollar continues to attract cash flows as the US Federal Reserve (Fed) is unlikely to cut interest rates in the near future. Fed Chairman Jerome Powell stressed that the Fed is in no hurry to adjust policy amid growing economic uncertainty under President Donald Trump, while warning of the negative impact of tariff policies on growth and inflation.
In the Asia-Pacific region, weak Japanese CPI data in February put pressure on the Yen (JPY), although the growth rate still reached 3%. However, expectations of tightening policy by the Bank of Japan (BoJ) remained after the Rengo union announced a 5.4% wage increase this year.
Technical Analysis
The short-term range is limited to 150,100-148,200. This border area is also very easy to break because there is a lot of buying and selling in this area and just enough factors will break the border area. Krado is aiming for the resistance area of 150,900 which will be the weekly resistance area. Important support when the price breaks out of the trendline is extended to 147,300 for buying force to jump into the market.
MUBARAKUSDT Hourly Technical AnalysisMUBARAKUSDT Hourly Technical Analysis
In the 1-hour technical analysis of the newly listed Mubarak Meme Coin, it is moving at the same level as the 21-day price average. Indicators are positive, and the price is consolidating in a sideways range, fluctuating between 0.130 - 0.150.
This meme coin is supported by CZ and is currently undergoing a voting process on Binance. CZ has shown his support for this meme coin by wearing the traditional Arab outfit featured in the coin's symbol in his social media posts. In short, since MUBARAK coin has a potential chance of getting listed on Binance in the future, the probability of positive price movements is high.
THIS IS NOT INVESTMENT ADVICE.
The information, comments, and recommendations provided here do not constitute investment advice. Investment advisory services are offered within the framework of an investment advisory agreement signed between the investor and brokerage firms, portfolio management companies, or non-deposit banks. The content on this page reflects only personal opinions and may not be suitable for your financial situation, risk tolerance, or return expectations. Therefore, no investment decisions should be made based on the information and statements provided here.
To stay updated on our analyses with both positive and risky technical indicators, please follow and like our page. Your support is greatly appreciated!
