XRPUSDT Weekly Chart Analysis | Next Bullish MoveXRPUSDT Weekly Chart Analysis | Major Resistance Levels Align for Next Bullish Move
🔍 Let’s break down the XRP/USDT weekly setup, highlighting key technical signals and major upside targets for the next rally.
⏳ Weekly Overview
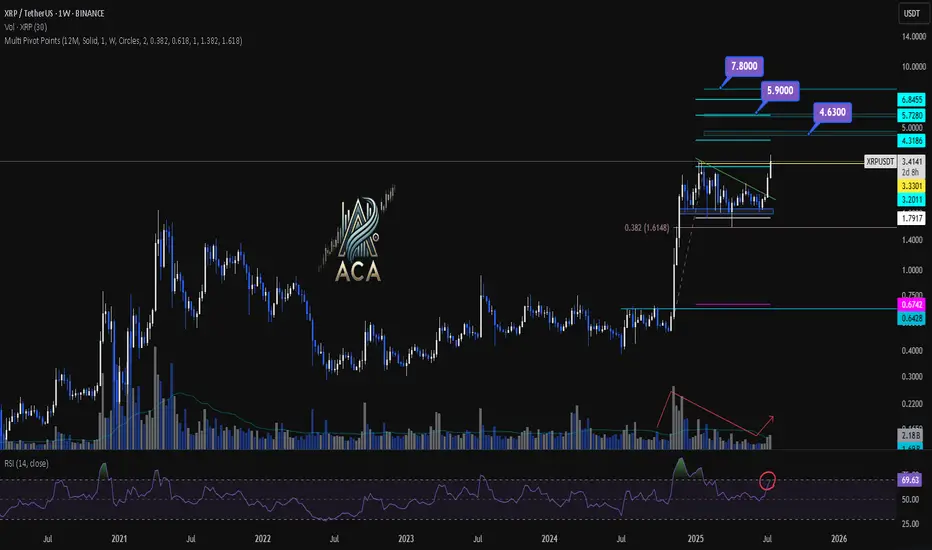
The weekly chart shows consolidation just below a major resistance, with price action tightening and preparing for a breakout. A recent correction found support near the 0.382 Fibonacci retracement level, which has acted as a springboard for renewed momentum. Notably, the R2 pivot point level aligns closely with this area, strengthening its importance as a decision zone for bulls.
🔺 Upside Targets & Confluences:
- First Target: $4.63 — This coincides with the R2 monthly pivot point and aligns with key Fibonacci extension targets, offering strong confluence for a reaction zone.
- Second Target: $5.90 — Our most realistic medium-term target, also backed by cluster resistance from both pivot analysis and fib projections.
- Final Target: $7.80 — This is the major Fibonacci extension level, marking the highest projected upside if momentum persists.
📊 Key Technical Highlights:
- Pivot Point R2 & Fibonacci Confluence: The R2 level reinforces a critical resistance, overlapping with the $4.63 Fibonacci target.
- Fibonacci Retracement: Price respected the 0.382 retracement during the latest correction, signaling healthy trend continuation.
- Volume Confirmation: An uptick in volume confirms that buyers are stepping in, supporting the bullish momentum.
- RSI Signal: RSI is entering the overbought zone, which typically indicates a strong surge in buying pressure and can mark the start of a momentum move.
🚨 Conclusion:
XRP is setting up for a major breakout as key technical levels align. Watch for a sustained move above $4.63 to unlock the $5.90 area, with a final potential push towards $7.80 if bulls maintain control. Volume expansion and an overheated RSI are both classic signs of an incoming momentum wave—keep your eyes on these levels for validation of the setup.
Trade
18.07.25 Morning ForecastPairs on Watch -
FX:GBPAUD
FX:EURAUD
FX:EURNZD
FX:EURCAD
A short overview of the instruments I am looking at for today, multi-timeframe analysis down to what I will be looking at for an entry. Enjoy!

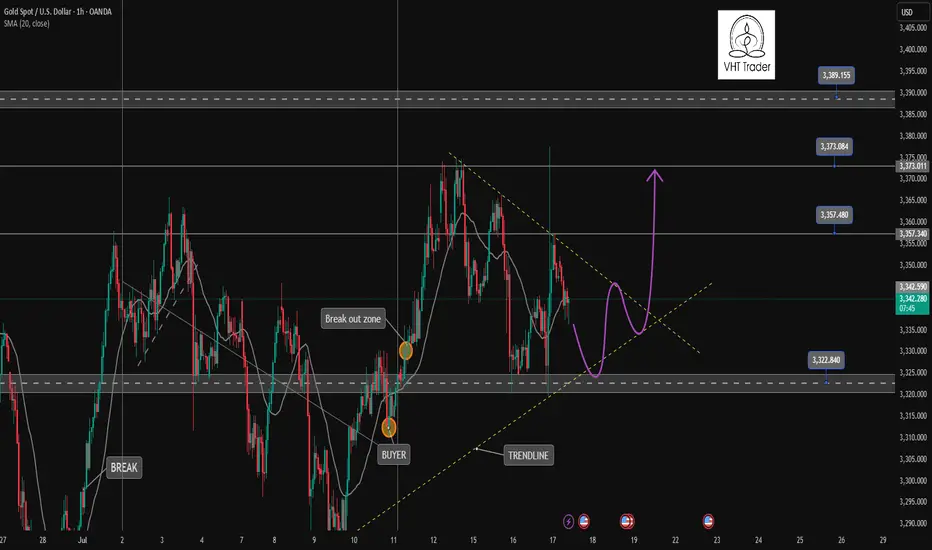
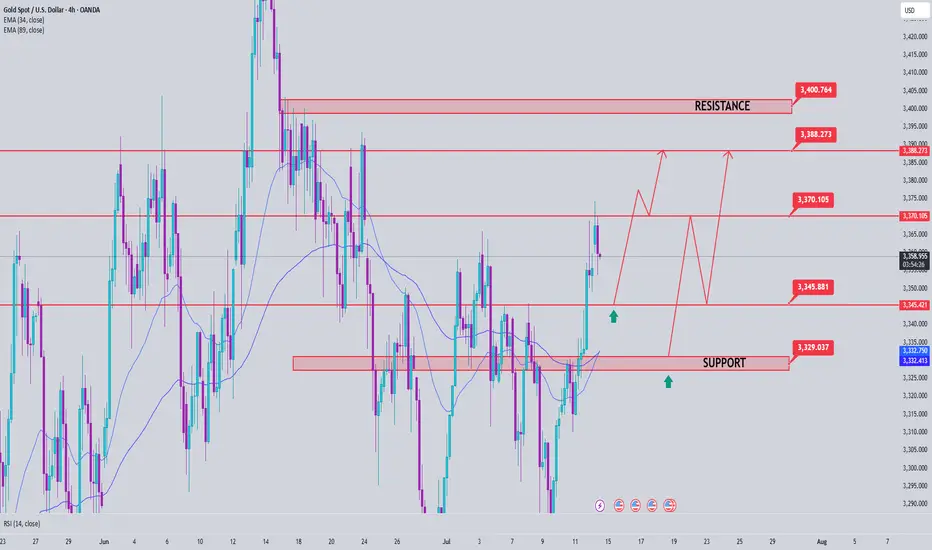
Gold returns to Sideway range waiting for new momentumOANDA:XAUUSD A sweep of liquidity back to the 3377 zone and then back into the triangle trading range. Currently, the market will wait for new momentum for the next trend. If the 3322 zone is still holding, the uptrend to 3400 is still there. This is an important price zone in today's trading day.
📉 Key Levels
BUY Trigger: rejection 3323 with bullrish confirmation
Target: 3373
SELL Trigger: Break and trading Bellow support 3321
Target: 3285
Leave your comments on the idea. I am happy to read your views.
17.07.25 Morning ForecastPairs on Watch -
OANDA:US30USD
CAPITALCOM:DE40
FX:GBPJPY
A short overview of the instruments I am looking at for today, multi-timeframe analysis down to what I will be looking at for an entry. Enjoy!

Gold Price Analysis July 17XAUUSD Analysis Today
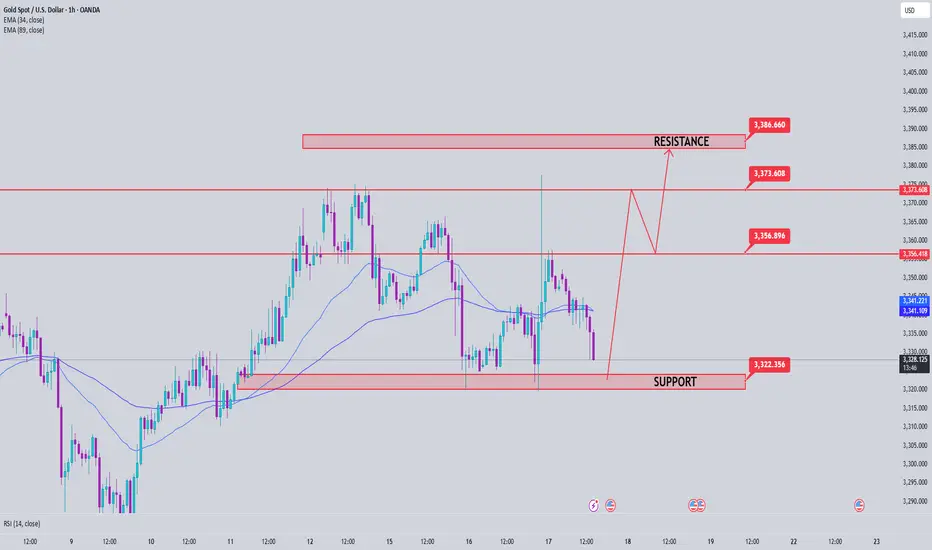
The price has cleared the liquidity to the 3377 zone, then returned to trading within the triangle. The market is currently waiting for new momentum to determine the next trend.
✅ BUY Scenario
If the 3322-3323 zone continues to hold and there is a bearish rejection signal and confirmation of buying power, gold is expected to continue its uptrend towards the 3373 - 3400 zone.
❌ SELL Scenario
If the price breaks the 3321 support with clear selling pressure, it can extend the decline to 3285.
🔑 Key Level Today
Support: 3321 - 3323
Resistance: 3373 - 3400
💡 Strategy:
Watch the price reaction at the important support zone to decide the next action.
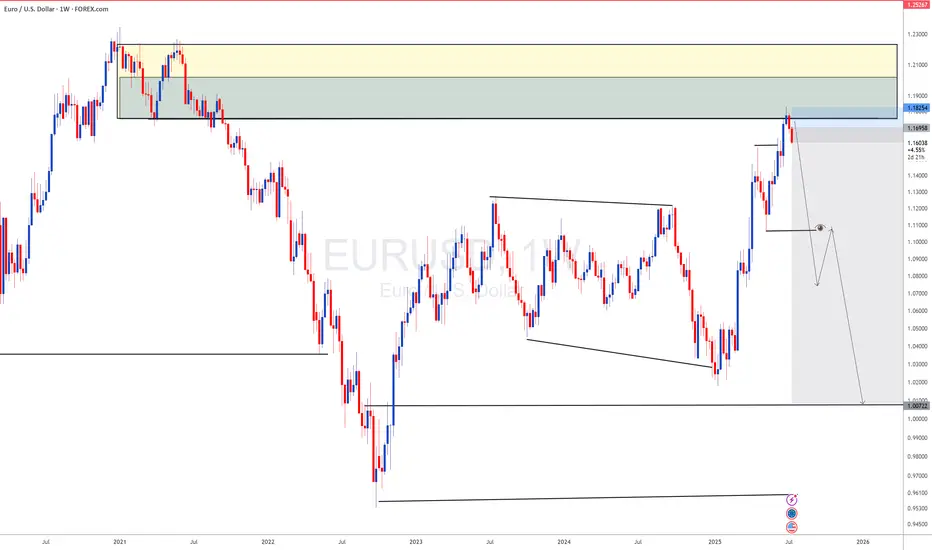
EU's Wild Drop: A Sneaky Trap or Reversal Time?Hey Fellow Traders! 😎
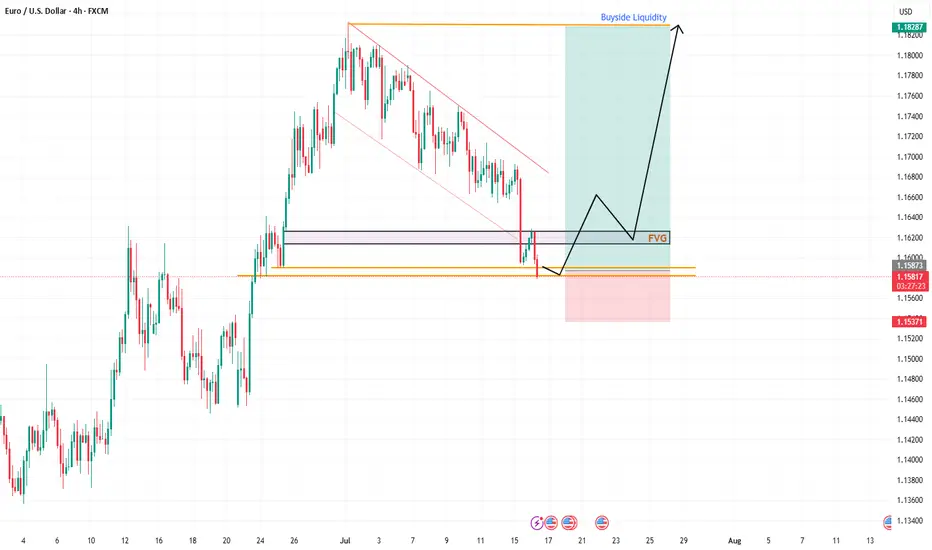
What a ride yesterday, right? The EUR/USD took a massive plunge, smashing through the descending channel like a wrecking ball and sweeping up all that liquidity. 💥 But hold up—was that just a clever market manipulation to shake out the bulls? I think so! 🧠
Right now, the price is chilling in a Daily Fair Value Gap (FVG), and I’m expecting some serious action here. This could be the perfect setup for a reversal! The market makers pulled a fast one—tricking bullish traders into flipping bearish after that dramatic drop. But guess what? That’s the trap! 🕸️ Don’t fall for it.
I’m eyeing a long entry right at this level. Here’s the plan:
Entry: Right now—let’s catch this wave! 🌊
Stop Loss: Set it tight around 1.15360 to keep risk in check.
Take Profit: Aiming for those juicy highs (check the chart I shared in my last post for the exact levels). 📈
This setup is screaming opportunity, so let’s talk about it! 💬 What’s your take—are we reversing or is the market still playing games? Drop your thoughts below, smash that Like button if you’re with me, and Follow for more trade ideas! 🚀 Let’s keep the community buzzing. 🐝
#Trading #EURUSD #MarketAnalysis #ReversalSetup
16.07.25 Morning ForecastPairs on Watch -
FX:GBPJPY
FX:GBPNZD
FX:USDJPY
A short overview of the instruments I am looking at for today, multi-timeframe analysis down to what I will be looking at for an entry. Enjoy!

SPX500 LongThere is a lot of support at this level
There is a shark pattern on M15 and M30
All timeframes are oversold and there are multiple bottoms with divergence
This trade is with the trend
25 Pip stop loss

EURUSD as DXY s gaining momentum DXY has completed its long term downside now lets look for sell on EURUSD
DXY - USD Index: either 86 or 112If the current pullback can break above the Centerline, then massive upside is on the plate.
But if it gets rejected, massiv downside is possible.
We don't know yet.
Just let the market tell you.

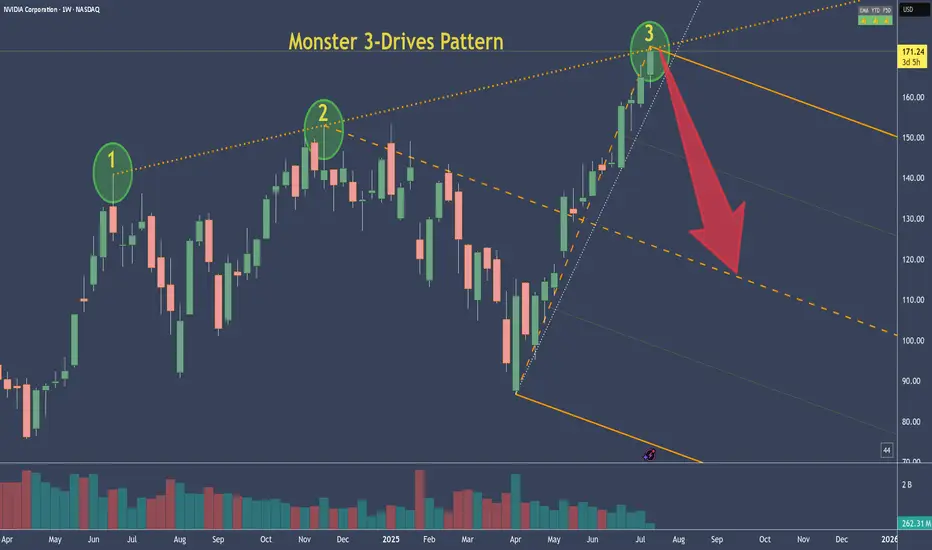
NVDA - NVIDIA's 3-Drive Pattern target if it plays outThis is the weekly chart of NVDA.
We can clearly see a 3-Drives pattern forming.
If this pattern plays out, the centerline would be my target. Of course, it's still too early to short.
But I’ve got my hunting hat on and I'm watching for signals on the daily chart.
One would be a break of the slanted trendline—but there are a couple of other conditions that need to align as well.
Always ask yourself: What if?
15.07.25 Morning ForecastPairs on Watch -
FX:EURUSD
CAPITALCOM:DE40
FX:EURGBP
FX:GBPJPY
A short overview of the instruments I am looking at for today, multi-timeframe analysis down to what I will be looking at for an entry. Enjoy!

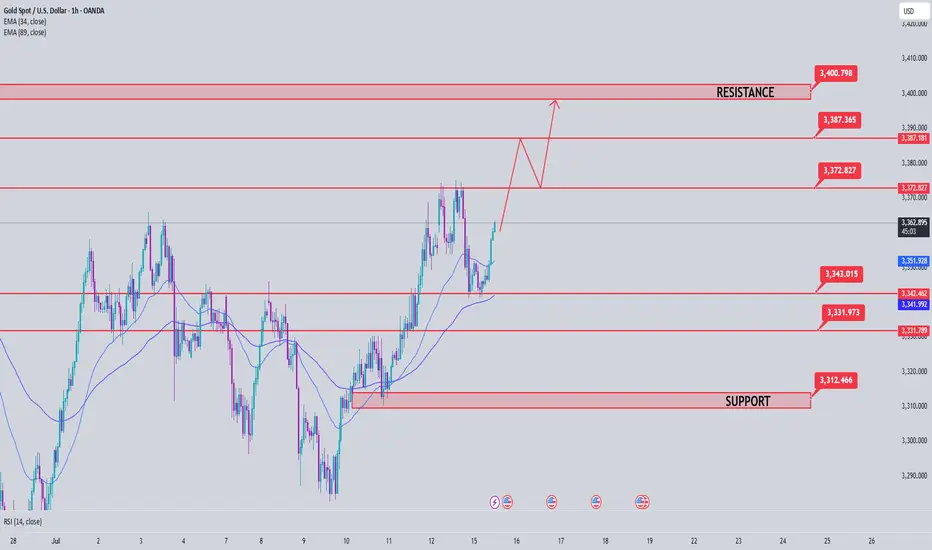
Gold Price Analysis July 15Continued uptrend after touching the 3345 buy zone
As analyzed at the beginning of the week, gold price has touched the buy zone around 3345 and continues to maintain the bullish wave structure, heading towards the 3400 resistance zone.
Currently, if gold breaks the 3373 mark, the uptrend is likely to be further strengthened. At that time, it is not advisable to trade against the trend, especially when the buyers completely control the market.
However, in case gold falls below the 3343 support zone (the resistance level in yesterday's US session), the current uptrend may be temporarily interrupted. At that time, the market will need to form a new momentum to establish the next trend.
🔑 Important price zones:
Support: 3343 – 3330 – 3313
Resistance: 3373 – 3387 – 3400
📌 Trading strategy:
Hold BUY order at 3345, expected target 3400
Activate SELL order if there is a clear price rejection signal at 3373 or 3387 (with confirmation of selling pressure)
SELL at 3400 if the strong resistance zone reacts clearly
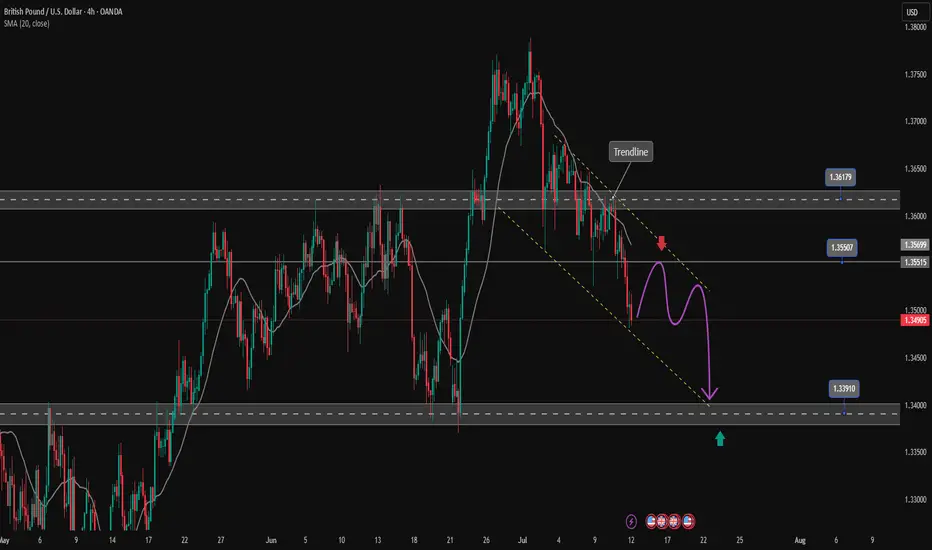
GBPUSD downtrend continuesOANDA:GBPUSD is trading in a bearish channel heading towards the important support zone of 1.340. This is the bottom support zone of last month so there is a lot of buying pressure in this zone. Any recovery of GBPUSD is considered a good opportunity to enter a SELL signal to the target. When the price breaks 1.361, the downtrend will really break.
Support: 1.340
Resistance: 1.355-1.361
SELL Trigger: rejection 1.355 with bearish confirmation
SELL zone 1.361 (Strong Resistance zone)
Target: 1.340
Leave your comments on the idea. I am happy to read your views.
ETHUSD M15 long strong bullish Support Zone: $3,000 – $3,020 (Active reaction zone)
• Strong Support (Last Defense): $2,940 – $2,970
⸻
🎯 Upside Targets:
1. First Target:
🔸 Level: $3,050
🔸 Type: Minor Resistance / First TP
2. Long Target:
🔸 Level: $3,125 – $3,150
🔸 Type: Major Resistance / Final TP

GER40 LongThere are multiple pattenrs on both H1 and M15
This is hitting target 2 of a short on H4
There is a lot of support at the level 24000
All timeframes are oversold with divergence
This is in a strong upward trend
Stop loss of 100 pips

14.07.25 Morning ForecastPairs on Watch -
FX:NZDCAD
FX:USDJPY
FX:EURUSD
OANDA:US30USD
A short overview of the instruments I am looking at for today, multi-timeframe analysis down to what I will be looking at for an entry. Enjoy!

Gold Price Analysis July 14Gold confirmed a break above the key 3330 level on Friday, opening a clear uptrend. The reaction at the 3368 GAP zone further strengthens the current bullish momentum. With the current market structure, the bias is leaning towards buying on corrections around support zones.
🔍 Technical levels to watch:
Support: 3345 – 3331 (potential buying zone)
Resistance: 3387 – 3400 (bullish target)
📌 Trading strategy:
BUY Trigger 1: Price tests and rejects the 3345 support zone
BUY Trigger 2: Buy around 3331 – strong support zone
🎯 Target: 3400
The current trend favors a buying strategy on reasonable price correction conditions. It is necessary to monitor price action around support zones to confirm effective entry points.
GBP/NZD: The Great Liquidity Grab? (Long Trade Plan)"🏦💰 GBP/NZD BANK VAULT RAID: Bullish Heist in Progress! (Long Setup) 💰🏦
🚨 Overbought Trap? Or Trend Continuation? Here’s How to Loot Pips Safely! 🚨
🦸♂️ GREETINGS, MARKET MARAUDERS!
To all the Profit Pirates & Risk-Takers! 🌍💸
Using our 🔥Thief Trading Tactics🔥 (a ruthless combo of price action + liquidity grabs + macro triggers), we’re executing a bullish heist on GBP/NZD ("Sterling vs Kiwi")—this is not advice, just a strategic raid blueprint for those who trade like outlaws.
📈 THE HEIST PLAN (LONG ENTRY FOCUS)
🎯 Profit Zone: 2.28700 (or escape earlier if momentum stalls)
💥 High-Stakes Play: Overbought but squeezing higher—trap for bears.
🕵️♂️ Trap Spot: Where sellers get liquidated.
🔑 ENTRY RULES:
"The Vault’s Open!" – Swipe bullish loot on pullbacks (15-30min TF).
Buy Limit Orders near swing lows for better risk/reward.
Aggressive? Enter at market—but tighter stops.
📌 SET ALERTS! Don’t miss the breakout retest.
🛑 STOP LOSS (Escape Route):
Thief SL at recent swing low (2H timeframe).
⚠️ Warning: "Ignore this SL? Enjoy donating to the market."
🎯 TARGETS:
Main Take-Profit: 2.28700 (or trail partials).
Scalpers: Ride long waves only. Trailing SL = VIP exit pass.
📡 FUNDAMENTAL BACKUP (Why This Heist Works)
Before raiding, check:
✅ COT Data (Are funds long GBP/short NZD?)
✅ Rate Spreads (GBP vs NZD yield shifts)
✅ Commodity Correlations (Dairy prices? Risk mood?)
✅ Sentiment Extreme (Retail over-shorting?)
🚨 NEWS RISK ALERT
Avoid new trades during RBNZ/BOE speeches (unless you like volatility casinos).
Trailing stops = your bulletproof vest.
💣 BOOST THIS HEIST!
👍 Smash Like to fuel our next raid!
🔁 Share to recruit more trading bandits!
🤑 See you at the target, rebels!
⚖️ DISCLAIMER: Hypothetical scenario. Trade at your own risk.
#Forex #GBPNZD #TradingView #LiquidityGrab #TrendContinuation #ThiefTrading
💬 COMMENT: "Long already—or waiting for a deeper pullback?" 👇🔥

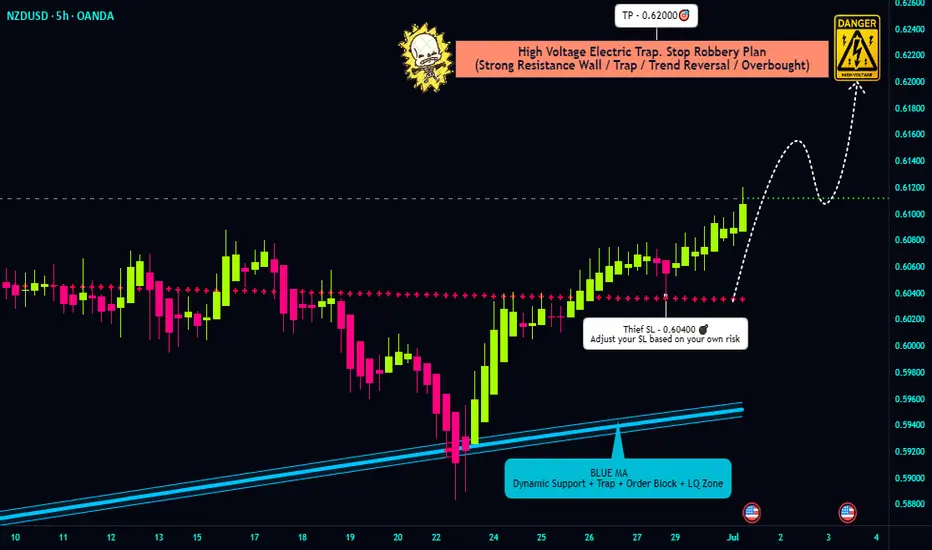
"NZD/USD Bullish Heist! Steal Pips Before the Reversal Trap! 🏴☠️ NZD/USD Kiwi Heist Masterplan – Steal the Bull Run! 💰
🌟 Hola, Money Makers & Market Marauders! 🌟
Welcome to the Thief Trading Style raid on the NZD/USD "The Kiwi" Forex vault. Follow the blueprint sketched in the chart for a bold long takeover — escape the high‑risk Yellow MA Zone before guards tighten!
🎯 Heist Blueprint
1. Entry 🚀
"The vault swings wide—yank that Bull loot at any price!"
Drop your buy-limit orders within the next 15–30 min (or at the latest swing low/high). Don’t sleep—set chart alerts for the perfect breach.
2. Stop‑Loss 🛑
Thief-style SL lurks at the nearest 5h swing‑low wick (≈ 0.60400) for intra‑day.
Adjust your SL based on your risk appetite, position size, and combo of orders.
3. Target 🎯
Aim to escape by 0.62000, or bail early for safety.
4. Scalpers’ Edge 🔍
Only rob on the long side. Big bankroll? Go all‑in. Prefer safety? Slide into the swing crew with a trailing SL to lock in your spoils.
🔍 Market Intel
Why the Kiwi Loot is Ripe:
Bullish momentum marches on, fueled by macroeconomic clues, COT data, sentiment shifts, inter-market moves — all pointing upward.
📚 For Full Recon:
Dive into the fundamental, macro, COT, quant, sentiment & intermarket intel — plus trend targets and scorecards. Check the data here 👉🔗🔗
⚠️ Caution Zone
News Watch & Position Safety:
Major news = guarded vault. Don't open new trades during release windows.
If you're in already, use trailing stops to shield your haul and lock in gains.
💪 Support the Crew
Smash that “Boost” to fuel our team and keep the raid running smooth. With Thief Trading Style, every day’s a payday.
🗓️ Stay tuned for the next Kiwi Heist – we’re just getting started. Happy robbing, legends! 🐱👤💥
11.07.25 USDJPY Trade Recap + Re-Entry for +2.5%A long position taken on USDJPY for a breakeven, followed by a premature re-entry that I took a loss on. I also explain the true re-entry I should have taken for a 2.5% win.
Full explanation as to why I executed on these positions and also more details around the third position that I did not take.
Any questions you have just drop them below 👇

BTCUSDTHi everyone
nice move , yeah!
here are the levels that you can consider in your trading.
In my opinion every correction could be a good opportunity to buy.
have fun
DYOR!

11.07.25 Morning ForecastPairs on Watch -
FX:EURUSD
FX:EURCAD
FX:EURAUD
A short overview of the instruments I am looking at for today, multi-timeframe analysis down to what I will be looking at for an entry. Enjoy!
