BTCUSD Heading Yesterday's Resistance Zone, Price Will React After a recovery to 107.500 BTCUSD is recovering to the upside again towards the resistance of 1.09500. This is the convergence zone between the trendline and yesterday's high. BTCUSD price may correct lower from this zone. Then find some new bullish momentum at strong support zones towards an all-time high.
Support 107.500 - 105.300
SELL Trigger: Break bellow 107.500
Resistance: 109.500- 110.500
Wish you successful trading, leave your comments about BTC.
Trade

10.07.25 Morning ForecastPairs on Watch -
FX:USDJPY (live position)
FX:EURNZD
FX:EURUSD
A short overview of the instruments I am looking at for today, multi-timeframe analysis down to what I will be looking at for an entry. Enjoy!

VOLTAS In breakoutNSE:VOLTAS in breakout. As it approaches the key level of 1390, I recommend buying once it decisively crosses that threshold. With bullish momentum building, we can set our sights on the first target at 1480 and an ambitious second target at 1565!
Remember, investing requires careful analysis and risk management. Stay informed, and let’s navigate this market together! What are your thoughts? Are you eyeing VOLTAS or any other stocks for potential growth? Let’s discuss in the comments below! 💬💰 #StockMarket #InvestmentStrategy #VOLTAS #BreakoutTrading

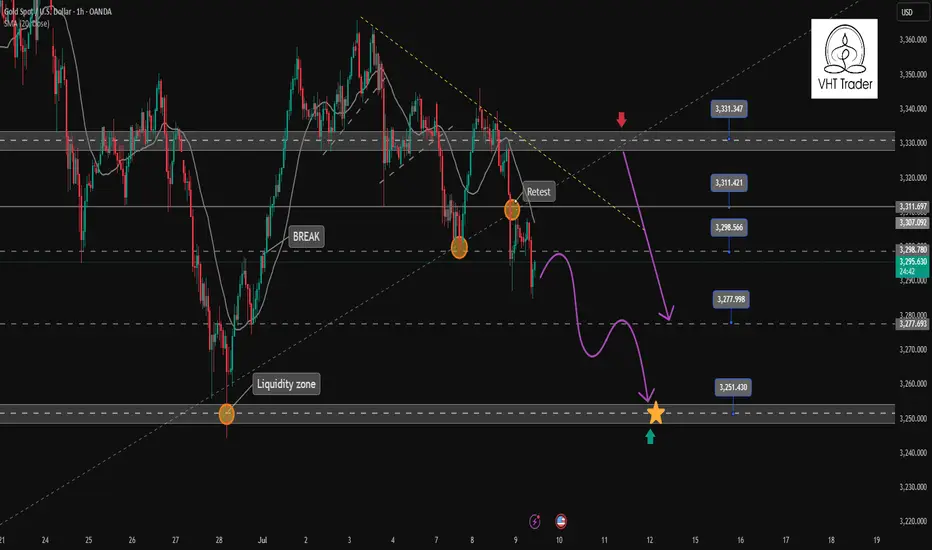
Gold continues downtrend today✏️#GOLD view
Yesterday's D1 candle confirmed the decline in gold prices when the selling pressure returned below the liquidity candle wick. The extension of the downtrend will continue today.
Yesterday's strong support zone 3297 has become today's resistance zone, this is the SELL point today when there is confirmation from the selling side in this zone.
3310 The confluence resistance zone between the trendline and the US Session Resistance is noted in today's SELL strategy. The previous SELL Target 3352 orders pay attention to the reaction at 3377.
📈Key Level
SUPPORT 3277-3250
RESISTANCE 3297-3310-3328
SELL Trigger: Price cannot break 3297
SELL DCA Trigger: Break 3276
Target: 3250
BUY Trigger:PriceTrading above 3276
Leave your comments on the idea. I am happy to read your views.
AUDUSD 4H: Sell Zone Confirmed📉 AUDUSD Analysis – Current Trend & Trade Opportunity
Hello Traders,
I’ve prepared an updated analysis for the AUDUSD pair.
At the moment, AUDUSD has shifted out of its previous bullish structure and has now entered a bearish trend. Based on this shift, I’m planning to enter a limit sell trade at the level shared below:
🔹 Limit Sell Entry: 0.65232
🔹 Stop Loss: 0.65576
🔹 Targets:
• TP1: 0.64591
• TP2: 0.64591
• TP3: 0.63738
🔸 Risk/Reward Ratio: 4.27
Considering the trend reversal, I’m looking to open a position from these levels.
I meticulously prepare these analyses for you, and I sincerely appreciate your support through likes. Every like from you is my biggest motivation to continue sharing my analyses.
I’m truly grateful for each of you—love to all my followers💙💙💙

09.07.25 Morning ForecastPairs on Watch -
FX:GBPUSD
FX:EURAUD
OANDA:JP225USD
FX:USDCAD
A short overview of the instruments I am looking at for today, multi-timeframe analysis down to what I will be looking at for an entry. Enjoy!

AUDJPY Bullish Channel Still Intact, Eyeing Breakout Above 95.00AUDJPY continues to respect its ascending channel, with the current bounce occurring right at the 61.8% Fibonacci retracement and lower trendline support. The structure supports further upside as long as price holds above the 94.00–93.80 zone, with targets set toward 94.77 and 95.36, potentially extending to 95.63 highs.
🧠 Fundamentals:
AUD Strength Drivers:
RBA remains relatively hawkish vs other G10 banks.
Australia's data this week (retail sales, NAB confidence) were mixed, but no rate cut pricing in the near term supports AUD.
Iron ore demand showing resilience despite Chinese slowdown concerns.
JPY Weakness Drivers:
BoJ remains ultra-dovish. No action expected in July.
Japan’s inflation remains tame; the yield gap with other majors keeps widening.
Risk-on sentiment reduces demand for safe-havens like JPY.
🔍 Technical Structure:
Strong upward channel since early June remains valid.
Current pullback held the 61.8% Fib retracement of the June-July leg.
Bullish engulfing near support confirms entry.
Immediate resistance at 94.77 → 95.36 → potential breakout to 95.63.
Invalid if price closes below 93.80 (channel break).
⚠️ Risk Factors:
Risk-off shift (e.g., geopolitical escalation or U.S. CPI surprise) may boost JPY.
China growth fears can weigh on AUD.
A sudden dovish shift from the RBA would invalidate bullish fundamentals.
🔁 Leader/Lagger Dynamics:
AUDJPY typically leads other yen crosses (e.g., NZDJPY, CADJPY) during risk-on moves. It’s also a barometer for broader risk sentiment, often following moves in equity indices like US500 or commodity-linked assets.
✅ Trade Bias: Bullish
TP1: 94.77
TP2: 95.36
TP3 (aggressive): 95.63
SL: Below 93.80
Event to Watch: China data this week + U.S. CPI (Jul 11)
📌 Watch for a strong bullish daily candle above 94.77 for continuation confirmation. Stay nimble around key global risk events.

30M Insight: EURUSD Buy Limit ReadyGood Mornıng Traders;☀️
Based on a 30-minute analysis, I’ve identified a shift in EURUSD market structure. I’ll be waiting for price to reach my level with a buy limit order.
📥 BUY LIMIT ORDER: 1.17180
🛑 STOP LOSS: 1.16946
🎯 TP1: 1.17275
🎯 TP2: 1.17412
🎯 TP3: 1.17649
📊 Risk / Reward Ratio: 2.00
Patience meets precision. Let the market come to you.
🧠 Master your mindset with iron discipline.
Never fear the trade—let the trade fear you.
Keep your motivation high and your focus sharper than ever.
-----
Your likes and support are what keep me motivated to share these analyses consistently.
Huge thanks to everyone who shows love and appreciation! 🙏

OXY Bullish BreakoutOXY poised to breakout to $49 in the near term.
Bellwether XOM has already made a move above it's 200 day SMA, I expect OXY and other energy laggards to follow suit.
53.75 medium term target.
Good luck! This is not financial advice.

EURO/USD SELL SETUP "Euro/USD Potential Sell Zone: Price approaching key resistance at 1.17634,to 1.17735 with a potential reversal in sight. Selling opportunity on the horizon? Target 1ratio 3 . Let's short the Euro! 📉💡 #EuroUSD #SellZone #ForexTrading"

Gold price analysis July 8In the previous US session, strong buying pressure pushed gold prices up and formed a bullish hammer candlestick pattern on the D1 chart - a potential sign for an uptrend recovery.
🔄 Today's scenario: The correction in the early session is considered a good opportunity to buy, expecting the price to continue the uptrend.
📍 Nearest resistance zone:
The price is currently facing the resistance zone of 3344 in the European session. If gold breaks 3344, the next target will be 3365 - the gap zone that has not been filled.
However, according to the wave structure, it would be more optimal if the price has a retest to the 3320 zone, accumulates more buying momentum and then breaks out strongly through 3344.
📉 Bearish scenario:
If 3320 is broken, especially with a trendline and support zone breakout signal, a sell strategy can be activated with a lower target.
🔸 Support: 3320 – 3297
🔸 Resistance: 3345 – 3352 – 3365
🔸 Sell is triggered if: Price breaks 3320, confirms breaking trendline & support zone.
💬 Do you have any comments on this trading plan? Leave a comment!

08.07.25 Morning ForecastPairs on Watch -
FX:EURUSD
FX:USDJPY
A short overview of the instruments I am looking at for today, multi-timeframe analysis down to what I will be looking at for an entry. Enjoy!

Trend Continuation After NonfarmToday's D1 candle started to continue the trend of NF with a decrease to 3306 in the Asian session this morning.
The bearish structure of Gold Price will continue in today's trading session towards important support zones.
The downtrend of Gold was only broken with a candle closing back above 3324. And the downtrend may reach support 3275 today.
Support 3297-3275
Resistance 3324-3343-3364
SELL Trigger: Break support 3296

$AMD Swing Trade – Put Debit Spread Setup🔻 NASDAQ:AMD Swing Trade – Put Debit Spread Setup (Jul 18 Exp)
📅 Trade Opened: July 3, 2025
🛠 Strategy: Buy to Open (BTO) Put Debit Spread
📉 Strikes: $31 / $30 (Jul 18 Expiration)
💵 Cost (Premium Paid): $0.21
🎯 Trade Thesis
This setup aims to capture short-term downside in NASDAQ:AMD via a low-cost, defined-risk spread. The trade fits within my broader portfolio of OTM spreads under $0.25.
Key Drivers:
🔻 Semi sector under pressure – NASDAQ:AMD showing relative weakness.
📉 Breakdown below key support near $31 and rejection at VWAP.
🧾 Weak momentum – MACD trending down, RSI near 44.
🔄 Trade enters into earnings season volatility.
📊 Technical Setup (Daily)
EMA(4) < EMA(8) < EMA(15): Bearish structure fully intact.
VWAP: Price rejected from 30-day VWAP zone.
MACD/RSI: Momentum still fading, no signs of bullish divergence.
⏳ Strategy Notes
Max loss: $0.21
Max gain: $0.79
Risk/reward structured for a drop into or below $30
Expiration: July 18
🧠 Journal Note
Most of my trades are swing-based using OTM debit spreads with tight risk control. No same-day entries — setups must have defined technical compression and short-term catalysts.

$LYFT Swing Trade – Low-Cost Call Debit Spread Setup🚗 NASDAQ:LYFT Swing Trade – Low-Cost Call Debit Spread Setup (Jul 18 Exp)
📅 Trade Opened: July 3, 2025, 2:53 PM
🛠 Strategy: Buy to Open (BTO) Call Debit Spread
📈 Strikes: $16.5 / $17.5 (Jul 18 Expiration)
💵 Cost (Premium Paid): $0.25
🎯 Trade Thesis
This swing trade targets a short-term bullish move in NASDAQ:LYFT based on improving fundamentals and favorable technical setup. The structure uses a low-cost OTM call spread to define risk and limit exposure while capturing directional potential.
Catalysts supporting the move:
🚙 Autonomous vehicle rollout beginning this summer (Atlanta) and expanding to Dallas (2026) via Mobileye partnership.
🗳 Activist investor Engine Capital pushing for governance changes and strategic alternatives.
💵 Gross bookings at record levels, with net income and free cash flow turning positive.
📈 Analyst upgrade from TD Cowen with a $21 target (+30% upside from entry).
📊 Technical Setup (Daily Chart)
📉 EMA(4) < EMA(8) < EMA(15): Bearish alignment beginning to flatten – potential compression signal.
⚖ VWAP (30‑day): Price consolidating near long-term VWAP – watching for reclaim.
🔄 MACD: Bullish crossover emerging.
📉 RSI: ~36 – approaching oversold territory, setting up possible reversal.
⏳ Strategy Notes
Position type: OTM vertical call debit spread.
Risk defined: Max loss = $0.25 per contract.
Max gain: $0.75 if LYFT closes at or above $17.5 by expiration.
Timeframe: 2-week swing through July 18, ahead of Q2 earnings (~Aug 6).
🧠 Journal Note
This position aligns with a broader strategy focused on OTM spreads priced under $0.25, using technical compressions and fundamental tailwinds. Trade was opened not on an entry signal day - this avoids front-running momentum shifts.

07.07.25 Morning ForecastPairs on Watch -
FX:AUDCAD
FX:USDJPY
FX:EURUSD
A short overview of the instruments I am looking at for today, multi-timeframe analysis down to what I will be looking at for an entry. Enjoy!

Gold Trading Strategy July 3✏️D1 candle continues to increase towards the price gap zone. At the beginning of the European session, sellers accept to enter the market at this resistance price zone around 3365. The accumulation pattern of gold price is forming a triangle pattern.
The lower boundary is broken, it will lead to the breakout point of the lower boundary and vice versa, if the upper boundary of the triangle is broken, the price will move towards the next resistance.
📉 Key Levels
Resistance: 3388-3363
Support: 3330-3311-3297-3277
Buy trigger: breakout above 3363
Sell trigger: breakout below 3330
If this idea resonates with you or you have other ideas, please comment. I look forward to reading your thoughts!
Best regards, VHT Traders!

EURNZD Trade Recap +3% 2nd July 2025A long position taken on EURNZD for +3%. Full explanation as to why I executed on this position and also my management plan I put in place.
Any questions you have just drop them below 👇

04.07.25 Morning ForecastPairs on Watch -
FX:GBPJPY
FX:USDJPY
OANDA:XPTUSD
FX:EURCAD
A short overview of the instruments I am looking at for today, multi-timeframe analysis down to what I will be looking at for an entry. Enjoy!

Swiss Vault Job: GBP/CHF Entry Blueprint Unlocked🕵️♂️💼 GBP/CHF: The Swiss Vault Infiltration Protocol 💼🕵️♂️
(Swing/Day Plan — Executed in Silence, Paid in Profits)
🌟Hi! Hola! Ola! Bonjour! Hallo! Marhaba!🌟
Dear Money Makers & Silent Operators, 🤑💰💸✈️
Welcome to the Thief Trading Syndicate's Strategic Playbook – today’s mission targets the GBP/CHF vault. We’ve cooked up a master plan powered by our signature blend of technical finesse and stealthy macro-insight. This setup is based on institutional footprints and high-stakes zones where liquidity flows like digital gold.
📊 Current Bias:
🟥 Bearish weight remains, but we smell bullish smoke beneath — reversal setups in play.
📈 Entry Strategy:
Long (Bullish) — Scout entry above 1.06500+ in higher timeframes (4H+). Retest confirmation required.
Short (Bearish) — “The vault’s unguarded! Slip in short anywhere up top—clean sweep mode.”
🛑 Stop Loss Placement:
Place SL near recent swing highs/lows on the 5H chart (swing basis). Customize per lot size and multiple entries. Your risk defines your escape rope.
🎯 Profit Extraction Target:
Long TP: Aim for the 1.11500 vault door (or vanish before it slams).
Short TP: Dive to 1.06500, or pull the plug earlier if guards wake up.
📰 Strategic Conditions:
This pair’s behavior is currently driven by mixed macro triggers — smart money positioning (COT), sentiment clusters, and market structure traps.
→ For full details: Fundamental macros, COT leaks, sentiment drift, and institutional zones — check your sources.
🚨 News & Risk Protocols:
No new entries during red-folder events.
Use trailing stops to lock loot and run.
💥 Boost Our Bandits!
Smash that ❤️ to strengthen our robbing force. Each tap fuels future missions. No indicators. Just raw street-smart trading edge.
👀 More heists incoming. Stay low. Stay sharp. Stay profitable. 🐱👤🎯📈

Copper is gonna to complete the 2nd leg??Hi all trading lovers and copper buyers...
Seems that after BREAKOUT from Descending Triangle and Pullback to breakout level, price is going to complete the 2nd BULLISH Leg in Weekly uptrend with a round level target (5.5555)...
(Pullback could be a bit deeper...)
PLEASE NOTE THAT IS ONLY AN ANALYSIS AND COULD BE WRONG...
MARKET IS BASED ON POSSIBILITIES AND UNCERTAINTIES...
MANAGE YOUR RISK...
#Forex #Trading #Analysis #Copper #Chart #Spike #Wedge #Uptrend

02.07.25 Morning ForecastPairs on Watch -
FX:EURNZD (Live)
FX:EURJPY
FX:GBPJPY
FX:AUDCAD
A short overview of the instruments I am looking at for today, multi-timeframe analysis down to what I will be looking at for an entry. Enjoy!

GBPAUD waiting for conditions to break out of the wide rangeGBPAUD found some buying momentum at the 2.085 support in today's trading session. In the long term, the pair's trading range is wide, extending from 2.102 to 2.067. A breakout of this range will form a new trend.
A BUY trading signal is confirmed when the pair breaks the resistance at 2.10200.
A SELL signal is confirmed when the pair breaks the support at 2.085.
📈 Key Levels
Support: 2.085 - 2.067
Resistance: 2.102 - 2.138
