GBPUSD Trading Strategy for the WeekGBPUSD is reacting at the support zone of 1.34000. This is the last important support zone that the pair is facing. If this support zone is broken, the pair will enter a prolonged Downtrend phase. 1.325 could be the target for this decline.
If the 1.34000 zone is pushed up by buyers, the pair will touch the 1.35000 border zone. If this zone is broken, the pair will form a double bottom pattern and continue to increase back to the peak of last week around 1.36000. In case the buying force is not strong enough to break 1.35000, the pair will return to the sideway in the rectangular border.
Support: 1.32500
Resistance: 1.36000
Break out: 1.34000-1.35000
Recommended good trading strategy:
Trade when price confirms in Break out zone.
BUY 1.32600-1.32400 Stoploss 1.32000
SELL 1.35900-1.36100 Stoploss 1.36400
Trade

AUDUSD Analysis – Falling from the Rising WedgeAUDUSD pair broke below an ascending wedge, a bearish reversal pattern.
Clean rejection from 0.6518, with lower highs and new lower lows confirming bearish momentum.
Price is now sitting below former trendline support, retested and respected as resistance.
Bearish target points toward 0.6400–0.6380 zone, aligning with recent swing lows.
Risk invalidation sits above 0.6520, where structure fails.
Technical Bias: Bearish
Target: 0.6400
Stop-loss zone: Above 0.6520
📊 Current Bias: Bearish
🔍 Key Fundamentals Driving AUDUSD
AUD Fundamentals (Weakening):
Australian jobs data was mixed, and wage growth has plateaued.
RBA remains cautious, with expectations for rate cuts later in 2025.
AUD pressured by China growth risks and weak commodity demand.
Geopolitical drag: Australia-China tensions and weak Chinese retail data from 618 Festival dampen AUD outlook.
USD Fundamentals (Resilient):
USD remains bid on risk-off flows, especially after weak global data and ongoing Middle East tensions.
Fed remains reluctant to cut fast despite disinflation signs – supports the USD.
US data is mixed, but rate cut odds are declining (only one expected in 2025 now per dot plot).
⚠️ Risks to This Bearish View
If China announces new stimulus, AUD could rebound sharply.
A dovish surprise from the Fed (e.g. Powell softening in speeches).
Sharp rebound in risk appetite (e.g. tech-led equity rally).
🗓️ Important Events to Watch
🇨🇳 China industrial profits & PMIs
🇦🇺 RBA Meeting Minutes (July preview hints)
🇺🇸 US Core PCE (June 28)
Global risk tone: watch metals, equities, and geopolitical headlines.
🚀 Which Asset Leads?
AUDUSD is lagging other USD pairs, but will likely lead commodity FX downside if China or metals weaken further.
Watch AUDJPY and EURAUD for further confirmation of risk-off flows and Aussie weakness.

EUR/AUD ShortEUR/AUD Short
Minimum entry requirements:
- 1H impulse down below area of interest.
- If tight non-structured 5 min continuation follows, reduced risk entry on the break of it.
- If tight structured 5 min continuation follows, reduced risk entry on the break of it or 5 min risk entry within it.
- If tight non-structured 15 min continuation follows, 5 min risk entry within it if the continuation is structured on the 5 min chart or reduced risk entry on the break of it.
- If tight structured 15 min continuation follows, reduced risk entry on the break of it or 15 min risk entry within it.

23.06.25 Morning ForecastPairs on Watch -
FX:EURAUD
FX:EURNZD
FX:EURUSD
A short overview of the instruments I am looking at for today, multi-timeframe analysis down to what I will be looking at for an entry. Enjoy!

$IREN could be next...100%+ UpsideNext Retail Darling... NASDAQ:IREN TA looks the part! 👀
Breakout 🎯$22 then $31
CupnHandle almost breaking out here with measured moves a lot higher!
Volume shelf acting as a launch pad.
WR% is uptrnding as well!
This one's looking good based on the TA.

Gold Trading Strategy June 20Daily candle continues to show a struggle while the Sellers are dominating. Today there may be a deep sweep and then a recovery at the end of the day.
Yesterday's 3343 zone is reacting 5 prices in the direction of profit. Next support around 3323 pay attention to the next sweep. Pay attention to additional daily support at 3296 for today's buy strategy.
3362 gives a SELL Break out signal in the Asia-Europe session. If Gold closes back above 3362, then BUY to 3400 target the two upper resistance zones remain the same as yesterday at 3415 and 3443
Resistance: 3400-3415-3443
Support: 3323-3296
Break out: 3362

NZDJPY “Kiwi Poised to Fly as Japan Muddles ThroughNZDJPY shows a bullish breakout from a descending trendline, with bullish structure holding near 87.20–87.25.
Key resistance targets:
87.97 (Previous high)
88.64 (Next resistance / projected fib target)
Two upside scenarios are shown:
Conservative target: ~87.97
Aggressive swing: ~88.64
If 87.00–87.20 zone holds as support, expect bullish continuation.
🧩 Current Bias: Bullish
📌 Key Fundamentals Driving NZDJPY
NZD Side (Strengthening):
RBNZ hawkish hold: RBNZ recently kept rates at 5.50% and warned that inflation remains persistent, requiring prolonged tight policy.
Resilient NZ GDP: Stronger-than-expected GDP print signals economic resilience.
Terms of trade improvement: Commodity exports holding firm, China consumption rebound showing hints of demand recovery (see recent 618 festival sales data).
AUD correlation: AUD and NZD are moving together; if AUD strengthens, NZD often follows.
JPY Side (Weakening):
BoJ remains ultra-dovish: Despite inflation trends, BoJ is hesitant to tighten further, preferring gradual tapering.
Yen under pressure from yield differentials: Global central banks (like RBNZ, Fed) remain hawkish while BoJ is not.
Geopolitical funding flows: JPY used as a funding currency amid global volatility (carry trade boost for NZDJPY).
⚠️ Risks That May Reverse the Trend
BoJ surprise tightening rhetoric (e.g. bond purchase taper announcement).
China data deterioration, hurting Kiwi sentiment.
Sharp equity sell-off and geopolitical escalation (Yen safe-haven reversal).
📅 Important News to Watch
🇳🇿 NZ Trade Balance (upcoming)
🇯🇵 Tokyo Core CPI (Jun 28) – Critical for BoJ policy speculation.
RBNZ or BoJ member speeches (hawkish or dovish shifts)
Fed tone shift or US dollar strength spillover
🏁 Who Leads the Move?
NZDJPY could lead among yen crosses due to the RBNZ’s clear inflation fight versus BoJ’s passive stance. NZDJPY is also more responsive to commodity and global risk-on flows than EURJPY or USDJPY.

20.06.25 Morning ForecastPairs on Watch -
FX:EURJPY
FX:EURNZD
FX:EURUSD
A short overview of the instruments I am looking at for today, multi-timeframe analysis down to what I will be looking at for an entry. Enjoy!

Gold Trading Strategy June 19Yesterday's D1 candle confirmed the Sell side after the FOMC announcement. Today's Asian session had a push but the European and American sessions are likely to sell again.
3366 will be an important breakout zone today, if broken through, the Sell side will continue to be strong and push the price deeper and limit buying when breaking this 3366 zone. 3344 is the first target, it is difficult for gold to break this zone but if it breaks right away, wait below 3296 to BUY for safety. Before that, pay attention to another support zone 3322.
3400 is the Breakout border zone from yesterday to today but gold has not broken it yet. To SELL this zone, you must also wait for the confirmation of the candle, but if you want to wait for a better SELL, you must wait for 3415 or wait at the ATH peak 3443. However, if it breaks 3400, waiting for a Buy test will be quite nice.
Support: 3343-3322-3296
Resistance: 3415-3443
Break out zone: 3366-3400

EURUSD +3% Trade Recap 17th June 2025A short position taken on EURUSD for +3%, full explanation as to why I executed on this position and made the decision to manually close at the level I did.
Any questions you have just drop them below 👇

19.06.25 Morning ForecastPairs on Watch -
FX:EURGBP
FX:EURAUD
FX:AUDNZD
A short overview of the instruments I am looking at for today, multi-timeframe analysis down to what I will be looking at for an entry. Enjoy!

Gold Price Reacts Strongly at 3,350.During the trading session on June 19, gold (XAUUSD) experienced significant volatility, breaking below the short-term support zone around 3,370 USD/oz and sharply dropping to an intraday low of approximately 3,350 USD/oz. This support level had been tested multiple times in previous sessions and has often led to price rebounds.
Following the sharp decline, buying pressure emerged, as shown by a strong reversal candlestick accompanied by a volume spike — indicating that buyers are stepping in at this attractive price zone.
Technical Breakdown – 15-Minute Chart
Chart type: XAUUSD, 15-minute timeframe
Support zone: 3,350 (tested and showing reaction)
Nearby resistance: 3,365 – 3,370
Volume: Surged at the bottom, suggesting buying interest.
Pattern: Signs of a temporary bottom (bullish pin bar + supporting volume).
Suggested Trading Strategy
Based on today’s price action and chart structure, consider:
Short-term buy around 3,351 – 3,353 with a stop loss below 3,348.
Take profit targets: 3,365 – 3,372.
Extended strategy: If EMA5 crosses up and locks above 3,370, extend targets to 3,388 – 3,395 during the US session.
Conclusion: 3,350 is Acting as the Final Support Wall
Today’s session shows that sellers are still in control, but technical reactions around 3,350 have formed a strong defense. If price continues to hold this level and volume remains positive, a short-term rebound is highly likely.
However, traders should manage positions with flexibility as the broader trend still leans bearish — only a break and hold above 3,370–3,380 could signal a clearer trend reversal.

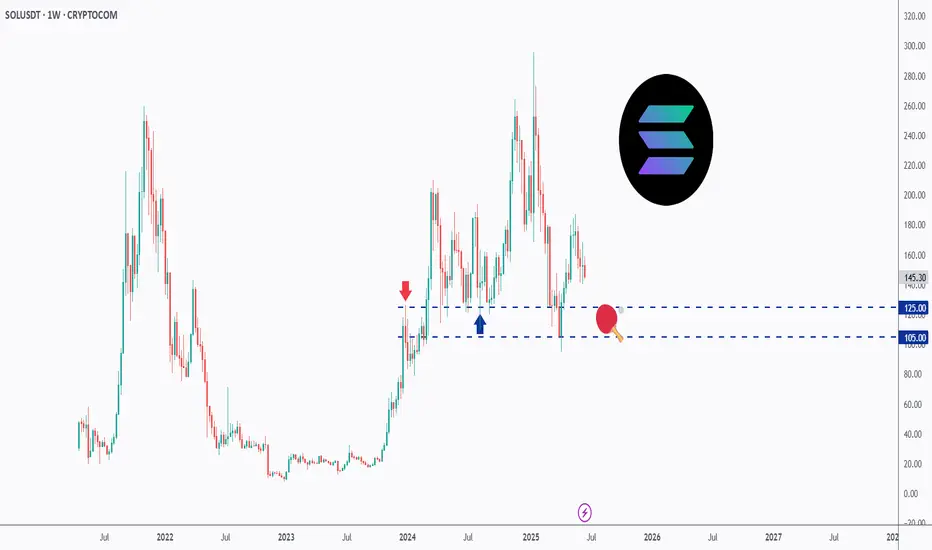
SOL - Playing Ping Pong!Hello TradingView Family / Fellow Traders. This is Richard, also known as theSignalyst.
📈SOL has been trading within a range between $100 and $200 round number.
And it is currently retesting the lower bound of the range which has been acting as a magnet lately.
As SOL approaches the $105 - $125 support zone, and as long as the $105 support holds, we will be looking for longs targeting the $200 round number.
📚 Always follow your trading plan regarding entry, risk management, and trade management.
Good luck!
All Strategies Are Good; If Managed Properly!
~Rich
Gold Price Update – XAUUSDGold FX:XAUUSD has experienced rapid and intense volatility but overall remains stable, as investors weigh the escalating conflict between Israel and Iran while focusing on this week’s U.S. Federal Reserve policy meeting.
At the time of reporting, spot gold CAPITALCOM:GOLD remains steady at $3,380/oz, down from yesterday’s (Tuesday) high of $3,403/oz.
Israel and Iran continued exchanging fire into a fifth day on Tuesday, as U.S. President Donald Trump called for the evacuation of Iran’s capital, Tehran, and cut short his trip to the G7 summit in Canada. Reports claim he had instructed the National Security Council to prepare in the Situation Room.
According to Reuters, Tehran has requested Oman, Qatar, and Saudi Arabia to urge Trump to push Israel toward a ceasefire in exchange for Iran’s willingness to show flexibility in nuclear negotiations.
Trump’s latest post on Truth Social stated:
"I have had ZERO communication with Iran in any way, shape, or form regarding (peace talks). It’s fake news! If they want to negotiate, they know how to contact me. They should take the deal on the table—it will save many lives!!!"
Forexlive commented that anyone familiar with Trump knows he will definitely wait for Iran to approach him. Reports suggest Iran is attempting to negotiate a ceasefire, but no substantive developments have emerged yet.
Gold, a non-yielding asset, is widely seen as a hedge against geopolitical and economic uncertainty, and it tends to perform well in low interest rate environments. Therefore, fundamentally, gold should maintain a positive outlook in the current market context—even though sudden pullbacks can unsettle new traders. Personally, I’ve had many moments this year when I doubted myself and didn’t trust the uptrend—only to suffer bad outcomes… sigh.
The Fed’s interest rate decision and Chair Jerome Powell’s speech are scheduled for today (Wednesday). Traders currently expect the Fed to cut rates twice by year-end.
According to CME’s “Federal Reserve Watch” on June 18:
There is a 97.3% chance the Fed will keep rates unchanged in June, and a 2.7% chance of a 25bps rate cut.
In July, there is an 85.3% chance of holding rates steady, a 14.4% chance of a cumulative 25bps cut, and a 0.3% chance of a 50bps cut.
Technical Outlook for Gold (XAUUSD)
On the daily chart, gold has been oscillating around the 0.236 Fibonacci retracement level and the psychological price of $3,400—previously highlighted as key support/resistance in our earlier analysis.
However, the overall technical structure remains unchanged, with the dominant trend still bullish. The 21-day EMA continues to act as a crucial support line, and trendline (a) remains the primary trend direction. Meanwhile, the 0.236 Fibonacci retracement serves as the nearest support, with price channel (b) defining the short-term trend.
In terms of momentum, the RSI (Relative Strength Index) remains above 50, which is also acting as a support level in this case. The distance from the overbought zone suggests further upside potential remains.
Intraday, a breakout above the psychological $3,400 level would provide a bullish signal, with the next target seen around $3,435 in the short term.
Key Levels to Watch:
Support: $3,371 – $3,350
Resistance: $3,400 – $3,435

18.06.25 Morning ForecastPairs on Watch -
FX:GBPJPY
FX:EURCAD
FX:CADJPY
A short overview of the instruments I am looking at for today, multi-timeframe analysis down to what I will be looking at for an entry. Enjoy!

Try a RR1 🔻 Sell Setup 1
Entry: 1.15600
SL: 1.16160
TP: 1.15050
R:R ≈ 1
Rejected from 1.160; Signal bar key bar detected.
Please manage your risk.

Leg Based Continuation Possible Play📈 USD/JPY – 15M Chart (Scalping to Intraday Play)
🕒 June 17, 2025 – Lower Time Frame Setup
Bias: Short-term Bullish Continuation
Structure: Leg-Based Impulse-Pullback-Impulse Model
🔹 Market Structure Insight:
Price recently completed a strong impulsive move (LEG 1) on increasing volume.
After a shallow correction into dynamic support (EMA 60), price is attempting a LEG 2 continuation.
EMAs (15 & 60) have bullish alignment and acted as dynamic support.
✅ Buy #1 – Market Execution
Entry: 144.91 (current or recent execution)
SL: 144.38
TP: 145.25
R:R ≈ 1
🧠 Entry based on continuation after bullish flag breakout
✅ Price held higher low structure + EMA confluence
✅ Buy Limit #2 – Pullback Opportunity
Entry: 144.59 (highlighted zone between EMAs)
SL: 144.37
TP: 145.25
R:R ≈ 3.0
🧠 Designed to catch a retest into the mid-range and volume base
➕ Risk minimized, reward optimized
➕ Matches possible HL (higher low) setup if price dips before pushing
⚠️ Risk Management Notes:
Overlap with prior resistance zone just above TP (145.20–145.40): partial TP or trail advised.
Invalidated if price closes below 144.30 on strong volume (breaks structure).
If LEG 2 matches or exceeds LEG 1 in strength, extended targets above 145.50 possible.

Another RR1 Buy Setup on Gold
TimeFrame: m30
Position Type: BUY
Entry Price: 3395
Stop Loss: 3372
Take Profit: 3417
R/R: 1
Please Manage Your Risk...
Trading is a risk management game...

17.06.25 Morning ForecastPairs on Watch -
FX:EURUSD
FX:CADCHF
OANDA:XAUUSD
A short overview of the instruments I am looking at for today, multi-timeframe analysis down to what I will be looking at for an entry. Enjoy!

Traders, it's time to pay close attention! 🚨 USDJPY 4H Setup Alert – High-Probability Play Unfolding! 🚨
Traders, it's time to pay close attention! 🧠📊
The USDJPY pair has just perfectly tapped into a key bullish Fair Value Gap (FVG) on the 4-hour chart — a classic move in the smart money playbook. What’s more? We've just seen a clean sweep of internal range liquidity (IRL) — a textbook liquidity grab that signals potential accumulation by larger players. 💥💼
This is not just noise — it's a significant signal. The market structure is hinting at a possible shift in momentum, and bullish pressure is building. The trap has been set, the weak hands have been shaken out, and smart money may be preparing for a strong upward push. 📈🐂
🔮 What’s the next move?
All eyes are now on the external range liquidity (ERL) — a prime liquidity pool sitting above current price levels. If price accelerates toward it, this zone could act as the magnet and the catalyst for the next explosive move upward. 🚀
🔥 Key Points to Watch:
Bullish FVG reaction ✅
IRL liquidity swept ✅
Bullish market structure forming 🏗️
ERL liquidity resting overhead — potential target 🎯
Volume profile & order flow confirming accumulation? 👀
⚠️ Stay alert and don’t chase — let the setup come to you.
Smart money might already be stepping in, and if this momentum follows through, we could be witnessing the beginning of a strong leg up.
Mark your charts and monitor closely — opportunity is knocking. 📍🕵️♂️

Top 5 Most Effective Forex Trading StrategiesTop 5 Most Effective Forex Trading Strategies Used by Professional Traders
Forex trading requires not just knowledge, but discipline and a clear strategy. So what are the most effective forex trading strategies that professional traders consistently use to achieve sustainable profits?
Let’s explore the 5 most trusted strategies that have stood the test of time – helping you level up your skills and reduce risk in this trillion-dollar market.
1. Breakout Strategy – Catching the Wave When the Market Explodes
A breakout occurs when price moves beyond a key support or resistance level after a period of consolidation. This usually signals the start of a new trend.
Best for: Traders who love strong momentum.
Pro tip: Confirm breakout with volume or candlestick patterns (e.g., engulfing).
Caution: Avoid entering right after the breakout – wait for a retest.
2. Trend Following Strategy – Trade with the Market, Not Against It
“Trend is your friend” – one of the most famous sayings in trading. This strategy helps traders ride the main trend, buying in uptrends and selling in downtrends.
Recommended tools: MA 20, MA 50, RSI, MACD.
Insider tip: Combine with pullback entries (enter when price retraces to dynamic support/resistance).
3. Price Action Strategy – Reading the Market Without Indicators
Price Action focuses on interpreting pure price behavior, without relying on indicators. Many pro traders prefer this approach to understand market psychology in real time.
Advantages: Clean, flexible, sharpens decision-making.
Popular candlestick patterns: Pin Bar, Inside Bar, Fakey, Engulfing.
4. News Trading Strategy – For Quick Thinkers and Fast Hands
When major news events like CPI, NFP, FOMC, or rate decisions hit the market, volatility surges. This creates both high-profit opportunities and high risks.
Common tactic: Straddle – place Buy Stop & Sell Stop before news release.
Risk warning: Watch out for slippage and widened spreads.
5. Fibonacci & Confluence Strategy – High-Probability Entries
This strategy combines tools like Fibonacci retracement, trendlines, support/resistance zones, and moving averages to find high-probability entry points.
Strength: Optimizes Risk: Reward ratio.
Tip: Focus on Fib levels 0.382 – 0.618 (commonly used retracement zones).
Conclusion: The Best Strategy is the One That Matches Your Style
There’s no perfect strategy – but understanding and applying the one that best fits your trading style will help you avoid emotional decisions and build long-term consistency.
Remember: Risk management – Emotional control – Systematic discipline = Long-term trading survival.

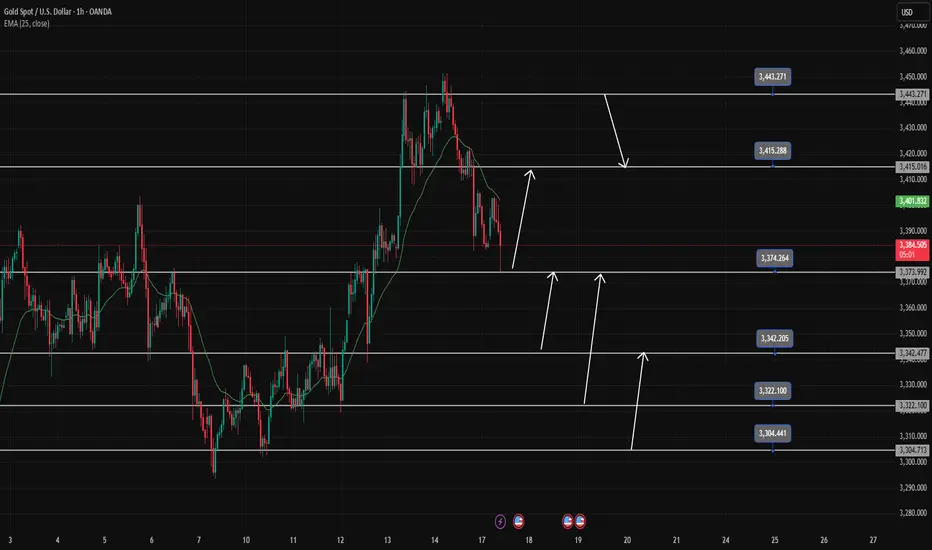
Gold trading strategy June 17D1 candle shows profit taking by sellers pushing the price back below 3400. In the current context, the pullback is only short-term and has not confirmed the reversal, but long-term Buy signals can still be noticed at important support zones.
Today, there are many price zones that can BUY Gold, so wait for confirmation before placing an order. Gold is heading towards the first support around 3375-3373 (this zone has just reacted 100 pips). This is also the Breakout zone. If it breaks this zone, Gold will reach 3343-3341 before it can BUY.
Note that to sell break 3373 and the SELL resistance point must wait for 3415 and the daily resistance 3443-3445
If there is a sweep to 3343 and bounces and closes above the 3373 breakout zone, it confirms that the uptrend will continue strongly in the near future.
The next BUY support zone to pay attention to is 3322-3320 and the 3305-3303 zone. The BUY target is always pushed further back to 3415 or to the peak around 3443.
SUPPORT: 3373;3342;3322;3304
RESISTANCE: 3415;3443
EURUSD Long Setup – Bullish Rejection from Demand ZoneEURUSD remains supported by strong eurozone fundamentals and broad USD softness. The pair has retraced into a key demand zone around 1.1490 and is showing signs of bullish rejection. With the Fed likely to pause further rate hikes and the ECB maintaining a steady tone, the bias favors further upside toward recent highs.
⚠️ Geopolitical tensions in the Middle East (Israel-Iran conflict) have introduced mild safe haven demand, but so far the USD has underperformed versus the euro, suggesting EUR remains relatively insulated.
Watch for confirmation and entries within the blue demand box.
🔍 Technical Analysis:
Structure: Clear uptrend with higher highs and higher lows. Price retraced to a well-defined 1H demand zone between 1.1490–1.1500.
Setup: Anticipating a bounce from the demand zone targeting the recent high near 1.1620–1.1630.
Entry Zone: 1.1490–1.1500 (bullish reaction area)
Target: 1.1620–1.1630 (previous supply zone)
Stop Loss: Below 1.1439 (recent swing low)
Risk-Reward Ratio: Approximately 1:2.5
🧠 Fundamental Context (as of June 16):
EUR Bias: Bullish – ECB has paused cuts; euro is resilient despite geopolitical headwinds.
USD Bias: Bearish – Fed is on pause; soft inflation data and geopolitical risks weigh on dollar strength.
Key Drivers:
Fed dovish tone (FOMC pause, lower CPI)
Strong EU resilience despite global tensions
CHF and JPY attracting safe haven flows over USD
📅 Key Events to Watch:
US Core PCE (next major inflation readout)
FOMC commentary and Fed speakers
Eurozone CPI and sentiment data
