XAUUSD consolidation before a decisionGold FX:XAUUSD is currently hovering around 3,354 after a sharp drop from the recent high of 3,391. Sellers pushed the price down to the key support zone at 3,334–3,335, but bearish momentum has clearly weakened. The price is moving sideways with small-bodied candles and low volume, indicating the market is “holding its breath” ahead of the European or US sessions or potential market-moving news.
If this support zone holds and we see a clear bullish signal (such as an engulfing or marubozu candle), it could be a good entry for a buy position, targeting 3,365–3,370 initially and then aiming for a retest of 3,391. A safe stop-loss can be placed below 3,330. However, if price breaks below 3,334 and closes beneath it, the market may enter a deeper correction phase, with potential downside targets at 3,320 or even 3,305.
In short, this is a sensitive area where patience is key. Wait for clear confirmation before entering any trades, avoid rushing in, and stick strictly to your risk management rules.
Wishing all traders a clear mind, sharp strategy, and profitable results!
Trade

04.06.25 Morning ForecastPairs on Watch -
FX:EURUSD
FX:USDJPY
FX:GBPCHF
OANDA:XPTUSD
A short overview of the instruments I am looking at for today, multi-timeframe analysis down to what I will be looking at for an entry. Enjoy!

Gold Outlook: Breakout Signals Further Upside PotentialGold FX:XAUUSD is currently in a strong uptrend, backed by both technical breakout and positive fundamentals. The price has decisively cleared the key resistance zone of $3,365–$3,370 and is hovering around $3,368. A healthy pullback to retest this zone could offer a high-probability long setup, with the next target projected at $3,470.
On the macro side, renewed U.S.–China trade tensions—following Trump’s accusations and tariff threats—along with the ongoing Russia–Ukraine conflict, continue to fuel safe-haven demand for gold.
Technically, the structure remains bullish. However, a breakdown below $3,335 would invalidate the current setup and may lead to a deeper correction.
Let’s keep a close eye on this pullback zone. If momentum holds, gold could be gearing up for the next leg higher.
Take care and trade smart

"GBP/NZD: The Perfect Long Trade (Risk-Managed Heist Plan)"🏦💰 GBP/NZD BANK HEIST: The Ultimate Sterling vs. Kiwi Money Grab! 💰🏦
🌟 Hi! Hola! Ola! Bonjour! Hallo! Marhaba! 🌟
Attention all Money Makers & Market Robbers! 🤑💸✈️
Based on the 🔥Thief Trading Style🔥 (technical + fundamental analysis), here’s our master plan to loot the GBP/NZD "Sterling vs Kiwi" Forex Bank Heist!
📜 THE HEIST BLUEPRINT:
✅ Entry Strategy (Long Only!) 📈
"The heist is ON! Wait for the breakout above the previous high (2.25500) – then strike! Bullish profits await!"
Option 1: Place Buy Stop orders above the Moving Average.
Option 2: Use Buy Limit orders near recent swing lows (15-30 min timeframe) for pullback entries.
📌 Pro Tip: Set an ALERT for the breakout entry—don’t miss the robbery window!
🛑 Stop Loss (Listen Up!)
"Yo, thieves! 🗣️ If you’re entering on a Buy Stop, DO NOT set your SL until after the breakout! 🚀 Place it where I say (or wherever you dare 😈), but remember—your risk, your rules! ⚠️🔥"
📍 Thief SL Placement: Nearest swing low (1H timeframe) – 2.23700 (adjust based on risk & lot size).
🎯 Profit Target: 2.28700 (Time to escape with the loot!)
⚡ Scalpers’ Note: Only scalp LONG! Big wallets? Go all in. Small wallets? Ride the swing. Use trailing SL to protect your stolen cash! 💰
📰 WHY THIS HEIST? (Fundamental Edge)
GBP/NZD is showing bullish momentum due to:
Macroeconomic factors
COT Report insights
Sentiment shifts & intermarket trends
🔗 Full analysis? Check our bio0 for the deep dive!
⚠️ Trading Alert: News = Danger Zone! 📰🚫
Avoid new trades during high-impact news.
Use trailing stops to lock in profits & dodge volatility traps.
💥 BOOST THE HEIST!
💖 Support the robbery crew—SMASH THAT LIKE BUTTON! 💖
🚀 More heists coming soon—stay tuned, thieves! 🏆🤝🎉

Gold Price Rises on Tariff Tensions and Geopolitical RisksGold jumped nearly 3% as President Trump announced plans to double tariffs on U.S. steel and aluminum imports to 50% starting June 4, fueling safe-haven demand and weakening the U.S. Dollar. The EU expressed strong regret and warned of potential countermeasures.
The rally continued on Tuesday (June 3) as geopolitical tensions escalated. Ukraine launched its largest drone attack on Russian airbases, while Moscow responded with long-range strikes on Kyiv. These events, combined with weak U.S. ISM Manufacturing PMI (May: 48.5, lowest since Nov), added to market anxiety.
Investors are watching the Fed’s upcoming statements for clues on rate direction. Lower interest rates and global instability continue to support gold’s bullish case.
Technical Outlook – XAUUSD
Gold hit $3,371, then pulled back slightly, but remains on track to reach $3,400 soon. A short-term bullish channel is forming, and RSI above 50 suggests more upside potential.
Pullbacks above the 21-day EMA and 0.382 Fibonacci level are likely temporary corrections or buy opportunities.
Support: 3,326 – 3,300 – 3,292
Resistance: 3,371 – 3,400 – 3,435

XAUUSD – Poised for a Major Breakout After ConsolidationOn the monthly chart, XAUUSD is forming an Inside Bar pattern, signaling that the market is compressing ahead of a potential strong move. May’s candle remains within April’s range – a classic setup that often precedes a decisive breakout.
On the H4 timeframe, gold has attempted to break above recent highs multiple times but failed, forming a series of lower highs, indicating a corrective structure. However, the recent rebound from May’s low suggests potential accumulation is underway.
Currently, price is hovering around a neutral zone. A clear break above the 3,400 level could spark a fast move toward the 3,500–3,600 range. Conversely, a drop below 3,120 would open the door for a deeper pullback toward 3,000.
From a macro perspective, long-term fundamentals continue to support the bullish case for gold, driven by dovish central bank policies, geopolitical risks, and concerns about USD debasement. Still, a confirmed technical breakout is needed to establish direction in the near term.
Strategy Summary
Buy zone to watch: 3,307 – 3,320
Bullish trigger: Holding above 3,300
Target: 3,435
Risks: False breakouts or failure to hold above the breakout zone

03.06.25 Morning ForecastPairs on Watch -
FX:EURUSD
FX:GBPAUD
FX:AUDUSD
FX:AUDCAD
A short overview of the instruments I am looking at for today, multi-timeframe analysis down to what I will be looking at for an entry. Enjoy!

$ASTS Trade Alert Setup - 26% Upside🚨 NASDAQ:ASTS Trade Alert Setup 🚨
Falling Wedge Breakout at $24.37 =
🎯 $29.07 📏 $30.77
Trading Plan: July 11th $26 Calls on Breakout or shares

DXY Short-Term Reversal Zone in SightUS Dollar Index (DXY) is approaching a strong support zone at 98.90–98.00, which has historically acted as a base for bullish reversals. The price is now testing the lower bound of this zone after a steady downtrend from the 101.94 high.
Key Technical Structure:
Support Zone: 98.90–98.00 (tested 3+ times)
Double Bottom Potential forming if bulls hold the zone
Upside Targets:
101.94: Key horizontal resistance
103.50: Swing high from early April
Scenarios to Watch:
🔹 Bullish Rebound:
Price bounces off 98.90–98.00 support
Confirmation: Break and close above 100.50 near-term resistance
Could fuel move back to 101.94, possibly 103.50
🔹 Bearish Breakdown:
Daily close below 98.00 would invalidate bullish setup
Opens downside to 97.00 and even 95.50
Macro Drivers to Watch:
FOMC speakers and interest rate guidance
US jobless claims or inflation surprise
Risk-off sentiment (benefits USD) vs. continued global risk appetite
Conclusion:
DXY is trading at a make-or-break support zone. Watch for clear bullish reaction or bearish breakdown before committing. The setup favors a bounce unless 98.00 fails.

Gold Price Analysis June 2With the recovery waves of the D1 frame, the position of Gold returns to the wide Sideway near the ATH zone
3360 and 3260 sideway 100 price for the current trend. And today it is still possible to break this zone.
GOLD increased strongly in the European session, touching the upper border of the sideway model
The h1 wave is still a more bullish wave. With the support zone opening the GAP of the Asian session 3296 is still considered a strong support zone today. The breakout zone in the morning also becomes an important support zone
In the opposite direction of the break 3360, there is still a zone 3368 as the immediate resistance before the Gold price is on the way to ATH. Attention daily resistance 3396

AUDUSD Hello traders. Wishing everyone a productive week ahead!
Today, the U.S. Manufacturing PMI (May) and the ISM Manufacturing PMI (May) reports will be released — both are high-impact events for the markets. This week, in particular, is expected to be news-heavy.
That said, it’s wise to remain cautious with trades. My plan is to open a few trades before the news and close them beforehand. One of these opportunities has emerged on the AUDUSD pair. I’ve already taken a Buy trade, and it's currently active.
This setup has two key Take Profit zones:
First TP: 0.6487
Second TP: 0.65137
I’ve personally targeted the first TP level, so I’ll be sharing the details of that trade. However, the same structure applies to the second target as well if you choose to aim higher.
🔍 Trade Details:
✔️ Timeframe: 15-Minute
✔️ Risk-to-Reward Ratio: 1:1 / 1:1.50 / 1:2
✔️ Trade Direction: Buy
✔️ Entry Price: 0.64587
✔️ Take Profit: 0.64865
✔️ Stop Loss: 0.64446
🔔 Disclaimer: This is not financial advice. I’m simply sharing a trade I’ve taken based on my personal trading system, strictly for educational and illustrative purposes.
📌 Interested in a systematic, data-driven trading approach?
💡 Follow the page and turn on notifications to stay updated on future trade setups and advanced market insights.

GBPJPY - Monday's Action Could Spark Upside MoveThe GBP/JPY pair is currently positioned at a critical juncture around the 193.902 level, sitting near important support zones that have been highlighted on the chart. The currency pair has shown considerable volatility over the past month, with price action oscillating between well-defined support and resistance levels, creating a clear range-bound structure. As we approach Monday's trading session, the focus will be on whether the current support level can withstand any potential selling pressure. If this support zone holds firm and buyers step in to defend these levels, we could see a significant move to the upside, potentially targeting the upper resistance zone around the 196+ area that has previously capped rallies. The technical setup suggests that a successful defense of support could trigger renewed bullish momentum, making Monday's price action crucial for determining the pair's short-term directional bias and whether it can break out of its recent consolidation pattern.
Disclosure: I am part of Trade Nation's Influencer program and receive a monthly fee for using their TradingView charts in my analysis.

US100 - Bullish Momentum Favors Upside ContinuationThe US Tech 100 is displaying strong bullish momentum after successfully breaking above the critical resistance level at 20,659.8, which had previously acted as a significant barrier. Currently trading at 21,316 the index has demonstrated impressive upward trajectory following what appears to be a healthy consolidation phase around the key resistance-turned-support zone. The technical setup strongly favors continuation to the upside as the higher probability scenario, with the breakout above 20,659.8 potentially opening the door for further gains toward higher resistance levels. However, prudent risk management suggests taking this rally piece by piece, monitoring how price action develops at each significant level while watching for any signs of exhaustion or pullback that might offer better entry opportunities. The bullish bias remains intact as long as the index maintains its position above the former resistance level, which should now serve as dynamic support for any potential retracements.
Disclosure: I am part of Trade Nation's Influencer program and receive a monthly fee for using their TradingView charts in my analysis.

XAUUSD - Key Inflection Point AheadLooking at this gold spot chart, the precious metal appears to be consolidating within a defined range after experiencing significant volatility throughout May. The price is currently trading near the upper boundary of the marked support zone around $3,250-$3,260, following a recent pullback from higher levels. Given the technical setup and the proximity to this key support area, there's a strong probability that gold will retest this support zone in the coming sessions. This retest will be critical in determining the next directional move - if the support holds and buyers step in, we could see a bounce back toward the upside targeting previous resistance levels, potentially challenging the recent highs. However, if the support fails to hold under selling pressure, gold could continue its downward trajectory, opening the door for further declines toward lower support levels. The market's reaction at this support zone will likely dictate whether the current consolidation resolves bullishly or bearishly.
Disclosure: I am part of Trade Nation's Influencer program and receive a monthly fee for using their TradingView charts in my analysis.

Strategy & Education: Trading with Fibonacci and Order Blocks🔍 Trading Strategy Based on Fibonacci Levels and Order Blocks
This chart showcases three consecutive sell trades I executed on the BTCUSDT pair, each resulting in a profitable outcome. The purpose of this explanation is to demonstrate how Fibonacci retracement levels can be combined with Order Block zones to identify high-probability trade setups.
🧩 The Foundation: Understanding Price Retracement Behavior
The ABC, abc, and (a)(b)(c) structures marked on the chart are not Elliott Waves. Instead, these labels are used to represent simple retracement movements in the market. The focus here is not wave theory, but recognizing how price reacts and pulls back after a move, and how we can benefit from these reactions.
📌 Trade 1: Primary Fibo-OB Confluence
I drew a Fibonacci retracement from the A wave to the B wave.
The price then retraced to the C area, landing between the 0.618 and 0.786 Fibonacci levels, where an Order Block (OB) was also present.
This overlap created a strong technical and structural resistance zone.
I entered the first sell trade from this confluence.
📌 Trade 2: Internal Retracement and OB Alignment
Inside the first corrective move, a smaller abc pattern formed.
I applied Fibonacci again from small a to small b.
The c leg reached the same key Fibonacci zone (0.618–0.786) and overlapped with a second OB.
This confluence offered a second sell entry.
📌 Trade 3: Micro Structure – Same Logic Reapplied
I repeated the exact same logic one more time on a micro (a)(b)(c) structure.
Fibonacci from (a) to (b), price touched 0.618–0.786, coinciding again with an OB.
This became the third and final sell position.
🧠 The Logic Behind the Strategy:
Price doesn’t move in straight lines—it flows in waves. During pullbacks, if Fibonacci levels align with Order Block zones, the market tends to react strongly. My focus here was to identify these areas of confluence in advance and enter trades at high-probability turning points.

Kava : Day trade volumeKava can show new volume on day trade volume. We will follow this coin in the coming time frames for the uptrend.

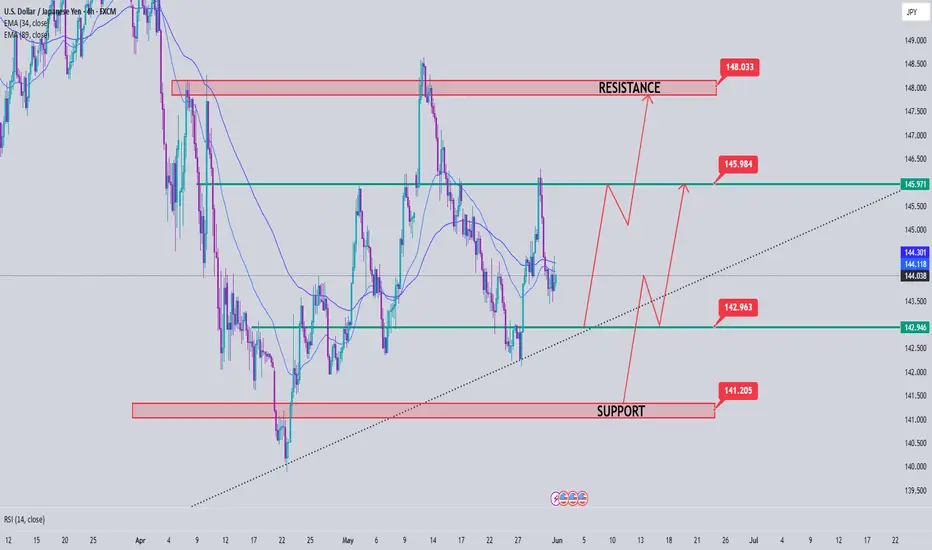
USDJPY Analysis week 23Fundamental Analysis
Tokyo's core CPI (excluding fresh food) - a key inflation gauge - rose 3.6%, higher than forecast and last month. This increases the possibility that the Bank of Japan (BoJ) will continue to raise interest rates this year, although most experts predict the BoJ will keep rates unchanged until September.
Meanwhile, the USD rose sharply after a US appeals court overturned the decision to remove most of the tariffs imposed by Mr. Trump. However, the Yen still appreciated slightly against the USD.
Technical Analysis
After consecutive declines on Friday, the pair is sideways waiting for the next development. 142.900 is the next support zone that the pair faces, this is the breakout zone and also the trendline meeting. Break this price zone must wait 141,200 for weekly support zone
145,900 last week's peak resistance zone acts as resistance for the pair's price reaction towards this week's resistance peak around 148,000
Pipping the Aussie-Swiss Bank: Day Trading Strategy UnleashedUltimate AUD/CHF Forex Heist Plan 🚨 Swing Trade Mastery for Epic Gains! 🚀
Greetings, Wealth Warriors & Market Mavericks! 👋💸
Get ready to execute a legendary heist on the AUD/CHF "Aussie vs Swissy" Forex market with our exclusive Thief Trading Style! 🎯 This meticulously crafted strategy blends technical precision and fundamental firepower to maximize your profits. Follow the plan outlined in the chart, focusing on a long entry to conquer the high-risk Yellow MA Zone—a battleground of overbought conditions, consolidation, and potential trend reversals where bearish bandits lurk. 🐻 Stay sharp, lock in profits, and trade safely! 💪🎉
Entry 📈: The heist begins! Watch for the MA pullback in the market maker’s trap zone (0.52200 OR above) to strike. Bullish riches await! Set buy stop orders above the Moving Average or place buy limit orders within the 15 or 30-minute timeframe’s recent swing low/high.
Pro tip: Set an alert to catch the breakout entry in action! 🔔
Stop Loss 🛑: Place your Thief SL at the recent swing low/high on the 4H timeframe for swing trades basis. Adjust SL based on your risk tolerance, lot size, and multiple orders.
Target 🎯: Aim for 0.54800 or make a swift exit before the target to secure your loot!
🧲 Scalpers, listen up! 👀 Stick to long-side scalps. Big players can jump in now; others, join the swing trade heist. Use a trailing SL to protect your stash. 💰
💵 AUD/CHF "Aussie vs Swissy" Forex Heist Plan (Swing Trade) is riding a bullish wave 🐂, fueled by critical market drivers. Dive into the fundamentals—Macro Economics, COT Reports, Quantitative Analysis, Intermarket Analysis, Sentiment Outlook, and Future Trends—before launching your heist. Check the linkKs for the full scoop! 🔗👉
📌 Markets move fast, so stay vigilant and adapt your analysis to the latest developments.
⚠️ Trading Alert: News & Position Management 📰🚨
News releases can shake up prices and volatility. Protect your positions by:
Avoiding new trades during news events
Using trailing stop-loss orders to lock in gains
💖 Boost our heist plan! 💥 Hit the Boost Button to supercharge our team’s strength and make stealing profits a breeze. With the Thief Trading Style, you’ll conquer the market daily with ease! 🏆🤝🎉
Stay tuned for the next epic heist plan, Money Makers! 🤑🐱👤🚀

COOLING PCE – GOLD REBOUNDS ON EXPECTATIONS OF FED POLICY EASINGIf the upcoming PCE report shows that inflation continues to cool or comes in below expectations (e.g., core PCE under 0.2% m/m), this could reinforce market expectations that the Federal Reserve (Fed) may have room to begin cutting interest rates sooner—potentially as early as September instead of year-end.
This would weaken the US dollar and push down Treasury yields, both of which typically support gold prices, as the opportunity cost of holding non-yielding assets like gold decreases.
Short-term forecast:
Gold may rebound to the $3,330 – $3,340/oz range.
A breakout above the psychological resistance level of $3,345 could signal a medium-term uptrend.
Trading volume is likely to rise as ETF funds begin accumulating positions again.
Suggested strategy:
Buy XAUUSD around the 3310 – 3313 area
Stoploss: 3300
Take Profit 1: 3325
Take Profit 2: 3335
Take Profit 3: 3345

Gold prices fell below for a weekly.Gold FX:XAUUSD prices fell below $3,310 an ounce on Friday, on track for a weekly decline of more than 1%, as investors remained cautious ahead of the U.S. PCE inflation report, which could provide new insight into the Federal Reserve’s interest rate path.
On Thursday, bullion prices rose nearly 1% after a federal appeals court allowed President Donald Trump's sweeping tariffs to temporarily take effect, just one day after the U.S. Court of International Trade blocked their implementation, deeming the method used to enact them "unlawful." Meanwhile, San Francisco Fed President Mary Daly said on Thursday that policymakers could still deliver two rate cuts this year, as expected in March, but emphasized that rates should remain steady for now to ensure inflation is on track to meet the Fed’s 2% target.
XAUUSD TVC:GOLD Trading Strategy Around Price Levels:
SELL XAUUSD CAPITALCOM:GOLD around the 3326–3328 area
Stoploss: 3333
Take Profit 1: 3322
Take Profit 2: 3317
Take Profit 3: 3310
BUY XAUUSD around the 3278–3280 area
Stoploss: 3273
Take Profit 1: 3284
Take Profit 2: 3289
Take Profit 3: 3295
Note: Always set a Stoploss in all situations to ensure safety.

Gold Price Analysis May 30Candle D shows strong buying power on Thursday, most likely today Asia and Europe will decrease and the US session will return to the uptrend.
The bearish wave structure is heading towards 3280. This zone can be bought in Asia and Europe. In the US session, wait for the price reaction to break this zone, limit buying until the bottom of 3254.
Break 3254 confirms the downtrend and heads towards the two support zones 3238 and 3211
When the support zones bounce up, a nice bullish wave is formed and do not SELL Scalp until the 3320 zone. If you break, keep the BUY order up to 3343.

30.05.25 Morning ForecastPairs on Watch -
FX:EURUSD
A short overview of the instruments I am looking at for today, multi-timeframe analysis down to what I will be looking at for an entry. Enjoy!

Breaking News: U.S. Federal Court Blocks Trump’s Tariff PolicyOn Wednesday (local time), a U.S. federal court blocked the tariff policy announced by President Trump on April 2nd, known as "Liberation Day." The court ruled that Trump exceeded his authority by imposing broad tariffs on countries that export more goods to the U.S. than they import from the U.S.
Analysis:
This decision could ease global trade tensions in the short term, especially for major export markets to the U.S. such as China and the European Union. Investors may expect more stability in supply chains and reduced cost pressures from tariffs.
Affected Stock Groups:
Heavy industry and manufacturing companies, particularly in steel, aluminum, and chemicals, may benefit from the blocked tariffs.
Technology, electronics, and consumer goods stocks with global supply chains could see reduced risks from increased tariff costs.
Conversely, U.S.-based companies focused on domestic markets might face increased competition due to lower tariffs on imports.
Investors should closely monitor political developments and any follow-up actions from the U.S. administration to adjust their strategies accordingly.
