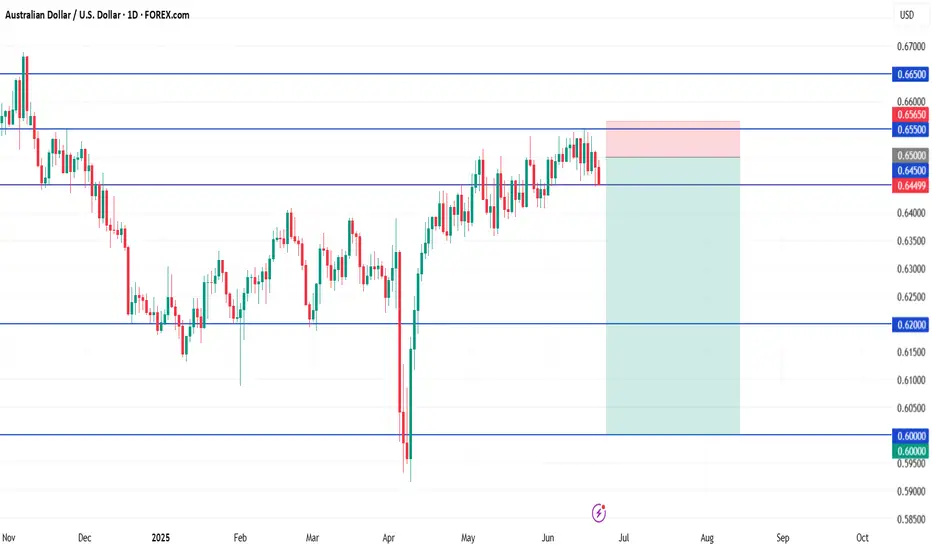
AUD/USD ShortStandard / Aggressive Entry
Sell Limit: 0.6500
Stop Loss: 0.6565
TP1: 0.6200
TP2: 0.6000
Why: Likely to trigger sooner, even on light retracement or spread spike.
🛡️ Conservative Entry
Sell Limit: 0.6520
Stop Loss: 0.6580
TP1: 0.6200
TP2: 0.6000
Why: Waits for a deeper, cleaner pullback toward top of resistance zone. Safer but may not trigger.
Tradeanalysis
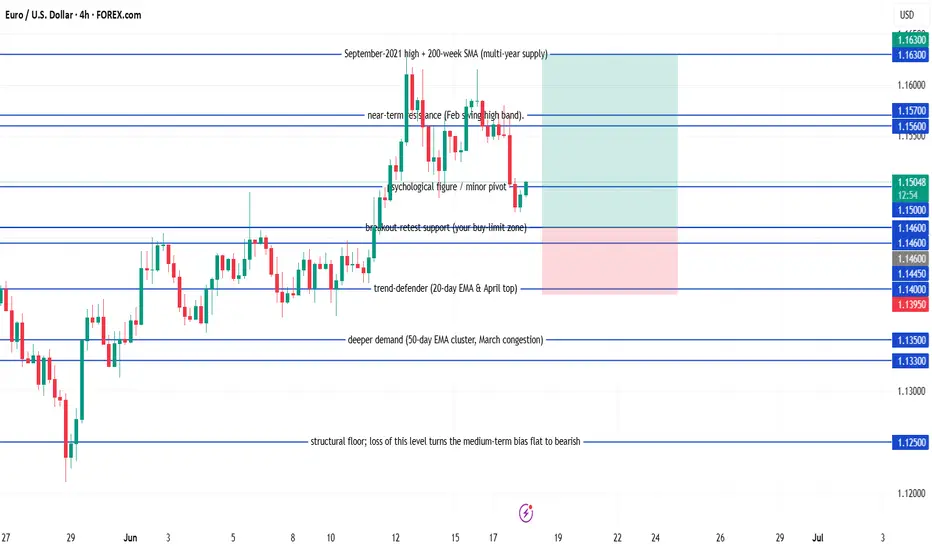
EUR/USD Buy EUR/USD pull-back long
Buy-limit at 1.1460
Stop-loss at 1.1395
Take-profit 1 at 1.1560 – when this first target is reached, move the stop to breakeven
Take-profit 2 at 1.1630
Condition: keep the order active only while the daily candle continues to close at or above 1.1445.
Expiry: if the order hasn’t been filled after five full trading days, cancel it and reassess.
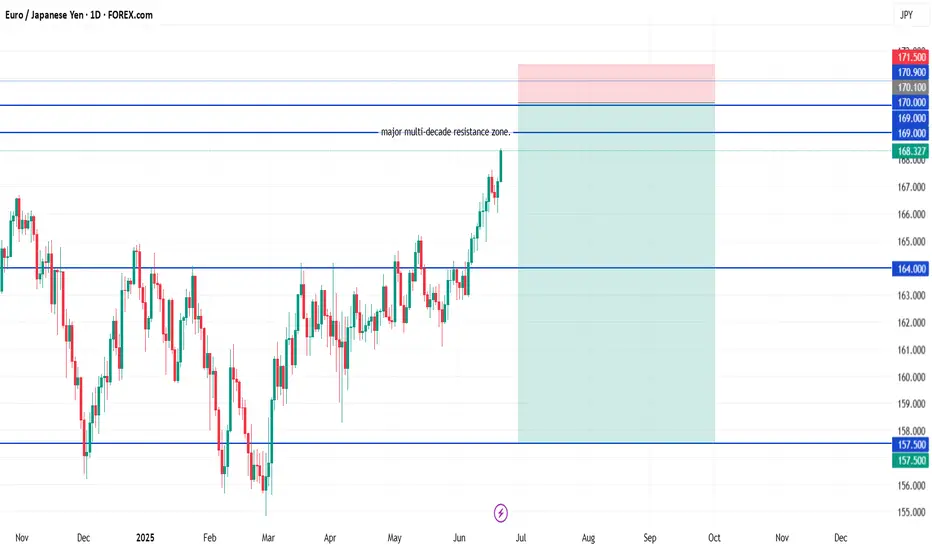
EUR/JPY Short✅ EUR/JPY Swing Short Setup (Multi-Entry)
🎯 Entries:
Entry 1: 169.00 (light position)
Entry 2: 170.10 (core entry)
Entry 3: 170.90 (final top entry)
🛡️ Stop Loss (Unified):
171.50
Placed above the entire resistance zone and previous all-time wick highs, allowing for normal trap behavior without overexposure.
🎯 Take Profits:
TP1: 164.00
TP2: 157.50
You can scale out partially at TP1 or run the full position to TP2 depending on how momentum builds.
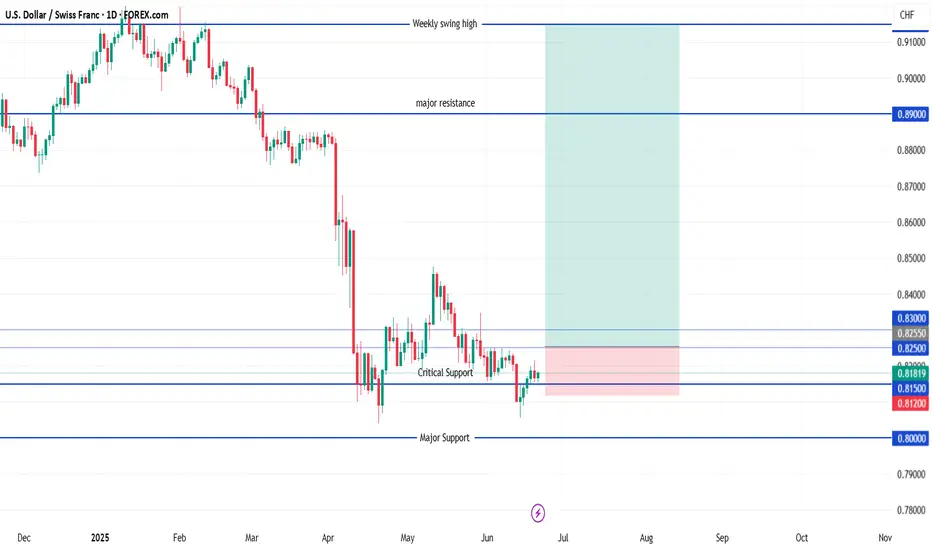
USD/CHF Buy🎯 Long Entry Strategy
🔸 Standard (Conservative) Breakout Entry
Entry: 0.8255 (daily close above key compression + reclaim zone)
Stop Loss: 0.8120 (below 0.8150 structure + most recent wick low)
Target 1: 0.8300 (minor resistance)
Target 2: 0.8900 (major weekly resistance)
Target 3 (Optional Hold): 0.9150 (weekly swing high)
✅ Best if you want confirmation. Higher probability but less RR.
🔸 Aggressive Limit Entry (Inside Range)
Entry: 0.8155 (retest of support zone)
Stop Loss: 0.8040 (below April + June wick lows)
Target 1: 0.8300
Target 2: 0.8900
Target 3: 0.9150
⚠️ Best for RR, but higher chance of drawdown or stop-out.
AUD/JPY Short Trade Plan Options
✅ Standard Entry
Sell Limit: 94.80
Stop Loss: 96.10
Take Profit 1: 90.00
Take Profit 2: 85.00
Why: Clean entry inside rejection zone, just under multi-decade resistance. Gives room for price to wick higher without being stopped prematurely.
🛡️ Conservative Entry
Sell Limit: 95.20
Stop Loss: 96.30
Take Profit 1: 90.00
Take Profit 2: 85.00
Why: Waits for deeper retracement into top of range. Better R:R, but may not trigger if price weakens early in the week.
🔐 Optional Manual Confirmation Strategy
Watch for a bearish daily candle (pin bar, engulfing) inside 94.50–95.50
Enter at close of that candle with stop above candle high
Gives added confirmation but may reduce reward slightly

EUR/CAD BuyEntry – Buy-limit 1.5560 (front-run zone); back-up bid 1.5520 if you ladder.
Stop-loss – Hard stop 1.5410 (below 1.5500 break-fail line).
Targets
TP1 1.5750 – lock ~1.5 R; trail stop to break-even.
TP2 1.5900 – cash majority.
Runner 1.6000 – only if momentum is strong.
Expiry: cancel if not filled after 5 trading days.

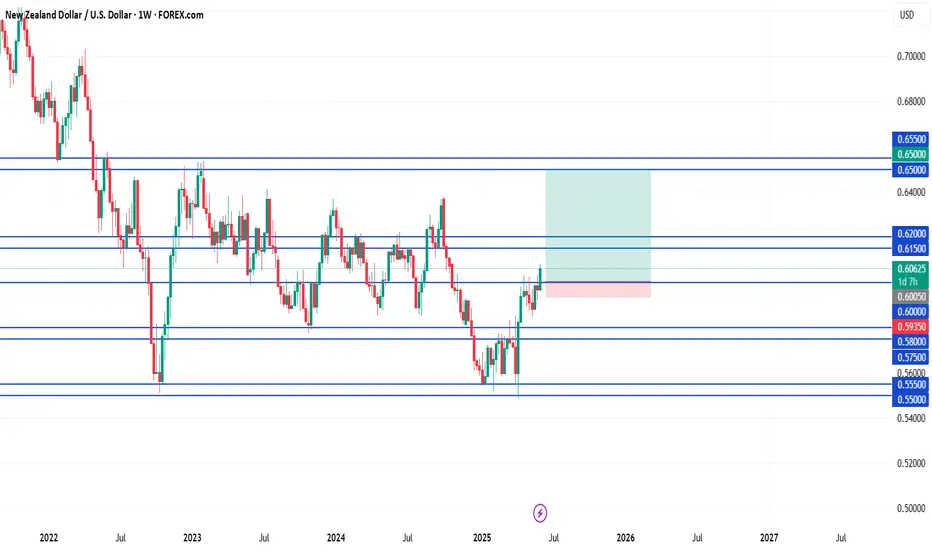
NZD/USD Buy Pullback Buy Setup
Entry Zone: 0.6000 – 0.6020
Retest of breakout + daily demand zone
Stop Loss: Below 0.5950 (ideally 0.5935 to avoid wickouts)
Target 1: 0.6150
Target 2: 0.6200
Target 3: (optional swing) 0.6500 if holding long-term
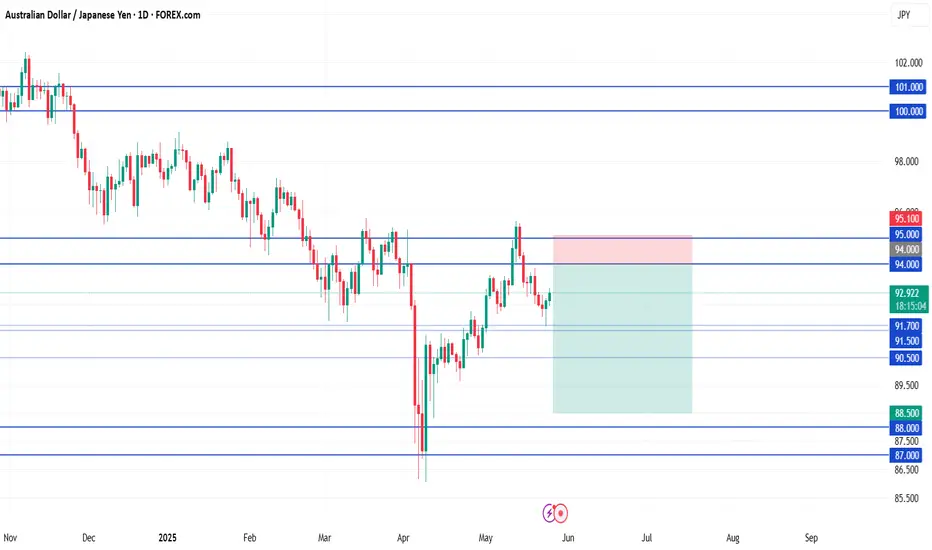
AUD/JPY Short📍 AUD/JPY Short Setup – Sell Limit Order
Entry: 94.00
(clean retest of daily + weekly resistance zone, aligned with previous structure)
Stop Loss: 95.10
Take Profit 1: 91.00
(recent support shelf with high reaction probability)
Take Profit 2: 88.50
(strong weekly support zone; ideal mid-term target if momentum continues)
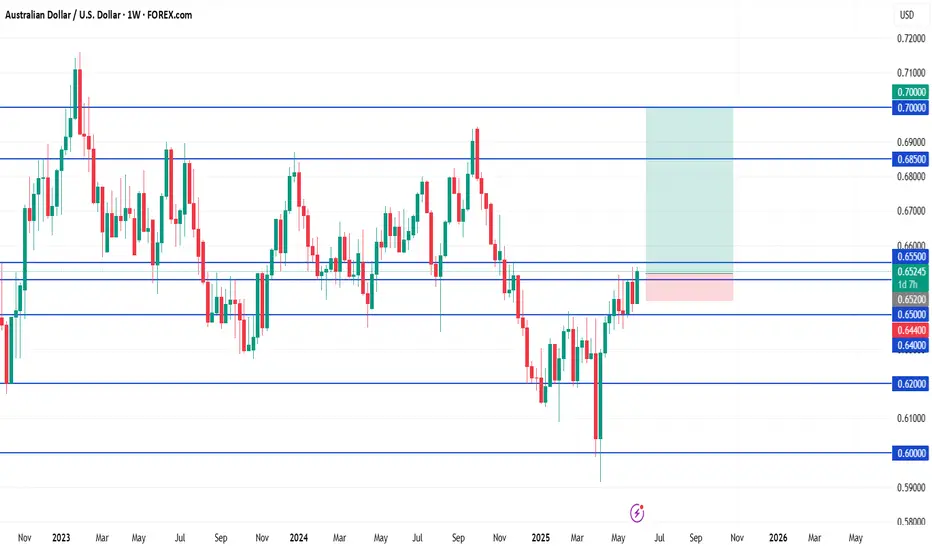
AUD/USD BuyBuy (Bullish breakout continuation)
✅ Entry Conditions (Wait for confirmation first):
Daily candle must close above 0.6550 with strength (not a wick rejection).
After breakout, wait for a retest back into the 0.6500–0.6520 zone.
Only enter if price shows bullish rejection off that zone (e.g., wick rejections, bullish engulfing, or small-bodied doji followed by green candle).
📍 Trade Setup
Buy Limit– 0.6520
Stop Loss (SL): 0.6440 (below the retest structure)
Take Profit 1 (TP1): 0.6700
Take Profit 2 (TP2): 0.6850
(Optional TP3): 0.7000 (stretch target)
AUD/CAD Short🔻 AUD/CAD Short Setup (High-Probability Rejection Play)
🔹 Entry Zone:
0.8990 – 0.9060
Ideal entry: 0.9020 (mid-zone if price stalls or forms a wick)
🔺 Stop Loss:
0.9120 (above all 2023–2024 highs and structure traps)
This SL protects you from a true breakout
🎯 Targets:
TP1: 0.8800 (prior swing lows / first clean zone)
TP2: 0.8650 (mid-range support with confluence)
TP3 (extended): 0.8500 (range bottom — aggressive but clean if momentum kicks in)

GBP/USD Long🟢 Bullish Play (High Probability)
Plan: Break-and-Retest Strategy
Entry: Wait for daily close above 1.3200, then set buy limit at 1.3060
SL: 1.2890
TP1: 1.3300
TP2: 1.3600
TP3: 1.4000 (macro breakout target)

Trade analysis EURAUD 01.04.2025Hi,
very good patten /setup was form in EURAUD , this patten is very identical in forex/crypto/other market, usually built in TOP or bottom ..
comment if you find similar..
Do not ask for Buy or Sell tips.
I/We are not SEBI Registered Advisors. We don't provide any types of Buy/Sell signals. This is purely for educational and learning purposes. i/We shall not be responsible for your profit or loss. Please confirm with your financial advisor.

AUD/CAD Short🔍 Technical Context:
Market Structure:
Price is in a long-term sideways range with lower highs. AUD/CAD is struggling to break above the 0.90–0.91 region, showing signs of exhaustion.
Zone of Interest (Supply):
Purple box: 0.9000 – 0.9100
A clean historical rejection zone that has acted as both support and resistance multiple times since 2022.
Entry Type:
Sell Limit @ 0.9070 placed slightly below the top of the resistance zone to increase likelihood of getting triggered on a spike.
Stop Loss:
0.9175 – above multiple wick rejections and key structure highs. Allows breathing room for volatility without compromising the structure.
Take Profit Targets:
TP1: 0.8650 (conservative target at strong support)
TP2 (optional extension): 0.8500 (major long-term range low)
Risk-Reward Ratio:
~1:3 minimum to TP1, potentially 1:4+ if extended to 0.8500.
🧠 Strategic Notes:
Trigger Conditions:
Wait for a retrace to the 0.9070 zone rather than enter at market open. This is based on the idea that a final upward effort could grab liquidity and fill your limit.
Monthly Candle Watch:
Monday is month-end. Monitor the monthly close to determine if the structure still supports the trade idea. If the close is strongly bullish and you’re triggered early, be open to closing the trade early to avoid deeper drawdown.
Why It’s High Probability:
Multi-year horizontal structure
Repeated failure to hold above 0.90
Candlestick wicks rejecting the same zone
Fundamentals slightly favor CAD over AUD (higher real yields, oil correlation)
Defined invalidation point and asymmetric reward

WHAT WILL BE THE NEXT MOVE OF GOLD ?🚀 GOLD (XAU/USD) – High-Probability Trade Setups! 🚀
Hey, traders! Hope you're all geared up for another exciting week in the markets! 🏆 As we get ready for the market open, let’s break down what’s next for Gold (XAU/USD).
📊 Last Week’s Recap
📈 Gold hit 3057, but before the market closed, we saw a strong rejection pushing price back down. Now, Gold is stuck in a range between 3024 resistance and 3020 support—meaning we need a breakout before taking action!
💡 No-trade zone = 3020 - 3024 ❌ Stay out until a breakout happens!
Two Possible Trading Scenarios
🔵 Scenario 1: Buy Above 3024
📌 If a 30M candle closes above 3024, we wait for the next candle to wick down while keeping the previous low safe.
📌 Once price breaks the high of the previous closed candle, we enter buys targeting 3034! 🚀
✅ Break-even after 40 pips—lock in those profits! 💰
🔴 Scenario 2: Sell Below 3020
📌 If a 30M candle closes below 3020, we wait for the next candle to wick up while keeping the previous high safe.
📌 Once price breaks the low of the previous closed candle, we enter sells targeting 3011! 📉
✅ Break-even after 40 pips—protect your capital!
📍 Final Trade Plan
📊 BUY above 3024 🎯 TP: 3034
📊 SELL below 3020 🎯 TP: 3011
📢 Don’t chase trades! Let the market confirm and follow the plan! 📈🔥 #XAUUSD #GoldAnalysis #ForexTrading #SmartMoney

BTCUSD TOUCHED 85000 REVERSAL ?What’s up, traders? I’m here to drop free game, sharp analysis, and top-tier trade setups! 🎯 Let’s get straight to it:
🔍 Market Insight
🔸 BTC/USD has been consolidating since Friday night now it broke the consolidation and touched 85000 which was awaiting from long way we posted an idea with a buy entry but price missed our entry area and flyed
🔸 A liquidity sweep at 84789 on the 30M timeframe confirms smart money movements.
🔸 Strategy: After a liquidity grab, we shift to the 1-minute timeframe to confirm a Change of Character (ChoCh) for a sniper entry! 🎯
🔥 Trade Execution
✔️ Order Block marked at 84,900.
✔️ Sell limit at 84,900 – catching this right at the sweet spot!
✔️ Stop-loss 85,200 (-30 pips) to manage risk.
✔️ Take-profit 84,100 (+80 pips) – smooth 1:2.5 risk-reward!
📊 Technical Breakdown
🟢 Bias: Bullish – buyers in control!
⚠️ Lock in profits after 30 pips – don’t get greedy!
📌 Final Setup
💰 Sell Limit: 84,900
⛔ Stop-Loss: 85,200
🎯 Take-Profit: 84,100
💸 Let’s ride this move and secure the bag! 🚀💰 #CryptoSignals #BTCUSD #SmartMoney #ForexTrading

Sugar LongInto higher timeframe support on weekly chart.
The take profit is the moving average so will come lower over time.
Because trade is taken off a daily chart you will have to trail stop accordingly.

GBPUSD WEEKLY OUTLOOKThe daily timeframe market structure is showing a clear bearish trend. Price has failed twice to break the last low high to create a new trend. Therefore, the trend remains bearish and we should only look for sells.
However, on the 4H timeframe, we do not have a clear confirmation on which direction the price wants to move. Yes, we have the long-term trend, but the market is not yet set up on the lower timeframe. Price have been ranging from Jan 27th to the present day. We shall wait for a clear BOS on the 4H timeframe before we look for an entry.


GBPUSDHey Traders, what you think of this trade?
Price had 61.8% retracement.
Will it Break the High and go bullish or Low and bearish. Think in probabilities.
My analysis on GBPUSD Buy with a micro lot for Long till 1.3000, Strict Risk 1:3.
Notes for Success:
Timeframes Matter: Align entry/exit with higher-timeframe trends.
Adapt: Adjust targets if volatility spikes (e.g., news events).
Disclaimer: Always include “Not financial advice. Trade at your own risk.”
Comment your analysis below. Thank you

GBPUSD took support from 4h bullish channel – Targeting $1.265Market Context
Instrument: GBPUSD
Timeframe: 4h
Key Trend: Reversal from short 4h downtrend
Catalyst: support from 4h bullish channel + Elliott wave 4 completion.
Technical Analysis
Patterns/Levels: Price broke above the $1.2400 strong support of a 4h bullish channel.
Indicators: MACD bullish crossover; RSI above 50.
Entry Analysis
Entry Zone: 1.24250.
1.2645 (4h key resistance, Caution if fail to break).
Confirmation: support above $1.2400 on the 4h chart.
Exit Analysis
TP1: $1.2575 (prior swing high).
TP2: $1.265 (Wave 5 target).
Risk Management
Stop Loss: $1.2393 (below Support 1.2400).
Risk-Reward: 1:4.
Conclusion
“The support from 4h bullish channel signals a trend reversal.
Targeting $1.2650 with a tight SL ensures favourable risk/reward.”
Notes for Success:
Timeframes Matter: Align entry/exit with higher-timeframe trends.
Adapt: Adjust targets if volatility spikes (e.g., news events).
Disclaimer: Always include “Not financial advice. Trade at your own risk.”

Time to "ZOOM" back to winnings ways?On Thursday afternoon, the King Trading Momentum Strategy triggered alongside eleven other alerts, followed by five more on Friday. This flurry of signals doesn’t exactly indicate a “bearish” sentiment, but as always, the market has its unpredictable ways! With markets approaching all-time highs, I’ve been cautious, limiting my positions to just a few with low allocations in TNA, ADBE, PYPL, and XYZ.
When I analyzed Zoom (ZM), I noticed that it experienced a strong rally from July through the end of the year, gaining over 50%. Now, the key question is: has it finished consolidating, or is there more downside ahead?
Looking back to July, ZM’s performance suggests a classic bull flag pattern. It’s retraced to the 38% Fibonacci level, and during a two-hour window when the signal fired, the impressive “wick” formed caught my attention. Now, after a short-term pump, it’s retracing again, and I’m eyeing the 50% Fibonacci level as a potential entry point.
Unless Monday brings a major selloff due to concerns over the Fed meeting on Wednesday or the PCE data on Friday, I’ll likely use the usual morning volatility to position myself in this trade. Let’s see how this one unfolds!
The King Trading Momentum Strategy employs a robust combination of indicators: the 5 EMA crossing above the 13 EMA, RSI strength, favorable momentum measured by ADX+, and MACD confirmation. ZM, along with over 100 other equities, is integrated into this script with optimized backtested take-profit and stop-loss levels. Activating these parameters is as simple as checking a box (they’re off by default), making this strategy both powerful and user-friendly.

AUD/USD Bullish Trade Set Up! A lot of Confirmation! Tap In Now!We are seeing AUD/USD rebound from a 4-day bearish push to .61300 to new highs around the .62000 level. The .62000 level has been holding strong as a resistance level; four separate times it has held the market below it.
It has now broken back above previous lows and is now retesting to the support line and is looking to move around the .61800 level.
We are also hovering between the 50 and 200 EMA levels, with the EMAs starting to converge.
Another sign we see is an inverse shoulder head shoulder on the 1 hour. The low of the right shoulder is the black box at .61700, and we don't want to see the market break below that point. If it breaks below the black low box, it is an indication of bearish strength.
Move Summary: We want to see it make a move to break through the .62000 level to break into more buy territory and create new highs. A break above the 200 EMA would be another signal for bullish confirmation. Our target will be the MONEY box for a 3:1 trade.
Like, Comment, and Follow if you agree with this Idea! Let's Connect!

Bullish channel in to Imbalance (GOLD)price doesn't look great today, but I see a potential setup to go long. I need to see the price break above the 1-minute lower-high (LH) swing level. Once that happens, I can look for a Fair Value Gap (FVG), imbalance, or other indicators. I will only take a trade after the price retraces to a FVG, imbalance, or order block, and I will look for a bullish momentum candle in those areas of interest.
