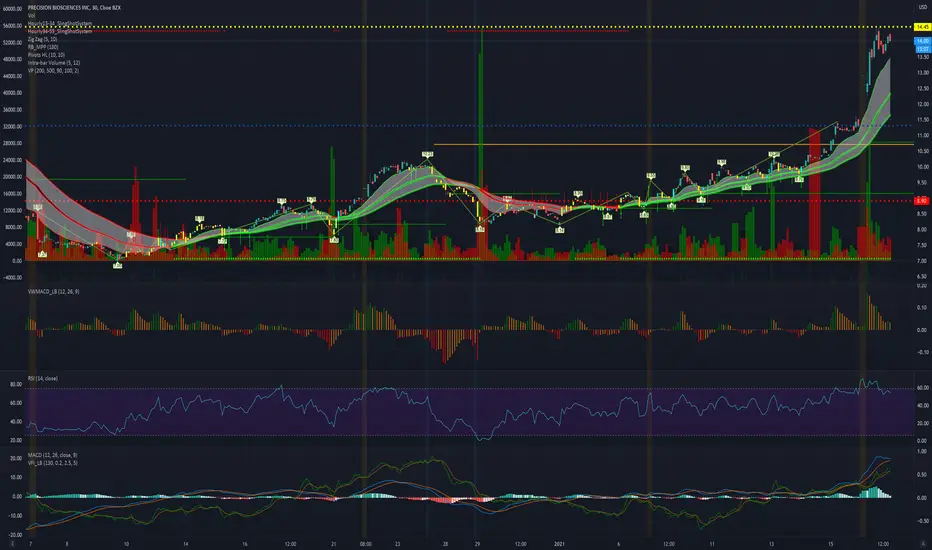
DTIL Morning Mover Alert UpdateExpecting a 15-17% Swing on DTIL as the stock rounds off from it's previous $12.50 Breakout Consolidation. It seems as though profit-taking has completed and the stock is moving higher in the pre-market session to solidify the swing trade. We have been watching the stock for the past few days and the Buying Volume has spiked over the course of that time period. In regards to what could push this stock even higher, the company just announcing receiving positive interim results from it's PBCAR0191 Trial as Potential Lymphoma and Leukemia Treatment. The company also has completed preclinical work for another related drug candidate: PBCAR19B, and expects it to enter the clinical trial in 2021.
Tradeanalysis
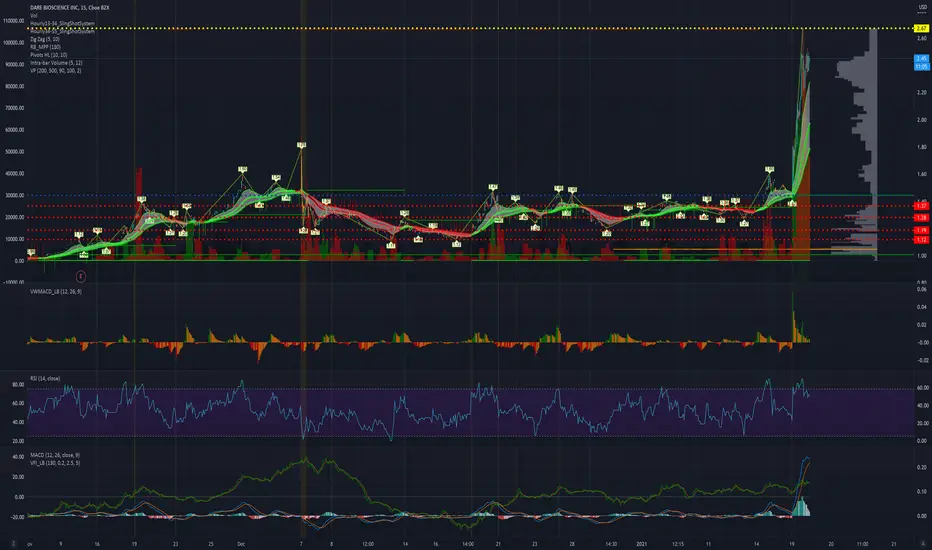
DARE Morning Mover Alert UpdateMORNING MOVER ALERT UPDATE
$DARE - Dare Bioscience, Inc. - Common Stock
Initial Alert Price: $1.2
Price High: $2.68
% Gains/Losses: 123.33%
(+98% More Than Expected)
Potential Stop Loss: $2.546
DARE topped out at $2.68 in today's trading session on pure momentum. No press releases or catalyst to explain the move, but the stock provided a 96.67% Gain from our initial trade alert on the Dec. 18th, 2020. We are watching to stock to determine if this will consolidate heavy or find new support at these levels moving forward.
#Breakout #Stocks #Trading #Investing #Alerts #StockMarket #Daily #News #Today
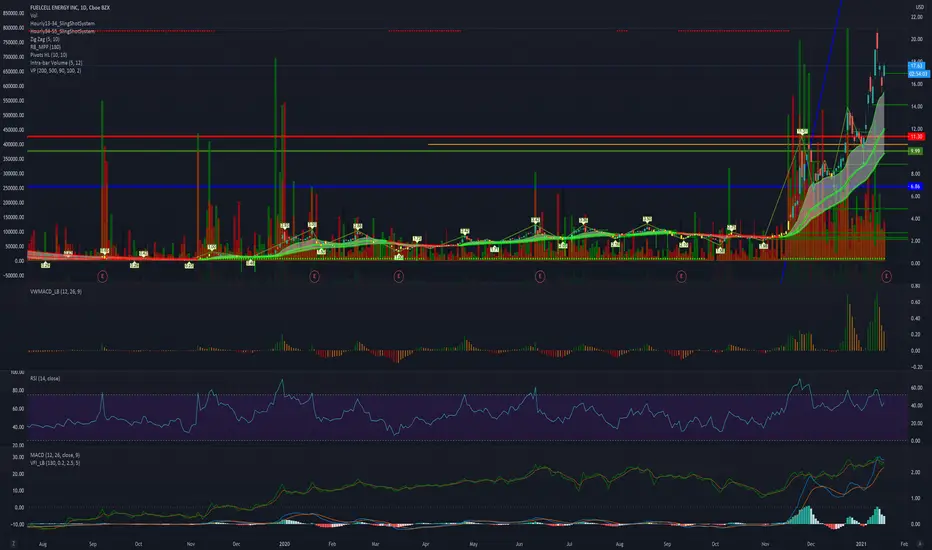
FCEL Breakout Stock Alert UpdateBREAKOUT STOCK ALERT UPDATE
$FCEL - FuelCell Energy, Inc. - Common Stock
Initial Alert Price: $8.51
Price High: $20.94
% Gains/Losses: 146.06%
(+113% More Than Expected)
Potential Stop Loss: $19.893
#Breakout #Stocks #Trading #Investing #Alerts #StockMarket #Daily #News #Today
ACRS Breakout Stock Sell AlertBREAKOUT STOCK SELL ALERT
$ACRS - Aclaris Therapeutics, Inc. - Common Stock
Initial Alert Price: $3.46
Price High: $19.80
% Gains/Losses: 472.25%
(+450% More Than Expected)
ACRS topped out at $19.80 in Today's Trading Session providing a 454% Return on our Initial Trade Alert from Dec. 1st when the stock once only $3.46. This comes after the company announced that its ATI-450 drug candidate demonstrated "durable clinical activity" in a phase 2a trial in patients with moderate to severe rheumatoid arthritis over a 12-week period. We are seeing signals of Profit-Taking/Consolidation from today's run, so we suggest staying on high-alert watching this stock moving forward, as we will be adding it to our watchlist for another potential re-entry after consolidation completes.
#Breakout #Stocks #Trading #Investing #Alerts #StockMarket #Daily #News #Today

GLMD Breakout Stock AlertBREAKOUT STOCK ALERT
$GLMD - Galmed Pharmaceuticals Ltd. - Ordinary Shares
Initial Alert Price: $3.67
Potential Price: $4.32
Potential Gains: 17.71
Stop Loss Limit: $
GLMD is working to retest the $4.32 Levels of Resistance and if it's able to breakthrough and we find support at those price levels, we can expect this to move forward in retesting the $5.15 Price Ranges. The company is currently conducting Phase 3 Trials for their drug Aramchol, which focuses on Non-Alcoholic Steatohepatitis and Liver Fibrosis. The company also has a 2nd Drug in Phase 3 Trials, Amilo-5MER for Chronic Inflammatory Disorders. The company will be hosting a symposium to give an update on the pipeline for the continued development, progress of clinical trials, and manufacturing/distribution moving into the future. #Breakout #Stocks #Trading #Investing #Alerts #StockMarket #Daily #News #Today

USX Breakout Stock AlertBREAKOUT STOCK ALERT
$USX - U.S. Xpress Enterprises, Inc. Class A Common Stock
Initial Alert Price: $7.33
Potential Price: $8.35
Potential Gains: 13.92
Stop Loss Limit: $
Looking USX to retest teh $8.35 Price Levels over the course of teh next few trading sessions going into next week. The stock has found support on the $6.88 Price Levels, consolidated from #Breakout #Stocks #Trading #Investing #Alerts #StockMarket #Daily #News #Today

SFT Breakout Stock AlertBREAKOUT STOCK ALERT
$SFT - Shift Technologies, Inc. - Class A Common Stock
Initial Alert Price: $8.61
Potential Price: $9.79
Potential Gains: 13.7
Stop Loss Limit: $
Looking for a 10-15% Swing Trade on SFT as we wait to see the stock retest the $9.79 Current Levels of Resistance. If the stock is able to breakthrough those current levels of resistance, we could see the stock potentially retest the $11.49 Price Levels for a potential 30-35% ROI on the trade. The company just recently announced an expansion of its service markets in Texas, allowing customers to start selling select vehicles to the Dallas Markets. #Breakout #Stocks #Trading #Investing #Alerts #StockMarket #Daily #News #Today

ASM Penny Stock Alert UpdatePENNY STOCK ALERT UPDATE
$ASM - Avino Silver & Gold Mines Ltd. Common Shares (Canada)
Initial Alert Price: $0.94
Price High: $1.25
% Gains/Losses: 32.98%
(+14% More Than Expected)
Potential Stop Loss: $1.1875
#Breakout #Stocks #Trading #Investing #Alerts #StockMarket #Daily #News #Today

SNDL Penny Stock Alert UpdatePENNY STOCK ALERT UPDATE
$SNDL - Sundial Growers Inc. - Common Shares Status Alert: Deficient
Initial Alert Price: $0.52
Price High: $0.79
% Gains/Losses: 51.92%
(+37% More Than Expected)
Potential Stop Loss: $0.7505
#Breakout #Stocks #Trading #Investing #Alerts #StockMarket #Daily #News #Today

MBIO Breakout Stock Alert UpdateBREAKOUT STOCK ALERT UPDATE
$MBIO - Mustang Bio, Inc. - Common Stock
Initial Alert Price: $3.18
Price High: $4.44
% Gains/Losses: 39.62%
(+15% More Than Expected)
Potential Stop Loss: $4.218
#Breakout #Stocks #Trading #Investing #Alerts #StockMarket #Daily #News #Today

AVEO Breakout Stock Alert UpdateBREAKOUT STOCK ALERT UPDATE
$AVEO - AVEO Pharmaceuticals, Inc. - Common Stock
Initial Alert Price: $5.43
Price High: $8.22
% Gains/Losses: 51.38%
(+37% More Than Expected)
Potential Stop Loss: $7.809
#Breakout #Stocks #Trading #Investing #Alerts #StockMarket #Daily #News #Today

SNCA Penny Stock Alert UpdatePENNY STOCK ALERT UPDATE
$SNCA - Seneca Biopharma, Inc. - Common Stock Status Alert: Deficient
Initial Alert Price: $0.93
Price High: $1.6
% Gains/Losses: 72.04%
(+29% More Than Expected)
Potential Stop Loss: $1.52
#Breakout #Stocks #Trading #Investing #Alerts #StockMarket #Daily #News #Today

ACRS Breakout Stock Alert UpdateBREAKOUT STOCK ALERT UPDATE
$ACRS - Aclaris Therapeutics, Inc. - Common Stock
Initial Alert Price: $3.46
Price High: $6.53
% Gains/Losses: 88.73%
(+67% More Than Expected)
Potential Stop Loss: $6.2035
#Breakout #Stocks #Trading #Investing #Alerts #StockMarket #Daily #News #Today

FCEL Breakout Stock Alert UpdateBREAKOUT STOCK ALERT UPDATE
$FCEL - FuelCell Energy, Inc. - Common Stock
Initial Alert Price: $8.51
Price High: $16.13
% Gains/Losses: 89.54%
(+57% More Than Expected)
Potential Stop Loss: $15.3235
#Breakout #Stocks #Trading #Investing #Alerts #StockMarket #Daily #News #Today

AIKI Penny Stock Alert UpdatePENNY STOCK ALERT UPDATE
$AIKI - AIkido Pharma Inc. - Common Stock Status Alert: Deficient
Initial Alert Price: $0.57
Price High: $1.75
% Gains/Losses: 207.02%
(+167% More Than Expected)
Potential Stop Loss: $1.6625
#Breakout #Stocks #Trading #Investing #Alerts #StockMarket #Daily #News #Today

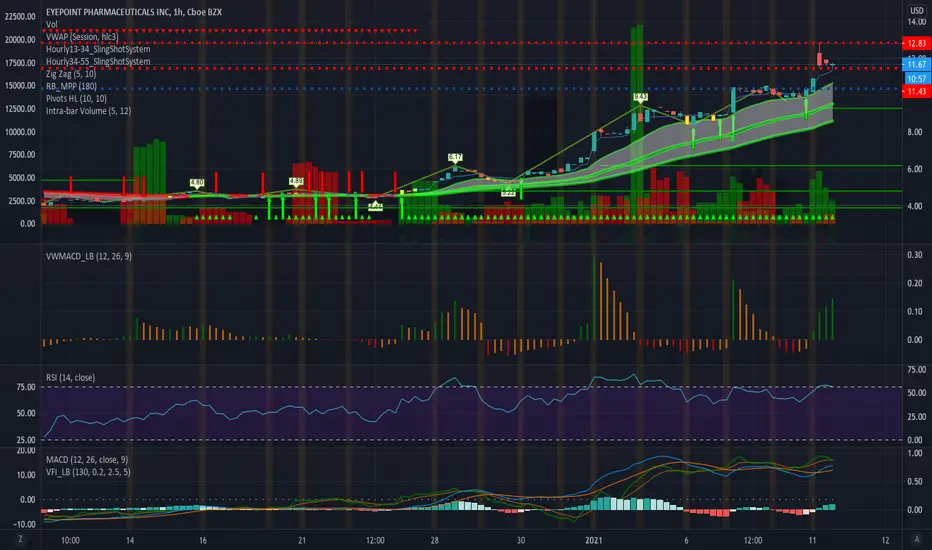
EYPT Breakout Stock Alert UpdateEYPT Breakout Stock Alert Update
BREAKOUT STOCK ALERT UPDATE
$EYPT - EyePoint Pharmaceuticals, Inc. - Common Stock Status Alert: Deficient
Initial Alert Price: $4.78
Price High: $13
% Gains/Losses: 171.97%
(+161% More Than Expected)
Potential Stop Loss: $12.35
#Breakout #Stocks #Trading #Investing #Alerts #StockMarket #Daily #News #Today
UXIN Breakout Stock AlertBREAKOUT STOCK ALERT
$UXIN - Uxin Limited - American Depositary Shares
Initial Alert Price: $1.11
Potential Price: $1.45
Potential Gains: 30.63
Stop Loss Limit: $
Looking for a $1.45 Swing for a nice 25-30% Swing Trade on UXIN after the company announced that Haitaoche Limited has entered, through one of its subsidiaries, into a five-year vehicles supply contract with China National Vehicles Imp & Exp Co., Ltd. on January 11, 2021. #Breakout #Stocks #Trading #Investing #Alerts #StockMarket #Daily #News #Today

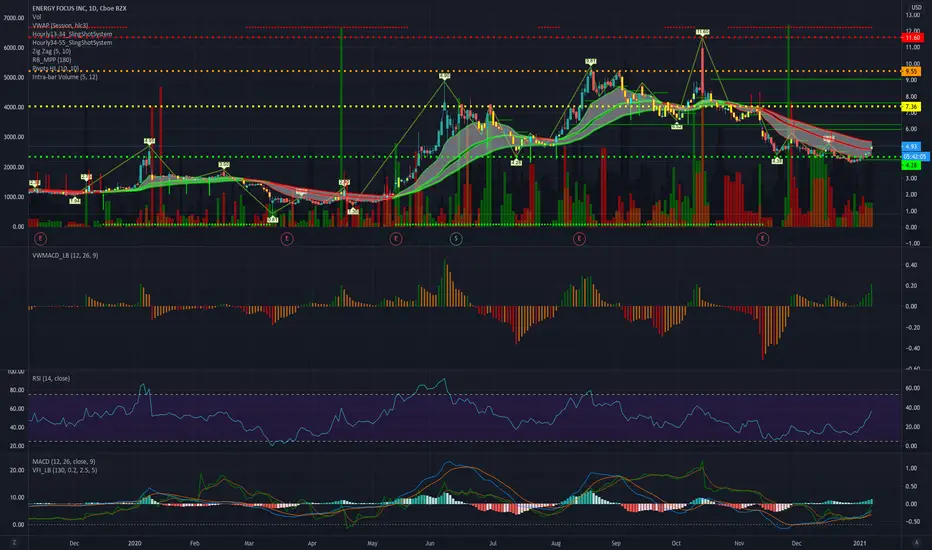
EFOI Breakout Stock AlertBREAKOUT STOCK ALERT
$EFOI - Energy Focus, Inc. - Common Stock Status Alert: Deficient
Initial Alert Price: $4.88
Potential Price: $7.36
Potential Gains: 5082%
Stop Loss Limit: $4.64
Looking for a $7.36 Swing and Retest of those Resistance Levels with EFOI. The stock has confirmed the completion of consolidation from it's most recent breakout to the $11.60 Price Levels on Oct. 13th, after the company announced that it was launching its Advanced UV-C Disinfection Product Portfolio Offering for Airborne and Surface Disinfection Solutions for commercial and Residential Indoor Environments. If the stock does complete the Resistance Level Retest, breakthrough those levels and finds support above $7.60, the next level of resistance sits around the $8.90-$9.55 Price Ranges. #Breakout #Stocks #Trading #Investing #Alerts #StockMarket #Daily #News #Today
CMG - 13.50% Potential Profit - Ascending TriangleAscending triangle formed after a 9-month monster rally followed by a correction period. Price seems to have graduated from its uncertainty and ready to keep that rally going.
Support held strong in the past two weeks and I feel that the risk/reward ratio is excellent on this trade. Positive vaccine news could act as a catalyst.
- Target Entry $1406.15
- Target Stop Loss $1384.94
- Target Exit $1598.50
About me
- P/L: Oct-Nov-Dec Trading Suspended | September +49.18% | August: +232.32% | No Trades without Analysis
- Note that I tend to adjust stop losses in order to secure profits early and preserve capital. This means that the target price is going to be achieved as long as there are no strong pullbacks that trigger my new adjusted stop loss

NZDCAD H4 - Long Trade SetupNZDCAD H4 - Popped higher, rejected supply initially at 0.92100, may just be a natural correction before a potential further shift upside. Another one to monitor and follow.


BTCUSD TREND FACTORS EXPLAINED. The value of the bitcoin has been rising over the past few weeks, reaching a record high of 20000, in December last year. The value of the bitcoin has multiplied in the past as well, due to large investors investing in it for immediate profit. Some experts believe that in the aftermath of the Coronavirus outbreak around the world, investors consider the bitcoin to be safe for their assets. But experts believe that the value of this bitcoin will continue to fluctuate and its value may increase with the further depreciation of the dollar.

EUR/GBP Pull back and push up!Here we can see the Euro chart falling directly in line with the analysis we have provided over the last few weeks. With continued pound weakness surely on the horizon our prediction will be "move A" a pull back and test of the trend line, followed by an upside turn 'move B" pushing the pair higher. Good Luck.
