Tradeanalysis


BTC bearish divergence. Short term bearHey,
This is quiet a simple analysis.
As we know, we are expecting a daily tightening range (equilibrium) for BTC on the daily timeframe which means a lower high under the 11,150 zone.
Now zooming into the 1hr chart as we get close to the resistance zone, it is apparent we have a hidden bearish divergence, as you can see by the lower high formation on the RSI.
Furthermore, we are seeing the divergence trend line steepen upon the RSI San price action is becoming more horizontal and less vertical showing that the short term trend reversal is now favorable.
Day trading bears have an excellent opportunity here and can short with a SL at 11,200.

gbpchf2 variations that price can take to move to the red resistance
either as shown in pic or in a descending channel torwads restistance
short term sell
overrall view buy

NZD Short 1H Multiple Areas of ConfluenceLook for price to fall into recent areas of structure. At these levels, price will either pause and continue lower, or reverse and continue reaching new highs. Look for entry signals at each of these points and set take-profits in reasonable locations.

Aurora Skies :) Mini Price Bump? Long term perspective VALUE BUYHowdy TradingView Family!
Hope you guys are doing well and having a great day. ACB and the majority of the weed stocks are being hit..and hit hard! However after seeing 100-200% gainers on most stocks its not surprising to see a 50% retracement. If any of us who have traded or invested in crypto in the past this is nothing, but all too familiar.
Let's move forward with how we should approach Aurora.
Stock Dilution? Issue? YES! Does it hinder growth? Nope! It's an issue, but they are not the type of group to pay for companies that wouldn't pay out in the future!
Partnerships? YES! Small deals with UFC & Pax Labs ($1.6B Vape Pen Manufacturer)
Leadership? Great leadership. Been in the stock since 2014. It hit every milestone. No bullshit. Actions louder than words.
Nelson Peltz? Why would a famed Billionaire put his reputation on the line in a proposed "high risk Highly speculative" industry? Because...MJ Sells. The black market always existed before. Narcos Anyone? Its legalized in Canada, 11 states in the USA, its a matter of time until its legal in the USA and its going to be a full fledge bull run..
Social norm of MJ is drastically changing. Ask anyone in the USA age 30 or below if they ever smoked? 80% Of people is yes . Canibus and CBD/THC are entering mainstream markets. Even the dam Kheils has CBD infused facial oil. It does help with pain and stress relief. WAY LESS SIDE EFFECTS THAN MAINSTREAM PERSCRIPTION DRUGS. Also...uhh natural? If God made this beautiful green earth.. its much better then a strong pharma drug made in a lab where the wrong doseage kills ya!
Don't be the loser that said I would have, should have, could have. Heard it 1000000x and said it 10000000000000000000000x more myself. Get some big balls. Invest and hold for the swings. #BTC is swinging for the fences..but it was dead quite when it was trending $3000-4000. No one is ever there for the shitty days but everyone wants to ride the wave up. Well we are in the shitty days of MJ, but let me tell you... I'm 90% invested with my capital and 10% cash to pay for my daily expenses.
I'm in the market to achieve financial freedom. I know you guys are too if not you wouldn't be looking at my dam chart. So HOP on this GRAVY BOAT and let's make some money. I've made some people pretty rich. (i'm still a long way off) Come join and make some free $$$$.
Anti-Fomo Zone: Buy now around market ± a few pennies. You can lose a couple %'s, but if it breaks out you are in it baby! 10-20%
Buy Zone #1: 30-40% of buys positioned here. I'm more aggressive than others. This is if the chart breaks on the 4hr and I can see a small down on the Daily.
Buy Zone #2: Bottom of market? i have a 95% chance of saying yes. Only thing that can destroy the bottom of $6.27 is HORRIBLE HORRIBLE NEWS. ACB fucks up. Or Govenment does a 180 degree.
LONG TERM VALUATION:
STEP ONE: EASY $9.50
STEP TWO: $10-12 (6 months to 1 year out)
STEP THREE: Hold for 1+ Years. There will be ups and downs. Easily seeing this as a $20+ stock. ACB will need to do a stock repurchase or a reverse split to reduce the shares outstanding.

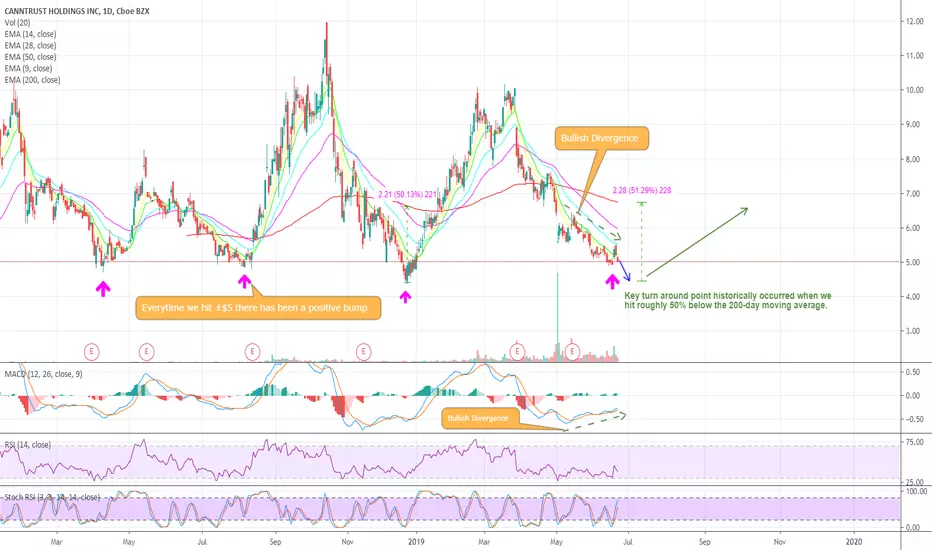
CTST Great PROFIT Opportunity - Buy when others are Running!I have been invested in ACB since early 2014-2015. The stock was highly speculative at the time with 0 confirmation of Canada fully legalizing marijuana. Fast forward to 2019...at its highest point I was up 1200%. Crazy results for any day in the market...albeit if you come from crypto...well we all know that story.
As usual, you boy chases high-risk high reward type investments. POT Stocks have generated some of my biggest earnings for 2019. The market is being trashed with uncertainty in 2019 reaching both highs and lows. I would approach the remainder of 2019 to Q1-Q2 of 2020 as the transitionary phase for POT stocks as more institutional investors get involved, partnerships continue to form, and more consumer grade products (drinks, edibles, oils, etc) hit the market. Expect some bumps in prices, but its an important time for all of us to set our mindsets straight for the coming months.
Questions to ask your self:
1) What is your game plan? Long term holder? Short term? Swing?
2) Set your sell targets and stick with them
3) Do you believe in this company and its industry? If you don't...move along there are other stocks to invest in
4) If you do...I never daytrade companies I don't believe in the long term. This allows me to cut my losses when I need to..but if I need to HODL i have pure confidence it will do great long term if I just walked away for a couple of months.
Believe in yourself. Study up and you will do great!
MY TRADE SET UP:
Set Buys from $5 down to $4.75.
Hold for a swing trade or sell at your set % targets. I am personally tiering my sells from $6.5, $7.50, and long term of +$10 (1 year out).
Personally, I am a bullish long for the POT Market as a whole and CANNTRUST has enough girth to compete with the big bois with a $700M Valuation!!!!! ACB has a $7.1B Market Cap...$13B for Canopy Growth. I can easily see CTST double/triple in valuation with the recent news of partnerships. 3,000 acres to grow hemp and cannabinoids in Bakersfield, CA.
My full-time career in Industrial Real Estate has given me a lot of insight and insider info to F500 companies, institutional investors, & real estate development. POT STOCKS is the next big thing. There is a huge demand for land and warehouses for grow facilities. IIPR went 400% in 5 months and they are a REIT that focuses on MJ industrial properties. I currently represent several large Billion dollar REITs and just completed my 1st industrial development deal at the age of 26. MJ growers and companies are easily paying 3x above market value rent.
CTST being able to land lease 3,000 SF to grow is a BIG DEAL. especially in CA. Looking forward to this company blowing up over the next year :) Hope you join me for the ride!
Good luck & Happy Hunting!
Reg
Will General Electric Run for Another 8 Years? Check it out! I couldn't ignore this chart when I looked at it. I noticed it instantly! 10 years later GE has returned back to the $10 range back from 2009.
GE did a 8 year run all the way to 2017 before falling off heavy for 2 years straight. I did another 8 year projection back to the same level it reached in 2017. I believe it will take this pair less than 8 years to reach back to the same level.
If this stock does take 8 years to recover than we should be looking around 2027 to reach the $30 per share range.
All in all I believe this is a very solid stock to invest in.
(Please comment and give your honest opinion.... Thank you)

DCR DecredBTC IS Ready For Breakout Above Aprils High 50% PPBINANCE:DCRBTC Is showing strong momentum and Increased
RSI
Buying Volume
DCR is ready to breakout with 50% Profit Potential from Now the green candle pattern has already formed and we already have broken April's low now its time to watch the show for Bull run.
About the Chart
I have highlighted 3 Targets using 3 different color of lines and giving 2 of them names like A and B whilst i have also highlighted the possible drop-zone in case of not being able to find desired support .The resistance is marked with black 2 faced arrow.
we still need some more volume to hit 5700
I hope you liked this chart.
i will keep you guys updated .
Never forget to use stop loss.
Sometimes you earn the other times you learn.
Never put all your Money in one bag .
happy trading

EURUSD SMART TRADE The price bounces from 1.12000 support level . RSI confirms the price reversal and MACD histogram supports the further upward movement. DMI is still bearish but ADX line falls. It tells us that sellers are not so strong for pushing the market lower.

AUD/NZD trend is ending, time for bullish!Trade Journal:
Analysis:
1. Trend is to the end ( Elliot wave )
2. 2H showing weak strength of bearish.
3. Weekly Sup is holding tight.
4. Looks like morning star is about to be formed.


AUDCHF TO THE .69000 ????We see a head and shoulder formation has taken place over the past weeks and we see a long opportunity forming before the sell

SPY...Consolidation for now...Let's hope for a $290! Great New SPY is consolidating along the 1 FIB line. Minor correction is holding around the $280-278 range. We need to see this hold if we want to maintain an ongoing rally for stocks. If we do gun for $290 which was the previous ATH I predict the broader market will drop like a rock shortly after.
Sigh...its been a nice 3-month bull run :P Fingers crossed. Set tight stop losses on all your trades.
I'm expecting some GREEN tomorrow (3/21). Lets hope this pans out for my EA day trade.
Happy Hunting
Reg <3


GBP/CAD -- Institutional Money is SHORTGBP/CAD -- heavy manipulation to the upside, wiping out many traders at 1.76400 and 1.77380!
Patience and timing were key to avoid heavy losses.
Our team were in at 1.75837 but with stops carefully placed at key levels which kept our position in the market while other traders faced heavy losses.
Target 1 +160 points.
Target 2 +320 points.
Target 3 +480 points.
Stop loss at 250 points.
More posts to follow on why we trade with multiple targets.

GBP/CAD -- Institutional Money is SHORTGBP/CAD (more on our IG page - TWTI.trading)
Heavy manipulation to the upside, wiping out many traders at 1.76400 and 1.77380!
Patience and Timing were key to avoid heavy losses.
Our team were in at 1.75837 but with stops carefully placed at key levels which kept our position in the market while other traders faced heavy losses.
Target 1 +160 points
Target 2 +320
Target 3 +480.
Stop Loss -250
Great risk to reward ratio and more posts to follow on why we trade with multiple targets


EU to the 1.11412 ????????????EU has been in a ranging downtrend price action shows its currently approaching a key resistance level, will be looking for a touch to the 1.3600 level and then after should be a good entry for a nice short in for 230 pips


