Eurnzd AnalysisI am waiting for price to confirm to my setup as i envision a bearish move all the way down. My entry will be after the break of the support level. At the moment i will still be observing price movement while waiting for the perfect entry.
Tradeanalysis

EURUSD BUY | Idea Trading AnalysisEURUSD is moving under the descending channel
The chart is above the support level, which has already become a reversal point twice.
We expect a decline in the channel after testing the current level.
We expect a decline in the channel after testing the current level which suggests that the price will continue to rise
Hello Traders, here is the full analysis.
I think we can soon see more fall from this range! GOOD LUCK! Great BUY opportunity EURUSD
I still did my best and this is the most likely count for me at the moment.
-------------------
Traders, if you liked this idea or if you have your own opinion about it, write in the comments. I will be glad ⚜️

AUDJPY → Trade Analysis | SELL SetupI have two options here.. bullish continuation from here or bearish break.. Potential BEARISH move!
Hello Traders, here is the full analysis.
I think we can soon see more fall from this range! GOOD LUCK! Great SELL opportunity AUDJPY
I still did my best and this is the most likely count for me at the moment.
Support the idea with like and follow my profile TO SEE MORE.
Traders, if you liked this idea or if you have your own opinion about it, write in the comments. I will be glad 🤝
Patience is the If You Have Any Question, Feel Free To Ask 🤗

AUDUSD BUY | Idea Trading AnalysisAUDUSD is moving in an UPtrend channel.
The chart broke through the dynamic Resistance line, which now acts as support.
We expect a decline in the channel after testing the current level which suggests that the price will continue to rise
Hello Traders, here is the full analysis.
I think we can soon see more fall from this range! GOOD LUCK! Great BUY opportunity EURUSD
I still did my best and this is the most likely count for me at the moment.
-------------------
Traders, if you liked this idea or if you have your own opinion about it, write in the comments. I will be glad

GBPUSD SELL | Idea Trading AnalysisGBPUSD is moving in a descending channel near the upper boundary.
The volatility of the price movement decreased when approaching the channel boundary.
Hello Traders, here is the full analysis.
I think we can soon see more fall from this range! GOOD LUCK! Great SELL opportunity USDJPY
I still did my best and this is the most likely count for me at the moment.
-------------------
Traders, if you liked this idea or if you have your own opinion about it, write in the comments. I will be glad 🤝

A Winning Trade ExplainedIn the video I explain my approach to the market and how I use 'trade sizing' to manage my risk in the initial part of the US session.
I walk through the price action for the NASDAQ and why I traded short and then flipped long. I explain the concept of sizing with regards to trade management and then how I 'SIZE UP' when I have conviction to end with a profitable session.
** If you like the content then take a look at the profile to get more ideas and learning material **
** Any Comments and likes are greatly appreciated **

Noon premium Trading idea $$$ Lets go !Gold has been bullish against the US dollar in recent day trading sessions, driven by geopolitical tensions, economic uncertainty, and a weakening dollar. Technical indicators support further upside potential, with traders likely to continue buying into gold as a safe haven asset. The outlook for gold in day trading remains positive, with potential for continued gains in the near term. Traders should monitor key support and resistance levels and stay informed on market developments.
Entry: 2336.76
SL: 2328.70
Target 1: 2345.49
Like, comment, hit the follow button for more
Trade God out
#daytrading #tradeanalysis #signals #gold #xauusd #follow

GBPAUD → Trade Analysis | SELL SetupHello Traders, here is the full analysis.
I think we can soon see more fall from this range! GOOD LUCK! Great SELL opportunity GBPAUD
I still did my best and this is the most likely count for me at the moment.
Support the idea with like and follow my profile TO SEE MORE.
Traders, if you liked this idea or if you have your own opinion about it, write in the comments. I will be glad 🤝
Patience is the If You Have Any Question, Feel Free To Ask 🤗
Just follow chart with idea and analysis and when you are ready come in THE GROVE | VIP GROUP, earn more and safe, wait for the signal at the right moment and make money with us💰

USDCAD → Day Analysis | BUY SetupHello Traders, here is the full analysis.
Price reversal going up, levels for BUY . USDCAD long
! Great BUY opportunity USDCAD
I still did my best and this is the most likely count for me at the moment.
Support the idea with like and follow my profile TO SEE MORE.
Traders, if you liked this idea or if you have your own opinion about it, write in the comments. I will be glad 🤝
Patience is the If You Have Any Question, Feel Free To Ask 🤗
Just follow chart with idea and analysis and when you are ready come in THE GROVE | VIP GROUP, earn more and safe, wait for the signal at the right moment and make money with us💰

Beyond the Horizon: Finally unleashing the Silver Revolution!Silver OANDA:XAGUSD
Let's take a closer look at Silver , a precious metal known for its notable volatility compared to Gold. Initiating our count post the COVID fall, a swift Wave (1) movement unfolded, followed by an extensive Wave (2) correction featuring a Flat pattern and subsequently a Zigzag for Wave (2). The completion of Wave (2) occurred around $17.55, with the high of Wave (1) standing at $29.86.
Subsequently, a somewhat peculiar Wave 1 emerged, set to conclude soon with a Wave 2. Zooming in from the daily to the 2-hour chart, after our minor Wave 1, we encounter a complex correction structure. This is anticipated to be an overarching Flat correction with Waves ((a)), ((b)), and ((c)). Notably, during Wave B, nearing $25.9, we approached nearly 100% of the Wave 1 level.
Now, we are poised to observe the downward correction for the completion of Wave 2. As Wave ((a)) is formed by a Triangle, ((b)) is nearly exact the 100% level of wave 1, it's plausible that Wave ((c)) could similarly reach around 100% of level ((a)).
Hence, projecting a retracement between 61.8% and 78.6%, we expect support between $20.75 and $19. This is the range where a potential rebound is anticipated.

NZDJPY Channel - Are we going Long soon?Hi everyone,
Technical Trader here.
Awaiting confirmation on the Daily and (maybe Weekly) to see whether we can fill the Monthly candle stick wick. Price approached the yearly mark (Jan 2014) and was rejected.
Clear Channel, but could it break?
I've not got a bias on this one just yet, but I will be watching over the next few days.

SPG - Trade analysis & Multi-time frame confluenceThis video is more of a tutorial on why I took a short trade on SPG today. We fell out of our strong buying continuation channels with a rejection of HTF tapered channels and selling channels. Confirmation was the support from our more tapered buying algo and rejected of the bottom of our stronger buying algo (in addition to it lining up with our strong magenta selling channel)
Happy Trading :)

Live Trading Session 255: Potential & open positions on GBP,etcIn this live trading session video,we look at current live open positions on BRENT, GBPUSD,
EUR and potential trades coming on Bitcoin,Etherum,US30, etc and the thinking behind them. We also look at how we are doing on our live 100k traders challenge account.

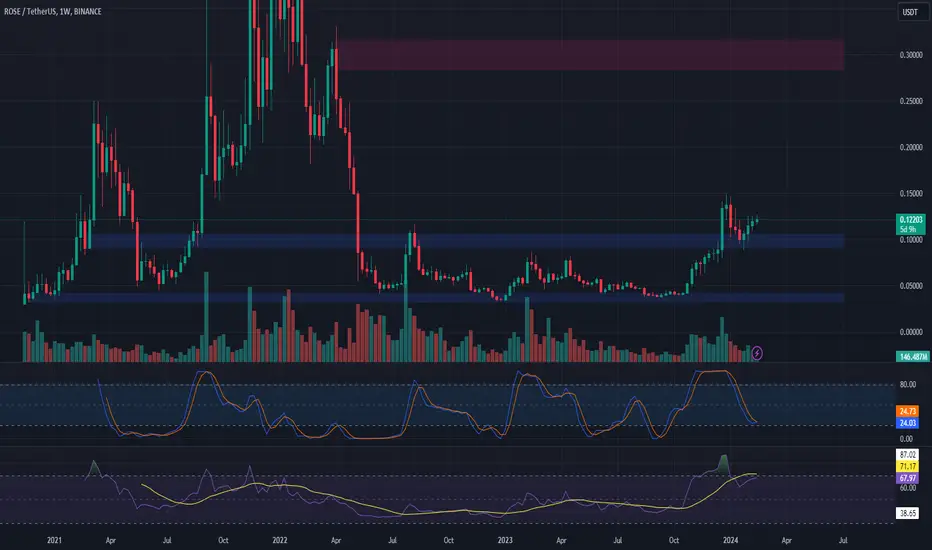
⚙️ ROSE - Bullish Signs with Support Rebound! 🚀
⚙️📈 ROSE (Oasis Network) Trade Analysis - Bullish Signs with Support Rebound! 💹🚀
📊 Technical Overview:
ROSE (Oasis Network): Showing bullish signs, rebounding from support at $0.105.
Bullish Crossover: Stochastic RSI printing a bullish crossover.
Next Resistance: $0.284 (Potential 136% move).
Key Level: Needs to stay above $0.121 for a clean upward trajectory.
📈 Trade Strategy:
Entry: After confirmation of bullish signs, considering the rebound.
Target: $0.284.
Key Level: Watch for price action to stay clearly above $0.121.
🚨 Note: Monitor market conditions, Bitcoin movements, and overall crypto sentiment for potential impact on ROSE. Trade cautiously! 🔄🚀 #ROSE #TradeAnalysis #Cryptocurrency 📊💹
GBPAUD SELL | Day Trading AnalysisHello Traders, here is the full analysis.
Watch strong action at the current levels for SELL . GOOD LUCK! Great SELL opportunity GBPAUD
I still did my best and this is the most likely count for me at the moment.
Support the idea with like and follow my profile TO SEE MORE.
Traders, if you liked this idea or if you have your own opinion about it, write in the comments. I will be glad 🤝
Patience is the If You Have Any Question, Feel Free To Ask 🤗
Just follow chart with idea and analysis and when you are ready come in THE GROVE | VIP GROUP, earn more and safe, wait for the signal at the right moment and make money with us💰

AUDUSD M30 / SHORT TRADE OPPORTUNITY 📉Hello Traders!
This is my idea related to AUDUSD M30. I expect a bearish move after the retracement from the Resistance level, the exact level where we have also fibo 50%.
My target is below the BOSS.
Traders, if you liked my idea or if you have a different vision related to this trade, write in the comments. I will be glad to see your perspective.
____________________________________
Follow, like, and comment to see my content:
www.tradingview.com

USDCAD BUY | Day Trading AnalysisHello Traders, here is the full analysis.
Watch strong action at the current levels for BUY. GOOD LUCK! Great BUY opportunity USDCAD
I still did my best and this is the most likely count for me at the moment.
Support the idea with like and follow my profile TO SEE MORE.
Traders, if you liked this idea or if you have your own opinion about it, write in the comments. I will be glad 🤝
Patience is the If You Have Any Question, Feel Free To Ask 🤗
Just follow chart with idea and analysis and when you are ready come in THE GROVE | VIP GROUP, earn more and safe, wait for the signal at the right moment and make money with us💰

SEMS XAUUSD ANALYSISAs Stated Earlier for the Consolidation zone, Gold is trading under same consolidation zone. Today on economic calendar, many data are listed due which we can see a breakout from this consolidation zone, where we will stick to our stated trading ranges, and we will trade according to same pattern of low moderate and high-risk trading.
RM will be followed.

WTI / OIL H4 Possible LONG Trade. 📈 ✅Hello Traders!
This is my view related to WTI / OIL H4. As you can see, OIL is in a very interesting phase, It took liquidity, set a new daily high, react from the OB (D1), and I expect a bullish movement until the level of 78.000.
Traders, if you liked my idea or if you have a different vision related to this trade, write in the comments. I will be glad to see your perspective.
______________________________________________________________________________
Follow, like, and comment to see my content:
www.tradingview.com

Momentum, Growth and Innovation: NVDAWe have just added a new position (NVDA) to our 'Growth, Momentum and Innovation' portfolio with 11% of total equity.
Here is the link to our updated portfolio, which is up > 20% in the last month:
www.tradingview.com
Here is a more detailed analysis of this trade:
Technical Analysis
Trend: NVDA has been in a general uptrend, as indicated by the price being above the major moving averages (50-day, 100-day, 200-day), which are also sloping upwards.
Moving Averages: The stock is currently trading above its short-term moving average (50-day) but there appears to be a slight pullback, which could be seen as a buying opportunity in an uptrend, as per Minervini's trend following strategies.
Volume: There's been increased trading volume on up days, suggesting strong buying interest. According to Minervini, higher volume accompanying price advances is a positive sign.
Relative Strength Index (RSI): The RSI is not in an overbought territory (below 70), which could indicate that there is still room for upside before the stock becomes overextended.
Moving Average Convergence Divergence (MACD): The MACD line is above the signal line but starting to converge, indicating potential for a change in momentum. However, as long as the MACD remains above the signal line, it is typically considered bullish.
Support/Resistance: The stock has recently bounced off a support level and is making its way towards a potential resistance area. The pullback to the support could be part of a "high tight flag" pattern, which Minervini finds favorable.
Price Action: The recent price action has formed what appears to be a consolidation pattern after a strong uptrend, which may be indicative of a pause before a continuation of the trend.
Background Analysis
Market Conditions: Mark Minervini advocates trading in sync with the overall market. If the market indices are in a confirmed uptrend, individual stock trades like NVDA are more likely to succeed.
Earnings and Fundamentals: NVDA is known for its strong market position in graphics processing units (GPUs) and its expansion into areas like artificial intelligence, autonomous driving, and data centers.
Sector Performance: NVDA is part of the technology sector, and its performance is often tied to the tech industry's overall health. A bullish sentiment in the tech sector can contribute to individual stock success.
Risk Management: Following Minervini's risk management rules, it's essential to have a predetermined stop loss to protect capital. The trade should also be sized appropriately, not risking more than a small percentage of the trading capital on any single trade.
Entry Point: According to Minervini's strategy, this entry is considered a pullback entry which further reduces the risk of this trade.

Untangling the Web of Confirmation Bias in Trading 🕵️♂️🔄💭
Confirmation bias is a common psychological phenomenon that can significantly impact trading decisions. This article delves into the depths of confirmation bias in trading, unraveling its influence, implications, and strategies to mitigate its effects.
Understanding Confirmation Bias
Confirmation bias occurs when traders favor information that confirms their existing beliefs or biases, ignoring contradictory data, thereby influencing their decision-making process.
Selective Perception:
Disregarding Contrary Signals:
Mitigating Confirmation Bias
Strategies to counter confirmation bias include maintaining an open mind, seeking diverse sources of information, and critically evaluating one's analysis.
Understanding and addressing confirmation bias is crucial for traders to make informed decisions, fostering a more objective and balanced approach to trading. This article sheds light on this psychological hurdle and offers strategies for a more discerning trading mindset. 🕵️♂️🔄💭
Please, like this post and subscribe to our tradingview page!👍

BluetonaFX - Bullish Outlook for GBUSDHi Traders!
GBPUSD continues to trade with bullish momentum and looks to be targeting the previous strong support level from August at 1.26148, which is now resistance.
Price Action 📊
After breaking above the descending price channel, the market is now in an ascending price channel, and the price action looks completely bullish with higher market swings and trading well above the 20 EMA.
Fundamental Analysis 📰
Bank of England Governor Andrew Bailey warned earlier this week that the central bank may have to raise interest rates again and that the general cost of living remains an upside risk to the inflation outlook. The Flash Manufacturing and Flash Services PMI came out better than expected; therefore, this does relieve some pressure on the inflation outlook for the GBP.
Support 📉
1.24492: PREVIOUS DAY'S LOW
Resistance 📈
1.26146: AUGUST 2023'S MAJOR SUPPORT
Risk ⚠️
No more than 2% of your capital.
Reward 💰
At least 4% of your capital.
Please make sure to click on the like/boost button 🚀 as your support greatly helps.
Trade safely and responsibly.
BluetonaFX

GOOG: Technical Trade AnalysisOur portfolio is up by 17% over the last month 🍾🍾. Here is the link:
www.tradingview.com
Here is the latest analysis of our GOOG trade:
Analyzing the provided chart for Alphabet Inc. (Google) Class C on NASDAQ (GOOG), we can consider several key aspects to determine potential exit strategies in line with Mark Minervini's swing trading approach:
Moving Averages: The stock is currently trading above the 50-day moving average (MA), which often acts as support in an uptrend. As long as the stock remains above this moving average, it could be considered to be in a healthy uptrend.
Volume: There is no visible volume spike on the entry day; however, subsequent days show average to above-average trading volume, which is generally positive for a continued uptrend.
Bollinger Bands: The price is approaching the upper Bollinger Band, which could be an area of potential resistance. Some traders might consider taking profits as the price touches or breaches this upper band, especially if it coincides with other signs of overextension.
Relative Strength Index (RSI): The RSI is approaching overbought territory but is not yet above the 70 level, which might suggest caution but not necessarily an immediate exit.
MACD (Moving Average Convergence Divergence): The MACD line is above the signal line and above the zero line, which is bullish. There is no immediate sign of a bearish crossover, which would be a potential exit signal.
IBD RS (Investor's Business Daily Relative Strength): The IBD RS line is trending upwards, indicating the stock is performing well relative to the market.
Considering Minervini's strategy, which typically involves selling on strength rather than weakness, potential exit points could be:
Break of Trendline: If the stock breaks below the short-term moving average or a trendline support, it could be an indication to exit, especially if the volume increases on the downside.
Technical Weakness: Any bearish reversal patterns, such as a bearish engulfing candle or a high-volume decline through the 50-day MA, could signal an exit point.
Profit Target: If the stock reaches a predetermined profit target, such as a percentage above the buy point or a previous high, it might be a good time to take profits.
Time Stop: If the stock hasn't met the expected price target within a specific time frame, it might be prudent to exit the position to avoid opportunity costs.
Given these considerations, it's also important to have a pre-determined trailing stop-loss to protect profits. If none of the exit criteria have been met but the stock continues to make higher highs and higher lows, maintaining the position with a trailing stop-loss could be a suitable strategy, adjusting the stop-loss upwards as the stock appreciates. Remember to continuously monitor the position and market conditions, as things can change rapidly.
