TradeCityPro | Bitcoin Daily Analysis #116👋 Welcome to TradeCity Pro!
Let’s dive into the analysis of Bitcoin and the key crypto indices. As usual, I’m going to review the futures triggers for the New York session.
✅ Yesterday, a very important event occurred: Israel launched a military attack on Iran, targeting not only military facilities but also residential areas.
⚔️ Leaving aside the fact that war is always a global tragedy, the fact that Israel also hit civilian zones shows that the tensions between these two countries have entered a new phase.
💫 In addition to civilian casualties, key commanders of the Iranian military were assassinated in these strikes.
🏳️ Most countries such as the United States, France, and most of Europe supported Israel in this conflict, while only North Korea and Russia backed Iran.
📊 Given these rising tensions and the cancellation of Sunday’s negotiations between Iran and the U.S., the likelihood of war between Iran and Israel has greatly increased following the resolution signed yesterday.
⭐ This development has caused safe-haven assets like gold to move upward, while risk-on assets like crypto have started to decline. As you can see, Bitcoin has been falling since yesterday.
⏳ 1-Hour Timeframe
On the 1-hour chart, as mentioned, after an initial correction to the 108436 zone, Bitcoin continued its decline down to 103606, breaking through the support level we had marked due to the war-related news.
✨ Currently, the price has found support at 103606 and has started a corrective phase. RSI has also exited the Oversold area and is now heading toward the 50 zone.
📉 In my opinion, under the current market conditions, we should wait to see how Iran reacts to Israel's actions. If war breaks out, Bitcoin is likely to drop again.
⚡️ Personally, I’m holding off on opening any positions until we get more clarity on the fundamental developments between Iran and Israel. I'm also not closing any of my longer-term positions that were opened in lower zones like 88k.
🔔 However, if you are looking to open a position, you could enter on a break below 103606. I don’t currently have a trigger for a long position and would prefer to wait for a proper structure to develop.
👑 BTC.D Analysis
Bitcoin dominance moved upward along with the market decline and, after breaking through 64.18, continued its bullish leg up to 64.85.
🧩 It has since begun a corrective phase after hitting that resistance. If this correction continues, the next zone to watch is 64.49.
📅 Total2 Analysis
This index also dropped alongside Bitcoin yesterday, falling from 1.18 down to 1.12 after triggering a short.
🔍 The price has since corrected up to 1.14. If a new bearish leg begins, we can open a short position on a break below 1.12.
📅 USDT.D Analysis
Tether dominance moved upward after triggering 4.68 and reached 4.89.
💥 If 4.79 is broken, the correction could continue. If 4.89 is broken, the next bullish leg in dominance will begin.
❌ Disclaimer ❌
Trading futures is highly risky and dangerous. If you're not an expert, these triggers may not be suitable for you. You should first learn risk and capital management. You can also use the educational content from this channel.
Finally, these triggers reflect my personal opinions on price action, and the market may move completely against this analysis. So, do your own research before opening any position.
Tradecitypro

TradeCityPro | Bitcoin Daily Analysis #115👋 Welcome to TradeCity Pro!
Let’s dive into the analysis of Bitcoin and the key crypto indices. As usual, I’ll be reviewing the futures triggers for the New York session.
⏳ 1-Hour Timeframe
On the 1-hour chart, as you can see, yesterday the price was rejected from the 110256 level I previously mentioned. Following that, with the activation of the 108617 trigger, Bitcoin experienced a downward leg.
📊 Personally, I didn’t open a short position after the break of that level, but if you did, I suggest taking profits now as the price has reached the marked support zone.
🔍 As for me, I’ll wait to see how the price reacts to this support. If it breaks down, we can open a short position.
📈 However, if the price finds support here, we can once again look for a long position. The trigger for this will be found in the lower timeframes.
👑 BTC.D Analysis
Let’s move to Bitcoin dominance. Yesterday, BTC.D made a pullback to the 64.18 zone and now seems ready for another drop.
✔️ If 63.96 breaks, BTC.D could enter another bearish leg. If instead, the 64.18 ceiling breaks, it could push up toward 64.49 or even 64.67.
📅 Total2 Analysis
Looking at the Total2 index, after reaching 1.24 yesterday, it started to correct and dropped down to 1.18, touching the support with a shadow.
✨ If the 1.2 level breaks to the upside, the price could move back toward 1.24. If 1.18 breaks down, the correction may continue further.
📅 USDT.D Analysis
Now onto USDT.D. After a brief correction up to the 4.68 level, it has resumed its downward movement. If 4.64 breaks, the decline could extend toward 4.56.
💥 If instead, the 4.68 top breaks, it might bounce back up toward 4.72.
❌ Disclaimer ❌
Trading futures is highly risky and dangerous. If you're not an expert, these triggers may not be suitable for you. You should first learn risk and capital management. You can also use the educational content from this channel.
Finally, these triggers reflect my personal opinions on price action, and the market may move completely against this analysis. So, do your own research before opening any position.

TradeCityPro | TON: Eyes Breakout from Daily Range Top👋 Welcome to TradeCity Pro!
In this analysis, I’m going to review the coin TON for you. The TON project is developed for Telegram and operates on a Layer One blockchain, enjoying significant popularity within the Telegram community.
✔️ The coin currently has a market cap of 7.95 billion dollars and ranks 18th on CoinMarketCap.
📅 Daily Timeframe
On the daily chart, as you can see, there’s a range box formed between the levels of 2.851 and 3.513, and price is oscillating between these two zones.
⚡️ I’ve marked the top of the box as a zone as well. This is a major supply zone, and a breakout above it could trigger a bullish trend.
🧩 Personally, I’m watching this coin closely. If buying volume enters and the trigger is activated, I’ll either enter a long position or buy it in spot.
📈 For a long position, the breakout of the 3.513 zone that I marked seems appropriate. If this zone breaks, we can open a long position.
🔍 The target for this position can be set around 4.123. This level is also a good spot trigger. If we enter a long at 3.513 and price moves up to 4.123, we can use the profit from the futures trade to buy this coin in spot.
✨ This way, we’ll have purchased a reasonable amount of the coin using profits, without needing any unusual risk or capital management because the capital was already managed beforehand.
📊 There’s also an ascending trendline visible on the chart that the price has responded to well. If the price gets rejected from the 3.513 zone and breaks this trendline, we can open a short position once the trendline trigger is activated, targeting the 3.024 and 2.851 levels.
📝 Final Thoughts
This analysis reflects our opinions and is not financial advice.
Share your thoughts in the comments, and don’t forget to share this analysis with your friends! ❤️

TradeCityPro | Bitcoin Daily Analysis #114👋 Welcome to TradeCity Pro!
Let’s go over Bitcoin analysis and the key crypto indexes. As usual, I’ll break down the futures triggers for the New York session.
⏳ 1-Hour Timeframe
On the one hour timeframe, as you can see, a trading range has formed between the levels of 108617 and 110256. This has happened after a strong upward move with significant buying volume, and now we’re in a market correction phase.
📊 Market volume is decreasing during this corrective phase, which shows the strength of the buyers and supports the ongoing uptrend. RSI has exited the Overbuy zone and is now cooling off, which indicates that the bullish momentum has weakened for now.
📈 For a long position, the 110256 trigger seems very suitable today. If the price forms a higher low above 108617 before breaking this level, the probability of breaking 110256 increases significantly.
💥 If this trigger is activated, it’s crucial that volume rises as well. That would confirm the strength of the trend and increase the chances of the uptrend continuing. The current target for this position is 111747.
🔽 In the correction scenario, if the price stabilizes below 108617, this scenario becomes more likely and a deeper correction could follow.
✨ Personally, I won’t open a short position unless we get confirmation of a trend reversal. But if you want to go short, a break below 108617 is not a bad option and could signal a downward move.
👑 BTC.D Analysis
Bitcoin dominance has continued its downward movement, stabilized below 64.12, and is now heading toward 63.93.
⭐ If the 63.93 low is broken, the bearish move in dominance will likely continue. If it pulls back, a break above 64.12 will confirm that retracement.
📅 Total2 Analysis
Let’s look at Total2. Yesterday, it broke through the 1.2 level and is now moving toward 1.24. A breakout above this level could start the next bullish leg.
🎲 If a correction occurs, the price may drop back to 1.2 or even 1.18.
📅 USDT.D Analysis
Now for Tether dominance. This index is still sitting at the 4.56 support and is currently being held there. If 4.56 breaks, the next bearish leg can form.
🔔 In case of a retracement, USDT dominance might rise to 4.64.
❌ Disclaimer ❌
Trading futures is highly risky and dangerous. If you're not an expert, these triggers may not be suitable for you. You should first learn risk and capital management. You can also use the educational content from this channel.
Finally, these triggers reflect my personal opinions on price action, and the market may move completely against this analysis. So, do your own research before opening any position.

TradeCityPro | KAS Ranges Near Top with Bullish Momentum Rising👋 Welcome to TradeCity Pro!
In this analysis, I want to review the coin KAS for you. It’s one of the Layer One projects, and its token currently ranks 40 on CoinMarketCap with a market cap of 2.35 billion dollars.
⏳ 4-Hour Timeframe
On the four hour timeframe, the price is moving inside a range box between the levels of 0.082767 (which I’ve also marked as a zone) and 0.091126, and is currently near the top of the box.
✔️ Considering that other coins and market indexes like Bitcoin and Total2 are showing bullish confirmations, the activation of this coin’s long trigger could initiate a strong upward move.
📊 The volume increase shown on the chart is another reason why the probability of breaking the top of the box has gone up.
📈 For a long position, we can enter with the trigger at 0.091126. If the breakout candle comes with strong volume, we’ll have volume confirmation as well, and momentum confirmation will come from RSI breaking above 62.96.
✨ Given the confirmations, the likelihood of this trigger activating seems high, and we can target a move to 0.102417 or even 0.126033.
🛒 For a spot buy of this coin, it’s better to wait for a break above 0.126033. We can open a futures position at the 0.091126 trigger aiming for 0.126033, and once the price reaches 0.126033, we can use the profits from the futures trade to enter the spot market.
🔽 As for bearish movement and a short trigger, the first sign would be rejection from the 0.091126 area. The main trend reversal trigger will be the breakdown of the support zone.
📝 Final Thoughts
This analysis reflects our opinions and is not financial advice.
Share your thoughts in the comments, and don’t forget to share this analysis with your friends! ❤️

TradeCityPro | Bitcoin Daily Analysis #113👋 Welcome to TradeCity Pro
Let’s dive into the Bitcoin analysis and key crypto indexes. As usual in this analysis, I’ll walk you through the futures triggers for the New York session.
⏳ 1-Hour Timeframe
As you can see in the one hour timeframe, Bitcoin has continued its upward movement and reached the 110256 level and is now undergoing a correction.
✔️ If the price continues correcting, the next support level will be 108777. In case of a deeper pullback, the next area to watch is 106586.
📈 For a long position, our first trigger level is 110256, with a target of 111747.
📊 Market volume is currently increasing, and if this inflow of buy volume continues, the probability of a bullish move increases.
💥 The RSI oscillator has dropped below the 70 level. If RSI reenters the overbought zone, we’ll also get a strong momentum confirmation.
👑 BTC.D Analysis
Let’s take a look at Bitcoin Dominance. Today, it finally closed below the 64.49 level and has dropped to 64.12.
⚡️ This drop has allowed capital to flow into altcoins, and many of them are moving upward today. If 64.12 breaks, the downtrend may continue.
📅 Total2 Analysis
Moving on to Total2, this index finally broke above the 1.21 level and is now heading toward 1.24.
💫 At the moment, there is no major resistance preventing the market from continuing its upward trend. But there’s an important point regarding USDT Dominance, which I’ll cover below.
📅 USDT.D Analysis
During this bullish move in the market, the dominance of Tether hit the support at 4.56, while other indexes and most altcoins activated their triggers.
🔑 The key point here is that Tether Dominance has such a significant influence on the market that the inability to break this support has caused the entire market, including Bitcoin, to start correcting.
🔽 The 4.56 level in USDT Dominance is very important and will be the key to triggering the next bullish leg.
❌ Disclaimer ❌
Trading futures is highly risky and dangerous. If you're not an expert, these triggers may not be suitable for you. You should first learn risk and capital management. You can also use the educational content from this channel.
Finally, these triggers reflect my personal opinions on price action, and the market may move completely against this analysis. So, do your own research before opening any position.

TradeCityPro | ICP Approaches Key Resistance with Rising Volume👋 Welcome to TradeCity Pro
In this analysis, I want to review the ICP coin for you. The Internet Computer project operates in the fields of artificial intelligence and DePIN.
⭐ The coin of this project, with the symbol ICP, has a market cap of 3.25 billion dollars and ranks 32nd on CoinMarketCap.
📅 Daily Timeframe
As you can see in the daily timeframe, there is a descending trendline visible on the chart, which has been tested multiple times. The price has broken above it and is now sitting just below the 6.205 resistance level.
🔍 In recent candles, the volume has increased significantly, which raises the likelihood of a breakout above 6.205.
🔔 If the 6.205 level is broken, ICP's bullish trend could begin. In that case, the price could move toward the 7.423 and 9.887 levels.
📊 Entering a position with the breakout of 6.205 is supported by volume confirmation, and we will get RSI momentum confirmation if it enters the overbought zone.
📉 For the bearish scenario to play out, the price must first get rejected from 6.205, and then we’ll look for confirmation of a trend reversal with a break below 4.468.
🛒 You can also use this same 6.205 trigger for a spot buy, but keep in mind that Bitcoin dominance is still in an uptrend, so in my opinion, it’s not yet the right time to buy altcoins.
✔️ The best trigger for buying any altcoin is to wait for confirmation of a trend reversal in Bitcoin dominance. Once that’s confirmed, you can start buying the altcoins you’ve selected.
📝 Final Thoughts
This analysis reflects our opinions and is not financial advice.
Share your thoughts in the comments, and don’t forget to share this analysis with your friends! ❤️

TradeCityPro | Bitcoin Daily Analysis #112👋 Welcome to TradeCity Pro
Let’s dive into the analysis of Bitcoin and key crypto indexes. As usual, in this analysis I’ll review the futures triggers for the New York session.
⏳ 1-Hour Timeframe
Yesterday, Bitcoin finally broke through the resistance zone it had formed. As you can see, it pushed through this level with strong buying volume and is now moving toward 108777.
🔍 If you entered a position using yesterday’s triggers, I’d be glad to hear about it in the comments. Your feedback gives me great energy.
⭐ Today, I cannot provide a specific trigger because the market has already made its move. If you do not have an open position, it is better to wait for a new market structure and then identify a fresh trigger.
💥 At the moment, I expect Bitcoin’s upward movement to continue toward 108777. Market volume is strongly supporting the trend and is aligned with price action. RSI is also in the overbought zone, indicating strong buyer presence. If RSI stays above 70, the sharp upward movement is likely to continue.
📊 If a market correction occurs, the price could pull back to the zone I marked. In future analyses, I will review triggers for both trend continuation and possible reversals.
👑 BTC.D Analysis
Bitcoin dominance formed a higher low above 6449 and has now broken the 6467 resistance, signaling the beginning of a new bullish leg.
⚡️ If this upward move continues, Bitcoin dominance may climb further. However, if a pullback to 6467 happens, altcoins could see a strong upward move as well.
📅 Total2 Analysis
Looking at Total2, this index was supported at 114 yesterday and is now moving toward 117.
📈 If Bitcoin dominance starts to drop, Total2 will likely break above 117 and begin a main bullish trend.
📅 USDT.D Analysis
Now for Tether dominance. After forming a lower high below 479, it broke below the 472 support and is now heading toward 464.
✅ In my view, this movement toward 464 is likely to continue, and as that happens, the overall crypto market is expected to keep moving upward.
❌ Disclaimer ❌
Trading futures is highly risky and dangerous. If you're not an expert, these triggers may not be suitable for you. You should first learn risk and capital management. You can also use the educational content from this channel.
Finally, these triggers reflect my personal opinions on price action, and the market may move completely against this analysis. So, do your own research before opening any position.

TradeCityPro | ADA: Holding Key Support Inside Descending Channe 👋 Welcome to TradeCity Pro!
In this analysis, I want to review the ADA coin for you, one of the most popular cryptocurrencies, currently ranked 10th on CoinMarketCap with a market cap of 23 billion dollars.
📅 Daily Timeframe
As you can see in the daily timeframe, the price is fluctuating between two key support and resistance zones. Additionally, there's a descending channel in play, and the price has recently been rejected from the top of this channel and moved down to the support zone.
✨ The 0.61 zone is a very strong area, and the price has reacted to it multiple times. It was broken once, but as the price reached the bottom of the channel, it was supported again and moved back above the level — indicating a possible fakeout.
✔️ If this zone is broken again, the likelihood of another drop toward the 0.5579 level or the bottom of the box increases. So I think it’s worth considering a short position on lower timeframes if this zone breaks.
💥 RSI entering the oversold area would be a strong momentum confirmation trigger for this trade.
📊 Currently, ADA's volume is quite low, and with this low volume, it’s not suitable for either long or short positions. I suggest waiting until significant volume enters ADA before taking a position.
🛒 For spot buying or long-term long positions, the first trigger is the price's reaction to this support zone. If a confirmation candle forms here, we can consider entering. However, in my view, this trigger is risky, and I personally prefer to wait for more reliable confirmations.
📈 A more reliable trigger would be a breakout of the descending channel. If either the channel itself or the 0.8414 trigger is broken, we can enter a position. And if you want the strongest confirmation and wish to enter with the main trend, you should wait for the 1.1325 level to be broken.
❌ Disclaimer ❌
Trading futures is highly risky and dangerous. If you're not an expert, these triggers may not be suitable for you. You should first learn risk and capital management. You can also use the educational content from this channel.
Finally, these triggers reflect my personal opinions on price action, and the market may move completely against this analysis. So, do your own research before opening any position.

TradeCityPro | Bitcoin Daily Analysis #111👋 Welcome to TradeCity Pro!
Let’s take a look at Bitcoin and key crypto indicators. As usual in this analysis, I’ll review the futures triggers for the New York session.
⏳ 1-Hour Timeframe
As you can see in the 1-hour timeframe, none of our triggers were activated yesterday and Bitcoin has been ranging.
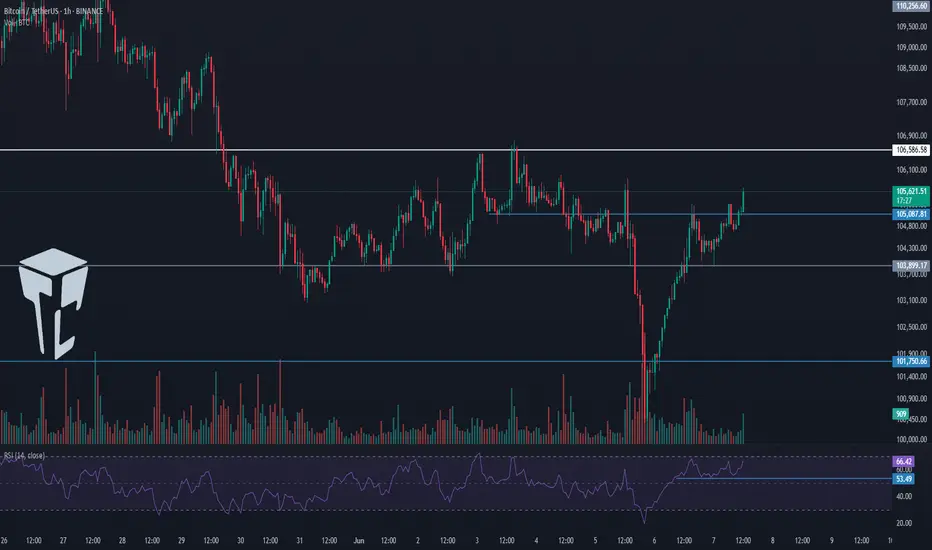
⭐ There was an important RSI level at 53.49, which was tested multiple times. I mentioned that breaking this level could trigger a slight correction — and that’s exactly what happened. The price pulled back slightly to 105087, retested this zone, and now RSI has returned above 53.49. Price is also moving with strong bullish momentum toward the 105851 resistance.
📊 The buying volume entering the market is quite strong, and if this increase continues, the price could begin an upward move. So in terms of both momentum and volume, we have bullish confirmation and can enter a position if the triggers activate.
📈 For a long position, the trigger we’re watching is 105851. While the main resistance is at 106586, I prefer to take the risk and open the position earlier, because I think the 106586 break won’t provide a clean entry and would be harder to act on.
✨ So my chosen trigger for a long position is 105851. Given the rising volume and high RSI momentum, we have the confirmations needed to open this trade.
🔽 For a short position, the first trigger is the break of 105087. This is a risky position since we haven’t yet confirmed a trend reversal — this would be the first signal if a downtrend begins. Personally, I’ll wait for confirmation of bearish momentum before opening a short.
👑 BTC.D Analysis
Bitcoin Dominance is still below the 64.67 level and is ranging under this resistance.
🧩 A break above 64.67 would confirm a bullish move in dominance. A break below 64.49 would signal a bearish reversal.
📅 Total2 Analysis
Total2 is ranging below the 1.15 level. A break above this zone could initiate a bullish move.
🔔 On the bearish side, the current trigger is the 1.13 level. We need to wait for this level to be broken for a trend reversal confirmation.
📅 USDT.D Analysis
Tether Dominance stabilized below the 4.79 zone yesterday and has now pulled back to it, preparing for a possible second leg downward.
🔑 If that happens, the crypto market could move upward. However, if USDT.D rises back above 4.79, its uptrend could continue.
❌ Disclaimer ❌
Trading futures is highly risky and dangerous. If you're not an expert, these triggers may not be suitable for you. You should first learn risk and capital management. You can also use the educational content from this channel.
Finally, these triggers reflect my personal opinions on price action, and the market may move completely against this analysis. So, do your own research before opening any position.

TradeCityPro | NEAR: Key Support Battle in Layer 1 AI Protocol👋 Welcome to TradeCity Pro!
In this analysis, I’m going to review the NEAR coin for you — one of the prominent AI-focused and Layer 1 protocols that has gained significant attention in recent years.
🔍 This project’s coin, with the ticker NEAR, currently holds a market cap of $2.94 billion, ranking 34th on CoinMarketCap.
📅 Daily Timeframe
As you can see in the daily timeframe, there is a very strong support level at 2.239, which has been tested multiple times. The price has once again reached this zone.
✨ If this level breaks, the price could drop toward lower supports such as 1.694. Therefore, a break below 2.239 would be a valid trigger for a short position.
💫 The trendline drawn on the chart is also a significant level. If 2.239 is broken, price could potentially react to this trendline as well.
💥 If price holds this support and attempts a bullish move, we can open a long position upon breaking 2.653.
📈 The main long triggers, including potential spot buying, are at 3.355 and 3.548. If these levels are broken, NEAR could begin a strong uptrend toward targets at 4.726 and 7.998.
📊 Currently, market volume is ranging — buyers and sellers are evenly matched. We need to wait and see which side gains dominance to follow the momentum.
✔️ On the RSI oscillator, entering the Oversold zone would confirm a short setup, while breaking above the 50 RSI level would confirm a long setup.
📝 Final Thoughts
This analysis reflects our opinions and is not financial advice.
Share your thoughts in the comments, and don’t forget to share this analysis with your friends! ❤️

TradeCityPro | Bitcoin Daily Analysis #110👋 Welcome to TradeCity Pro!
Let’s dive into the Bitcoin analysis and major crypto indexes. In this review, as usual, I’ll cover the key futures triggers for the New York session.
⏳ 1-Hour Timeframe
As you can see in the 1-hour timeframe, Bitcoin formed a higher low yesterday and has now reached the 105087 resistance. It seems likely that this level will be broken soon.
✨ Currently, a candle has closed above 105087, but price hasn’t yet confirmed a breakout, and the move hasn’t taken off.
📈 For a long position, we can enter once the price confirms a breakout above this level. If 105087 breaks, price could target 106586. The main long position will be opened upon breaking 106586.
🛒 Strong buying volume is a very good trigger for this setup. RSI entering the Overbought zone would also provide a powerful momentum confirmation, and price could rise accordingly.
💥 If the current upward move fails and price falls below the recent low, we can open a short position upon breaking 103899, targeting 101750.
⚡️ The 53.49 level on RSI is critical — its break would serve as a strong confirmation for the short position.
👑 BTC.D Analysis
Looking at Bitcoin Dominance, yesterday it once again moved toward 64.67, but failed to break it and is now heading downward after being rejected from that resistance.
🔑 The trigger for bullish continuation remains 64.67, while 64.49 serves as the trigger for a bearish move.
📅 Total2 Analysis
This index formed a higher low at 1.13 yesterday and is now testing the 1.15 resistance. If this level breaks, the price could head toward 1.17 and 1.18.
📊 A break above 1.15 would be a valid long trigger. However, if price is rejected and moves downward, breaking 1.13 could send it back toward 1.1.
📅 USDT.D Analysis
USDT Dominance closed below the 4.79 level yesterday and is now moving toward 4.70. If this continues, the crypto market could see bullish momentum.
🧩 However, if dominance moves back above 4.9, the next bullish leg in USDT.D could begin.
❌ Disclaimer ❌
Trading futures is highly risky and dangerous. If you're not an expert, these triggers may not be suitable for you. You should first learn risk and capital management. You can also use the educational content from this channel.
Finally, these triggers reflect my personal opinions on price action, and the market may move completely against this analysis. So, do your own research before opening any position.
TradeCityPro | ATOM: Major Support Test in Cosmos Ecosystem Coin👋 Welcome to TradeCity Pro!
In this analysis, I’m going to review the ATOM coin for you. This project is part of the Osmosis network ecosystem.
🔍 ATOM, with a market cap of $1.68 billion, is currently ranked 51st on CoinMarketCap.
📅 Daily Timeframe
As you can see in the daily timeframe, ATOM is currently sitting on a very significant support zone. It has tested this area multiple times, and once again, it’s hovering around that level.
⭐ If the price finds support here and begins to move upward, we can consider entering a long position with a trigger at 4.588. The main bullish trigger will be the 5.380 level, and if that breaks, spot buying can also be considered.
✨ As I always mention with spot triggers on altcoins, it’s best to wait for Bitcoin dominance to start declining before entering. If that happens, ATOM could potentially move toward targets at 7.514 and 10.4.
⚡️ If the key support at 4.075 breaks, we can open a short position targeting 3.501. The 35.68 level on the RSI is a critical support, and a break below it would serve as a momentum confirmation.
📊 Also, keep an eye on market volume. It has been declining recently, and once volume starts flowing in on either side, we can prepare to act on the corresponding trigger.
📝 Final Thoughts
This analysis reflects our opinions and is not financial advice.
Share your thoughts in the comments, and don’t forget to share this analysis with your friends! ❤️

TradeCityPro | Bitcoin Daily Analysis #109👋 Welcome to TradeCity Pro!
Let’s dive into the Bitcoin analysis and key crypto indicators. As usual, I’ll walk you through the futures triggers for the New York session.
⏳ 1-Hour Timeframe
In the 1-hour chart, as you can see, yesterday Bitcoin activated the short trigger at 103899 and dropped below the 101750 level. This setup gave an opportunity to open a short position—hopefully you took advantage of it.
✨ After that bearish leg, the downtrend ended and the price began to rise again, now reaching back to the 103899 level.
🔍 If the price gets rejected once from 103899 and then forms a higher low compared to 101750, we can consider a long position on subsequent attempts—if 103899 breaks. If the price breaks this level sharply, the next long triggers will be 105087 and 106586.
📉 For today's short position, we can enter on a pullback to 103899. Personally, I’ll look for a bearish trigger in lower timeframes; if confirmed, I’ll open a short. The main bearish trigger remains the break of 101750.
📊 Currently, volume favors buyers, but we’ve seen divergence during this bullish leg, and volume increased on the last bearish move. So, I still see a higher probability of the market turning bearish rather than bullish.
👑 BTC.D Analysis
Looking at Bitcoin dominance, yesterday it made an upward move to 64.67 after breaking through 64.23. This 64.67 level is a strong resistance, and as shown, the dominance got rejected there.
💫 If this rejection is confirmed, there's a high chance of a retracement back to 64.23. In that case, if the market continues to drop, Bitcoin will likely be a better short than altcoins.
☘️ However, if 64.67 breaks, dominance could initiate another bullish wave.
📅 Total2 Analysis
As for Total2, after activating the 1.16 and 1.13 triggers, it dropped to the 1.1 zone and is now making a pullback to its previous support—similar to Bitcoin.
💥 For a long position, we’ll need a Dow Theory confirmation. For a short, we can wait for a pullback to 1.13 and look for a bearish confirmation to enter.
📅 USDT.D Analysis
Now onto Tether dominance: yesterday, after breaking 4.79, it moved up to 4.98. Following that, it reversed and is now back down to 4.79.
🔑 If 4.79 breaks, Tether dominance could drop further to 4.70 and 4.64. But if it holds and finds support there, another bullish leg may begin.
❌ Disclaimer ❌
Trading futures is highly risky and dangerous. If you're not an expert, these triggers may not be suitable for you. You should first learn risk and capital management. You can also use the educational content from this channel.
Finally, these triggers reflect my personal opinions on price action, and the market may move completely against this analysis. So, do your own research before opening any position.

TradeCityPro | Bitcoin Daily Analysis #108👋 Welcome to TradeCity Pro!
Let’s dive into the analysis of Bitcoin and key crypto indices. As usual, in this analysis, I’ll review the futures session triggers for New York.
⏳ 1-Hour Timeframe
As you can see in the 1-hour timeframe, yesterday the 105087 trigger was activated, and now after a pullback to that level, the price is heading toward the 103899 support.
💥 If you entered a short position based on the 105087 trigger, you can hold it until 103899. If you haven’t opened a position yet, you can consider today’s triggers.
🔽 The first short trigger for today is the 103899 level. A break below this level can start a major bearish move. Personally, I’ll enter a short if this level breaks.
⚡️ Breaking below 38.95 on the RSI will give us a suitable momentum confirmation. If selling volume increases, the probability of a bearish move will rise.
📈 For long positions, our first trigger is the same 105087 level. If a higher low is formed compared to 103899 and this level breaks, it will provide a good long opportunity.
💫 The main long trigger is 106586. If this level is broken, the uptrend can resume and price could move toward higher resistance levels.
👑 BTC.D Analysis
Looking at Bitcoin Dominance, a range box has formed between 63.93 and 64.23.
✨ A break above 64.23 confirms bullish continuation, while a break below 63.93 confirms a bearish trend in dominance.
📅 Total2 Analysis
Moving to Total2, yesterday it closed below 1.17, and now after a pullback, it's heading toward 1.16.
✅ If 1.16 breaks, a short position can be opened. If the downward move turns out to be fake, a break above 1.18 gives us a long trigger.
📅 USDT.D Analysis
Looking at Tether Dominance, yesterday it confirmed above 4.70 and is now moving toward 4.79. A break of 4.79 could signal a continuation of the upward move.
📊 If it closes back below 4.70, the price could move toward 4.64. A break below 4.64 would signal a bearish trend in USDT dominance.
❌ Disclaimer ❌
Trading futures is highly risky and dangerous. If you're not an expert, these triggers may not be suitable for you. You should first learn risk and capital management. You can also use the educational content from this channel.
Finally, these triggers reflect my personal opinions on price action, and the market may move completely against this analysis. So, do your own research before opening any position.

TradeCityPro | ALGO: Bearish Pressure Builds Near Key Support👋 Welcome to TradeCity Pro!
In this analysis, I’m going to review the ALGO coin for you. The Algorand project is one of the Layer 1 and RWA projects.
⚡️ The coin, with the ticker ALGO, currently holds a market cap of $1.63 billion and ranks 53rd on CoinMarketCap.
⏳ 4-Hour Timeframe
As you can see in the 4-hour timeframe, after the price reached the 0.2505 resistance level, a bearish phase began, and with the breakdown of the 0.2123 level, the first bearish leg extended down to 0.1912.
✔️ After this drop, the price retraced up to the 0.382 Fibonacci level and now has returned to the 0.1912 zone. Given the strong bearish momentum in the market, the probability of breaking this level is quite high.
✨ If 0.1912 is broken, the extension wave could begin. According to Fibonacci projections, the targets for this position are 0.1780, 0.1732, and 0.1602.
💥 An entry of RSI into the Oversold zone would serve as a very strong momentum confirmation for this position. If that happens, the price may reach the 0.1602 target.
📊 Volume also plays a key role. Currently, the selling volume isn’t very strong, which might result in a fake breakout of 0.1912. I suggest waiting to see whether sell volume increases, because without volume, price movement is unlikely.
📈 For a long position, the first trigger we currently have is the 0.2023 level, which is a significant high and overlaps with the 0.382 Fibonacci retracement level. Breaking this level could resume the long-term bullish trend.
💫 The momentum confirmation for a long position would be the RSI breaking above the 50 level. A breakout here could kick off a bullish trend in the higher timeframes.
📝 Final Thoughts
This analysis reflects our opinions and is not financial advice.
Share your thoughts in the comments, and don’t forget to share this analysis with your friends! ❤️

TradeCityPro | LINKUSDT Chart Primed for a Big Move! 👋 Welcome to TradeCityPro Channel!
Let’s dive into analyzing one of the market’s most popular coins, LINK, which continues to hold its key supports in higher timeframes and is poised for strong moves during a market uptrend.
🌐 Overview Bitcoin
Before starting the analysis, I want to remind you again that we moved the Bitcoin analysis section from the analysis section to a separate analysis at your request, so that we can discuss the status of Bitcoin in more detail every day and analyze its charts and dominances together.
This is the general analysis of Bitcoin dominance, which we promised you in the analysis to analyze separately and analyze it for you in longer time frames.
📊 Weekly Timeframe
On the weekly timeframe, LINK has been one of the cryptocurrencies that remained in a range for 500 days. After breaking out, we have seen the beginning of an uptrend.
This is exactly what I mean by avoiding capital lock-up. We waited weeks for the 8.06 trigger to break, allowing us to buy with momentum confirmation rather than buying inside the range and waiting in a high-risk market.
You might say, "Why not buy inside the range to avoid missing the 8.06 breakout?" My answer is that hundreds of coins are still stuck in similar ranges without showing any bullish moves, and even now, they could trap your capital for a long time, causing frustration!
Currently, we can say that after a price rejection at 18.10, we’ve pulled back, and if selling volume increases, we’ll go to test the 9.06 level, but if we form a higher low, we’ve created a good trigger for a buy!
📈 Daily Timeframe
On the daily timeframe, LINK is one of the few cryptocurrencies that, after recent corrections, did not return to lower levels. Instead, it bounced off the 0.382 Fibonacci level, increasing the bullish bias.
After breaking 12.96, LINK had a strong rally up to 29.07, where resistance was observed.
Instead of considering 29.07 as resistance, I prefer to buy after a breakout of 26, as this level was previously a pullback zone and had multiple rejections.
On the daily timeframe, we’ve also been rejected from a strong resistance, which further emphasizes the importance of this daily resistance, and it’s better to say that as long as we’re above the 11.99 support level, the 17.45 resistance will be the best trigger for a spot buy and our entry!
📝 Final Thoughts
Stay calm, trade wisely, and let's capture the market's best opportunities!
This analysis reflects our opinions and is not financial advice.
Share your thoughts in the comments, and don’t forget to share this analysis with your friends! ❤️

TradeCityPro | Bitcoin Daily Analysis #107👋 Welcome to TradeCity Pro!
Let’s dive into Bitcoin and key crypto indices. As usual, in this analysis I’ll walk you through the triggers for the New York futures session.
⏳ 1-Hour Timeframe
As you can see in the 1-hour timeframe, yesterday the price made another upward move and formed its resistance at the 106586 level and a bottom at 105087.
📈 For a long position, considering the uptrend in higher timeframes such as the daily and weekly, we can enter upon a breakout of 106586. A bounce of the RSI from the 50 level can act as a good confirmation for the position.
📊 Buying volume is currently increasing, but the price is still sitting on the support bottom and hasn’t moved upward yet. If this volume inflow continues, a breakout of 106586 would be a strong confirmation for a long position.
🔽 For a short position, the first trigger is the breakdown of the 105087 bottom. If this level is broken, we can enter a short. The main short trigger is at 103899.
💥 Conditions are currently favorable for a short position, and the current candle has strong bearish momentum. So, if 105087 breaks, a short position would be appropriate.
👑 BTC.D Analysis
Let’s look at Bitcoin Dominance. After a pullback to the 64.23 level, the next bearish leg continued to 63.93. If 63.93 breaks, the downtrend is likely to continue and the price could fall to 63.50.
✅ If 63.93 holds, dominance may start moving back up toward 64.67.
📅 Total2 Analysis
Now let’s check out Total2. This index is still below the 1.18 level, and breaking this level would confirm a bullish move.
✨ A new bottom has also formed at 1.17. If this level breaks, we can look for a short position.
📅 USDT.D Analysis
Now to Tether Dominance. This index has formed a box between 4.64 and 4.70.
🔔 A breakout above 4.70 could initiate a bullish move in dominance, while a breakdown below 4.64 could trigger a bearish move.
❌ Disclaimer ❌
Trading futures is highly risky and dangerous. If you're not an expert, these triggers may not be suitable for you. You should first learn risk and capital management. You can also use the educational content from this channel.
Finally, these triggers reflect my personal opinions on price action, and the market may move completely against this analysis. So, do your own research before opening any position.

TradeCityPro | APE: Key Breakout Watch in Gaming Token’s Range👋 Welcome to TradeCity Pro!
In this analysis, we’re taking a look at the APE coin — one of the prominent American gaming and metaverse projects that gained major traction during the last bull run.
⭐ Currently, APE holds a market cap of $540 million and ranks 110th on CoinMarketCap.
📅 Daily Timeframe
As shown on the daily chart, price has reached a key resistance zone and has tested it several times.
✔️ If this resistance breaks, it could confirm a trend reversal, potentially opening the way toward higher levels like 0.8990 and even 1.973.
🛒 For spot buying, an entry can be considered upon the breakout of this resistance, though it's safer to wait for confirmation of bearish momentum in Bitcoin dominance before entering a spot position on APE.
📈 However, for futures positions, this same breakout trigger can be used — either on the daily chart or lower timeframes.
🔽 On the short side, a support level has formed at 0.6073. A break below this could extend the bearish trend toward 0.3833.
⚡️ Still, there’s a major support level nearby at 0.5633. If you’re looking for a more conservative short entry, you might wait for a clean break below 0.5633.
💥 Momentum confirmation for the short position would come with an RSI breakdown below 46.46, which would signal stronger bearish pressure entering the market.
📝 Final Thoughts
This analysis reflects our opinions and is not financial advice.
Share your thoughts in the comments, and don’t forget to share this analysis with your friends! ❤️

TradeCityPro | Bitcoin Daily Analysis #106👋 Welcome to TradeCity Pro!
Let’s dive into Bitcoin and the key crypto indices. As usual, I’ll be reviewing the futures triggers for the New York session.
⏳ 1-Hour Timeframe
On the 1-hour chart, the 105800 trigger was activated yesterday and Bitcoin’s trendline was broken. However, the price failed to hold above 105800 and quickly fell back below, making it a fake breakout.
⚡️ For now, I’m keeping the 105800 level as the long trigger to observe how the price reacts. We need to wait for a clear reaction to this zone to better refine the trendline. On the next test, if it breaks successfully, we can enter a long position.
🔍 If a higher low forms above 103899 and the RSI finds support above 50, the likelihood of breaking the 105800 resistance increases, potentially leading to a stronger upward move.
✨ On the short side, since the 105800 breakout failed, bearish momentum could increase. A breakdown below 103899 would trigger a short position with a target at 10750.
If you’ve already opened a short position before this trigger, be aware that it's a risky trade and shouldn’t be relied on as a long-term position.
👑 BTC.D Analysis
The downtrend in Bitcoin dominance has continued following the breakdown of 64.29, and now it has also broken below 64.15, heading toward 63.87.
⭐ For now, BTC dominance is temporarily bearish. If the market corrects, Bitcoin might fall harder, but if the market recovers, altcoins could perform better — unless BTC dominance reverses trend.
📅 Total2 Analysis
Yesterday, the long trigger at 1.16 was activated, and now the index has reached 1.18. Thanks to falling Bitcoin dominance, altcoins have outperformed Bitcoin.
✔️ If 1.18 breaks, the uptrend could continue. Key levels to watch next are 1.21 and 1.24.
📅 USDT.D Analysis
This index formed a lower high below 4.79 yesterday and is now retesting 4.70 after breaking below it.
🎲 If this pullback gets rejected, it confirms weakness in USDT dominance — which supports long positions on altcoins. However, if USDT.D climbs back above 4.70 and it turns into a fake breakdown, there’s a strong chance it could revisit 4.79 or even break that resistance.
❌ Disclaimer ❌
Trading futures is highly risky and dangerous. If you're not an expert, these triggers may not be suitable for you. You should first learn risk and capital management. You can also use the educational content from this channel.
Finally, these triggers reflect my personal opinions on price action, and the market may move completely against this analysis. So, do your own research before opening any position.

TradeCityPro | APT: Triangle Squeeze Near Crucial Support Zone👋 Welcome to TradeCity Pro!
In this analysis, I’ll be reviewing the APT coin. The Aptos project is one of Ethereum’s Layer 2 solutions.
✔️ This project’s token currently holds a market cap of $3.1 billion and ranks 32nd on CoinMarketCap.
📅 Daily Timeframe
On the daily chart, you can see a very strong support level at 4.718, which has been tested multiple times. The price has once again reached this zone.
💥 A descending trendline can also be drawn, showing clear reactions from the price. The area between this trendline and the 4.718 support forms a triangle pattern.
⭐ If the 4.718 support breaks, a short position could be considered. A breakdown below 37.78 on the RSI would serve as strong confirmation of bearish momentum.
📉 The initial target for the short would be 4.338. However, if a new bearish leg forms and the market heads toward lower lows, a drop toward the 3.12 support level is also possible.
📊 Confirmation of a bullish reversal would come from a breakout above the descending trendline. If this trendline is broken and the 6.152 trigger activates, it would justify opening a long position or even buying in the spot market.
🛒 When it comes to spot purchases, the most important factor is a trend reversal in Bitcoin dominance. Personally, I do not buy any altcoins on spot until Bitcoin dominance shifts downward on the daily chart — I only trade them in futures.
📝 Final Thoughts
This analysis reflects our opinions and is not financial advice.
Share your thoughts in the comments, and don’t forget to share this analysis with your friends! ❤️

TradeCityPro | Bitcoin Daily Analysis #105👋 Welcome to TradeCity Pro!
Let’s dive into Bitcoin and key crypto indices. As usual, in this analysis, I’ll walk you through the triggers for the New York futures session.
⏳ 1-Hour Timeframe
On the 1-hour chart, as you can see, Bitcoin’s correction phase began after the breakdown of the 107010 level. Currently, after pulling back to the 105673 area, it seems ready to begin its next corrective leg.
✔️ One of the reasons Bitcoin has moved downward over the past few days is the escalation of war between Ukraine and Russia. As the conflict intensified, risk assets like Bitcoin dropped while safe-haven assets like gold surged.
🔍 Currently, price action is forming an expanding triangle and is trending downward. It was recently rejected from the triangle’s top and is now sitting on a key support at 103899.
💥 If 103899 breaks, a short position targeting 101750 could be triggered. Selling volume has increased significantly, confirming bearish momentum, so opening a short upon a break of 103899 appears logical. However, keep in mind that the primary market trend remains bullish, and there is a high probability that any short may hit stop-loss.
📈 For a long position, the first trigger would be a breakout above the triangle. In this case, breaking 105673 could justify entry. Key overhead resistances are located at 107010 and 110256.
👑 BTC.D Analysis
Looking at Bitcoin dominance, the metric continued its upward move to reach 64.67 and has since been rejected from that level.
⚡️ If the bullish move continues, the breakout above 64.67 would act as a bullish trigger. On the other hand, a breakdown below 64.29 would confirm a bearish shift.
📅 Total2 Analysis
Total2 is currently ranging between 1.13 and 1.16. A breakout from either side could serve as a trigger for a directional position.
📊 If 1.13 breaks, a short position could be considered. Conversely, breaking above 1.16 would signal a potential long.
📅 USDT.D Analysis
After breaking above 4.70, USDT dominance has been ranging between 4.70 and 4.79. It’s now heading back toward the 4.79 resistance.
🧩 If 4.79 is broken, the next bullish leg in dominance may begin. A drop back below 4.70 would bring the dominance back into its previous range and could lead to further downside toward 4.49.
❌ Disclaimer ❌
Trading futures is highly risky and dangerous. If you're not an expert, these triggers may not be suitable for you. You should first learn risk and capital management. You can also use the educational content from this channel.
Finally, these triggers reflect my personal opinions on price action, and the market may move completely against this analysis. So, do your own research before opening any position.

TradeCityPro | FET: Bullish Weakness Near Key Support Zone👋 Welcome to TradeCity Pro!
In this analysis, I’ll be reviewing the FET coin — one of the popular projects in the AI space.
✔️ This project’s token currently holds a market cap of $1.75 billion and ranks 48th on CoinMarketCap.
⏳ 4-Hour Timeframe
On the 4-hour chart, we can see an uptrend in place. However, in its latest leg up to 0.923, the trend has weakened significantly and lost momentum.
💥 After getting rejected at 0.923, the price saw a deep correction down to 0.718 and failed to form a higher low — a clear sign of weakness in the bullish trend.
🔍 The 0.718 level is a crucial support, and breaking below it could trigger a long-term short position targeting 0.639.
✨ A confirmation for this short setup would be an RSI drop into the oversold zone along with increased selling volume. For now, sell volume is low and offers no confirmation yet.
🔔 On the long side, if the 0.764 level is broken, we can consider that 0.718 has held as support, allowing for a potential long entry.
🧩 In my view, even if this trigger activates and the price moves higher, it’s likely to form a lower high or retest the 0.923 level without breaking it. A breakout beyond 0.923 seems unlikely for now.
📈 For the long setup, RSI confirmation would come with a break above 42.05. As market volume is still declining, we’ll need to wait for increased buy volume to strengthen the bullish case.
📝 Final Thoughts
This analysis reflects our opinions and is not financial advice.
Share your thoughts in the comments, and don’t forget to share this analysis with your friends! ❤️
