TradeCityPro | Bitcoin Daily Analysis #104👋 Welcome to TradeCity Pro!
Let’s dive into Bitcoin and key crypto indices. As usual, in this analysis I’ll walk you through the triggers for the New York futures session.
⏳ 1-Hour Timeframe
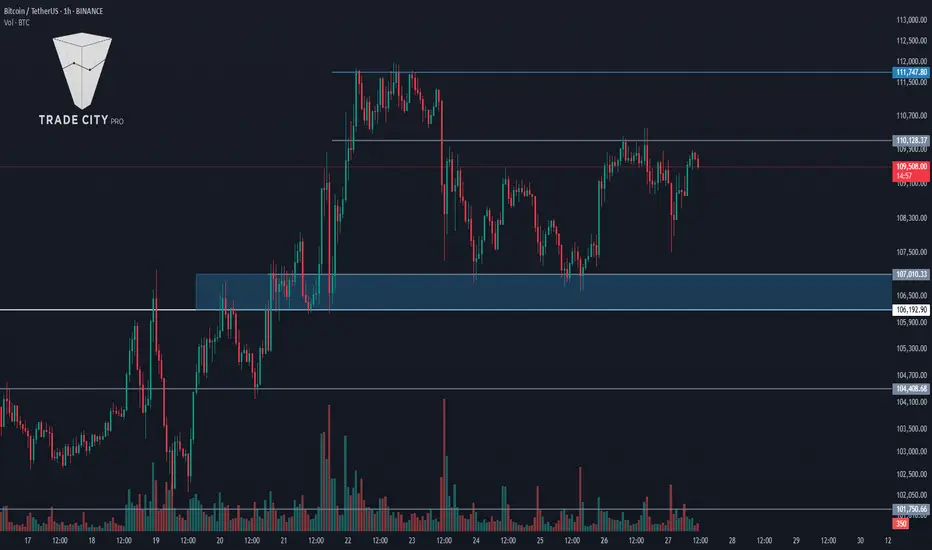
On the 1-hour chart, as you can see, Bitcoin was once again rejected from the 110128 level yesterday and is now hovering near 108237.
✔️ At the moment, price hasn’t yet touched the 108237 support. If it manages to stay above this level without breaking below, the chances of retesting 110128—and even breaking above it—increase.
🔍 If 108237 is broken, a short position could be considered. However, keep in mind that this setup goes against the current uptrend. As mentioned in previous analyses, the 106192–107010 range is a major support zone, and as long as price remains above it, the trend remains bullish.
📉 The main short trigger would be a break below this key support. If that occurs, it could introduce strong bearish momentum. An RSI break below 38.57 would serve as a momentum confirmation.
✨ During this pullback from 110128, market volume has been decreasing, which indicates the strength of the ongoing uptrend.
💥 If 110128 is broken, and considering the strong trend, a long position could be initiated. An RSI break above 50 would provide additional confirmation. The primary long trigger remains a break above 111747.
👑 BTC.D Analysis
Bitcoin Dominance continued to fall yesterday, reaching as low as 63.87. It has shown a slight bounce from that level and is currently in a mild upward correction.
⭐ If a lower high forms below 64.18, the chances of breaking below 63.87 increase. However, if the correction goes beyond 64.18, the probability of resuming the uptrend will grow.
📅 Total2 Analysis
Yesterday, Total2 was rejected from 1.24 and corrected down to 1.21. If price bounces from here and heads back toward 1.24, the chances of breaking that resistance will rise.
📊 If 1.21 fails to hold, a deeper correction toward 1.18 could follow.
📅 USDT.D Analysis
USDT Dominance is forming a lower high compared to 4.56. If this plays out and 4.49 is broken, it would confirm a bearish move.
⚡️ On the other hand, if 4.56 is broken to the upside, the move could extend toward 4.62.
❌ Disclaimer ❌
Trading futures is highly risky and dangerous. If you're not an expert, these triggers may not be suitable for you. You should first learn risk and capital management. You can also use the educational content from this channel.
Finally, these triggers reflect my personal opinions on price action, and the market may move completely against this analysis. So, do your own research before opening any position.
Tradecitypro

TradeCityPro | Bitcoin Daily Analysis #103👋 Welcome to TradeCity Pro!
Let’s dive into Bitcoin and key crypto indices. As usual, in this analysis I’ll walk you through the triggers for the New York futures session.
⏳ 1-Hour Timeframe
As you can see on the 1-hour chart, Bitcoin was rejected from the 110128 resistance yesterday and began a pullback, but it didn't reach the support at 107010 — instead, it formed a higher low and is now moving back toward 110128.
📊 Buy volume during this bullish leg has been relatively low, which isn’t ideal for a strong uptrend and indicates potential weakness.
📈 If the 110128 resistance breaks, a long position can be considered. However, if you take this trade, I suggest not setting your target at 111747 — instead, aim for higher targets and hold the position longer.
💥 The main long trigger remains at 111747. So if you missed or don’t want to trade the 110128 breakout, you can wait for this higher confirmation.
🔽 As for short setups, just like yesterday, it's still better to wait for a trend reversal. As long as the price remains above the support zone, the uptrend remains intact.
👑 BTC.D Analysis
Bitcoin Dominance broke above 64.32 yesterday but failed to hold and fell back below it, also breaking the 64.18 support. It’s now moving toward 63.97.
⭐ Currently, there is strong bearish momentum in BTC.D, and if 63.97 is broken, this downward move is likely to continue.
📅 Total2 Analysis
Total2 printed a higher low above 1.18 and has now broken above the 1.22 resistance.
✨ If it can hold above this level, we could see an upward move toward 1.26. For bearish confirmation and short positions, a break below 1.18 would be the key trigger.
📅 USDT.D Analysis
USDT Dominance printed a lower high compared to 4.62 and is now sitting on support at 4.49. A break below this level could push the dominance down to 4.38.
🎲 To confirm a bullish reversal in USDT.D, we would need to see a break above 4.62.
❌ Disclaimer ❌
Trading futures is highly risky and dangerous. If you're not an expert, these triggers may not be suitable for you. You should first learn risk and capital management. You can also use the educational content from this channel.
Finally, these triggers reflect my personal opinions on price action, and the market may move completely against this analysis. So, do your own research before opening any position.
TradeCityPro | AVAX: Watching Key Resistance in RWA Uptrend👋 Welcome to TradeCity Pro!
In this analysis, I’ll be reviewing the AVAX coin — one of the popular RWA projects in crypto with a high market cap.
🔍 This coin currently has a market cap of $9.94 billion and ranks 14th on CoinMarketCap.
⏳ 4-Hour Timeframe
As shown on the 4-hour chart, there’s a clear ascending trendline that has been tested several times. There was also a fake breakout below the trendline, and now price is reacting to it once again.
⚡️ A resistance level has formed at 23.90, which the price has reacted to. Given the recent bounce off the trendline, the probability of breaking 23.90 has increased.
✔️ A break above 23.90 offers a potential long entry, though this isn’t the main long trigger. The target for this move would be 25.78. The main long position should be considered after a breakout above 25.78.
💥 The 25.78 zone is a key resistance level that marked the top of previous bullish legs, so breaking it could lead to a strong bullish trend.
🔽 On the flip side, if the price prints a lower high below 25.78 and moves back toward the trendline, the probability of breaking the trendline increases.
✨ If the trendline breaks, the confirmation trigger would be 22.10. A break below 22.10 opens a short setup, with the next support level located at 19.23.
📊 Currently, market volume is favoring the buyers. With renewed buying volume off the trendline, if this momentum continues, the bullish scenario becomes more likely.
📝 Final Thoughts
This analysis reflects our opinions and is not financial advice.
Share your thoughts in the comments, and don’t forget to share this analysis with your friends! ❤️

TradeCityPro | ADAUSDT Is It Time to Buy Cardano?👋 Welcome to TradeCityPro Channel!
Let’s dive in and analyze one of the market’s favorite coins, Cardano (ADA), which is in a strong position compared to most altcoins and is holding at higher resistance levels.
🌐 Overview Bitcoin
Before starting the analysis, I want to remind you again that we moved the Bitcoin analysis section from the analysis section to a separate analysis at your request, so that we can discuss the status of Bitcoin in more detail every day and analyze its charts and dominances together.
This is the general analysis of Bitcoin dominance, which we promised you in the analysis to analyze separately and analyze it for you in longer time frames.
Bitcoin Chart
📊 Weekly Timeframe
On the weekly time frame, ADA, like SOL, SUI, XRP, and most of the top ten coins in the market, is still in a better situation, with the price fluctuating at higher levels.
After being rejected at 1.1983 and losing support at 0.7959, we experienced a sharp drop to 0.50, driven by panic in the market due to Trump and U.S. tariffs on other countries.
Currently, in the weekly time frame, we’re still at higher levels compared to most of the market, and we can expect a strong move going forward. It’s worth noting that breaking 1.1988 will provide the best trigger for a buy.
📈 Daily Timeframe
Interesting things are happening on the daily time frame, and we’re clearly still at higher levels than other altcoins. If the market itself undergoes a trend change, we can be ready for a long trigger sooner.
After breaking 0.8204 and losing the 0.236 Fibonacci level, we experienced a sharp decline that also saw high volume. I expected that after this volume, we’d transition from volatility to forming a range box, and that’s exactly what’s happening. We’re forming a box between 0.6777 and 0.8204, but if today’s daily candle closes as it is, the downtrend will continue!
Additionally, after this event, we had a break of the support floor that turned out to be a fakeout, leading us to establish a new support level. Currently, our most important support is 0.6090, and we’re moving along a daily trendline. If we bounce from this trendline and break the 0.8419 resistance, it will be the best trigger for a buy. On the other hand, if the support breaks and we lose the 0.7417 low, we can go for a short position.
📝 Final Thoughts
Stay calm, trade wisely, and let's capture the market's best opportunities!
This analysis reflects our opinions and is not financial advice.
Share your thoughts in the comments, and don’t forget to share this analysis with your friends! ❤️

TradeCityPro | Bitcoin Daily Analysis #102👋 Welcome to TradeCity Pro!
Let’s dive into Bitcoin and key crypto indices. As usual, in this analysis I’ll walk you through the triggers for the New York futures session.
⏳ 1-Hour Timeframe
As you can see in the 1-hour timeframe, yesterday we saw a bullish move that pushed the price up to and beyond the 109229 level.
🔍 In the previous analysis, I mentioned that if the price finds support before reaching 106192 and breaks above 109229, we could draw a support zone between the recent low and 106192. That’s exactly what happened — I’ve now marked the support range between 106192 and 107010.
💥 This is a critical support area, and if price revisits it later, it could act as a strong support. For now, the price is moving upward, and after breaking 109229, the next resistance is at 111747.
✔️ If you didn’t open a long position on yesterday’s trigger, you’ll need to wait for the break of 111747. If you already have an open position, you can hold it for now, as Bitcoin’s long-term trend is bullish and the move may continue.
📊 If buying volume increases and RSI breaks above 70 and enters the Overbought zone, bullish momentum will strengthen significantly, and the chances of breaking 111747 will increase.
📉 As for short positions or trend reversal — it's better not to consider them yet, as long as the price remains above the support zone. The uptrend is strong and offers better setups.
👑 BTC.D Analysis
Bitcoin dominance is still oscillating below the 64.32 level and hasn’t broken it yet. A local low has formed around 64.18.
🔔 A break above 64.32 would confirm the start of the next bullish leg in dominance. Conversely, breaking 64.18 could lead to a deeper correction toward 63.97 or even 63.50.
📅 Total2 Analysis
Yesterday, the descending trendline I highlighted was broken, and price moved up to 1.22.
✨ Breaking 1.22 would confirm the start of a larger bullish leg toward 1.26. If Total2 declines instead, we could enter on a break below 1.118.
📅 USDT.D Analysis
Yesterday, Tether dominance was rejected from the 4.62 resistance and also broke through 4.51.
🎲 If price moves toward 4.38 again, the probability of breaking this level will rise significantly — especially since a lower high has formed at 4.72, indicating that bearish momentum could be entering the market.
❌ Disclaimer ❌
Trading futures is highly risky and dangerous. If you're not an expert, these triggers may not be suitable for you. You should first learn risk and capital management. You can also use the educational content from this channel.
Finally, these triggers reflect my personal opinions on price action, and the market may move completely against this analysis. So, do your own research before opening any position.

TradeCityPro | Deep Search: In-Depth Of Arbitrum👋 Welcome to TradeCity Pro!
Today we have a deep research analysis on the Arbitrum project, and in this review, I’ll fully break down the project for you. First, let’s take a look at the project’s information, and then we’ll analyze the ARB coin from a technical perspective.
🌉 What is Arbitrum?
Arbitrum is a Layer 2 scaling solution for Ethereum that leverages Optimistic Rollups to enhance the network’s speed, scalability, and cost-efficiency. By offloading the majority of computation and data storage to off-chain processes, Arbitrum significantly reduces transaction fees while increasing throughput — all without compromising Ethereum’s security and full compatibility.
The network’s native token, ARB, plays a central role in governance. With the launch of the decentralized organization Arbitrum DAO, holders of ARB can participate in critical decision-making related to protocol upgrades, treasury allocations, and electing members of the Security Council.
🛠 Development and Roadmap
Arbitrum is developed by the U.S.-based company Offchain Labs. The 2023 roadmap introduced several key developments:
The launch of Orbit, a Layer 3 framework
Stylus integration, allowing smart contracts to be written in Rust, C++, and other popular languages
Increased inclusion of institutional validators
Enhanced decentralization of Arbitrum One
On March 16, 2023, Arbitrum announced that 12.75% of its total ARB token supply would be distributed via airdrop to early users and DAOs in its ecosystem. The token generation event (TGE) was executed on March 23, 2023.
👥 Founders of Arbitrum
Arbitrum was founded by three computer scientists from Princeton University:
Ed Felten, Professor at Princeton and former U.S. Deputy CTO under President Obama — Co-founder and Chief Scientist
Steven Goldfeder, Ph.D. in Computer Science — CEO
Harry Kalodner, Ph.D. candidate — CTO
In 2021, Offchain Labs raised $120 million in a Series B funding round led by Lightspeed Venture Partners, resulting in a $1.2 billion valuation. Other participants included Polychain Capital, Pantera Capital, and Mark Cuban.
🧬 What Makes Arbitrum Unique?
Arbitrum sets itself apart through its implementation of Optimistic Rollups, delivering several distinct advantages:
Full EVM Compatibility: Ethereum apps can run on Arbitrum without code changes
High Throughput: Capable of processing thousands of transactions per second with low fees
Developer Flexibility: Stylus allows for smart contract development in Rust, C++, and more
True Decentralization: Transactions are validated by a distributed set of validators, without relying on centralized sequencers
Arbitrum supports a dynamic ecosystem that includes projects like GMX, Treasure (MAGIC), Camelot (GRAIL), Radiant Capital (RDNT), Vela Exchange, ZyberSwap, Dopex, PlutusDAO, and Jones DAO.
As of the latest data from DeFiLlama, Arbitrum reached a peak TVL of $3.2 billion in November 2021 and currently maintains around $1.85 billion, making it the largest Layer 2 network by total value locked.
💸 Token Supply and Allocation
The ARB token has a total fixed supply of 10 billion. It is not used for gas payments — transactions are settled in ETH or other supported ERC-20 tokens — but serves solely as a governance asset.
The distribution breakdown is as follows:
DAO Treasury: 42.78%
Offchain Labs team and advisors: 26.94%
Investors: 17.53%
Airdrop to users: 11.62%
Airdrop to DAOs: 1.13%
ARB holders participate in governance over both Arbitrum One and Nova, voting on upgrades, resource allocation, feature integration, and treasury decisions.
🛡 Network Security
Arbitrum’s security is anchored in Ethereum. Transactions are executed off-chain and posted in batches to Ethereum’s mainnet via Optimistic Rollups. These batches are assumed valid unless contested during a designated fraud-proof window, during which challengers can submit cryptographic evidence of invalidity.
💱 Where to Buy ARB
ARB is available across a wide range of trading platforms, including:
Centralized exchanges: Binance, Coinbase, KuCoin, Bybit, Kraken, and Bitfinex
Decentralized exchanges: Uniswap V3 (Ethereum & Arbitrum) and SushiSwap (Arbitrum)
Fundraising and Token Vesting
Since its inception in 2019, Offchain Labs has completed three major fundraising rounds totaling over $143 million.
The Seed round raised $3.7 million from Pantera Capital and Compound VC. In April 2021, the company secured $20 million in a Series A round led by Lightspeed and supported by Mark Cuban. The most significant round, Series B, came in August 2021, with $100 million raised and a valuation of $1.2 billion.
Approximately 17.5% of ARB’s total supply was allocated to these investors, subject to a one-year cliff followed by monthly vesting. These funds provided the financial foundation for ecosystem growth, DAO development, and further decentralization.
🔓 Token Unlocks and Vesting Status
As of May 2025, the ARB token distribution is as follows:
Unlocked: 4.278 billion ARB (42.74%)
Locked: 2.378 billion ARB (23.72%)
Untracked: 3.356 billion ARB (33.54%)
Market Cap of Unlocked Tokens: ~$1.708 billion
The majority of remaining tokens will unlock monthly until March 2027. Most of these allocations pertain to the team, advisors, and early investors.
Current token distribution by role:
Team, future members, and advisors: 40.53%
Investors: 26.38%
DAO Treasury: 13.91%
Arbitrum ecosystem DAOs: 1.70%
Individual wallets: 17.48%
On-Chain Activity – May 2025 Snapshot
According to DeFiLlama’s latest figures, Arbitrum remains one of the most active and liquid Layer 2 environments. Key indicators include:
TVL: $2.63 billion
Stablecoin market cap: $2.76 billion
Bridge-in value: $14.02 billion
Treasury balance: $21.26 million
24h active addresses: 286,467
24h network fees: $33,415
24h protocol revenue: $33,032
24h dApp revenue: $92,966
24h DEX volume: $513 million
24h derivatives volume: $299 million
24h capital inflow: $163.4 million
ARB price: ~$0.40
Circulating market cap: ~$1.92 billion
Fully diluted valuation (FDV): ~$3.96 billion
Revenue Performance
Arbitrum has maintained a steady and upward revenue trend throughout the past year. On average, the network generates around $2.7 million per month in protocol revenue — primarily from transaction fees. dApps on the network contribute substantially as well, especially through DEXs, derivatives, and lending platforms.
With daily protocol revenue averaging $30,000–$35,000, the data reflects ongoing, high-frequency use by both end-users and developers. This recurring income stream enhances the network’s long-term sustainability.
🎁 The ARB Airdrop
On March 16, 2023, Offchain Labs announced the ARB airdrop as a core component of decentralizing network governance through the creation of the Arbitrum DAO.
A total of 12.75% of ARB supply was distributed:
11.62% to early users
1.13% to DAOs contributing to the Arbitrum ecosystem
Eligibility was determined via a point-based system that rewarded meaningful engagement — such as using Arbitrum bridges, interacting with dApps, and providing liquidity. The eligibility cutoff date was March 1, 2023.
The token generation event took place on March 23, 2023, with ARB going live on major exchanges the same day. Unlike ETH, ARB does not serve as gas; instead, it is used solely for governance.
✅ Conclusion
Over the past two years, Arbitrum has become one of the most essential infrastructure layers in Ethereum’s Layer 2 ecosystem. Leveraging Optimistic Rollup technology, it has successfully delivered scalability, speed, and cost-efficiency to both users and developers. From a tokenomics perspective, the total supply of ARB is capped at 10 billion, of which over 4.2 billion have already been unlocked. Approximately 2.3 billion tokens remain locked under a structured vesting program set to continue through 2027. A significant portion of these tokens is allocated to the core team, advisors, and early investors.
On-chain data further supports Arbitrum’s leading position: with over $2.6 billion in total value locked (TVL), more than $2.7 billion in stablecoin market cap, and over $14 billion bridged into the network, it has firmly established itself among the most robust Layer 2 platforms. This is backed by more than 280,000 active daily addresses and substantial volumes in both decentralized exchanges and derivatives markets.
Economically, Arbitrum generates an average daily protocol revenue of $30,000 to $35,000, while dApps on the network collectively bring in over $90,000 daily. On a monthly basis, network revenue exceeds $2.7 million — ranking Arbitrum second only to Base among Layer 2 networks in revenue generation.
In summary, Arbitrum stands strong not only in its technical foundation but also in its economic sustainability. With a stable revenue cycle, progressive token unlocks, and consistent user engagement, the network is well-positioned to expand its ecosystem, strengthen DAO governance, and reinforce its competitive edge in the evolving Layer 2 landscape.
Now that we’ve reviewed the project, let’s go to the chart and analyze it technically.
📅 Weekly Timeframe
As you can see in the weekly timeframe, after the token was listed in mid-2023, and following a correction, the price made a bullish move up to a high of 2.0997. After that, ARB entered a downtrend.
There was a very important support level at 0.8038, which was the most critical support for ARB, but during the sell-off, this level was broken. The price formed a new low at 0.4844, then made a pullback to 1.2115 before continuing its decline and reaching a new low at 0.2618.
The RSI oscillator during this downtrend remained below the 50 zone, except for when price pulled back to 1.2115 — indicating that the overall momentum has been bearish. For a trend reversal and bullish confirmation, if the RSI makes a higher high and higher low above the 50 level, we can take that as a momentum confirmation.
As for price confirmation, the 0.4844 zone is a good reference — the price is currently interacting with this level and ranging just below it. If this level is broken and price consolidates above it while forming a higher high and higher low, we will get confirmation of a trend reversal.
This can also be used as a trigger for spot buying. However, it’s better to wait for Bitcoin dominance to turn bearish and then look for a trigger on this chart.
📅 Daily Timeframe
In the daily timeframe, we can better observe the price movements. As shown, after rebounding from the 0.2618 bottom, price formed a higher low and higher high, and is currently building a base at the 0.3747 level after reaching the 0.4844 resistance.
For long positions or spot buying, given that the trend has turned bullish in the daily timeframe, we can enter if price reacts positively to the 0.3747 support. The main trigger remains the breakout of 0.4844.
RSI has been able to stabilize above the 50 level during this cycle. If this continues and RSI stays above 50, the likelihood of a sustained bullish trend significantly increases.
The main confirmation of ARB’s bullish reversal will come from breaking 0.4844. But if the price fails to break this level and instead prints a lower high, we could consider a short position with a break of 0.3747.
The key support level for ARB is 0.2618. For the broader trend to return to bearish, this level must be broken. If that happens, we’ll likely see some very sharp downward moves.
❌ Disclaimer ❌
Trading futures is highly risky and dangerous. If you're not an expert, these triggers may not be suitable for you. You should first learn risk and capital management. You can also use the educational content from this channel.
Finally, these triggers reflect my personal opinions on price action, and the market may move completely against this analysis. So, do your own research before opening any position.

TradeCityPro | Bitcoin Daily Analysis #101👋 Welcome to TradeCity Pro!
Let’s dive into the analysis of Bitcoin and key crypto indices. As usual, I’ll go over the futures session triggers for the New York market.
⏳ 1-Hour Timeframe
As you can see on the 1-hour chart, after Bitcoin reached the top at 111,747, the market entered a corrective phase and BTC has pulled back to around 106,192.
🔍 For now, I’m not adjusting the 106,192 level because it remains a very strong support zone. If the price reaches this level and shows a solid reaction, we can look for entry triggers on lower timeframes.
💥 Currently, the trigger for a long position is at 109,229. This level previously caused the price to make a lower low, so breaking it could inject strong bullish momentum into the market.
📈 The main long trigger is at 111,747. However, this level is a strong supply zone and won’t be easy to break, so trading this level will be challenging.
📊 On the bearish side, we’re watching the RSI oscillator for a potential entry into the oversold zone. If RSI enters oversold territory, strong bearish momentum may follow and increase the chance of breaking below 106,192.
👑 BTC.D Analysis
After a retracement to the 63.50 level, BTC dominance has initiated a new bullish leg, reaching up to 64.32.
⭐ If 64.32 is broken, it confirms further upside toward 64.63. Conversely, if 63.97 breaks, we get confirmation of bearish momentum returning.
📅 Total2 Analysis
Total2 is currently forming a descending triangle after being rejected from 1.26T. Price is hovering around the 1.18T support.
⚡️ If 1.18T breaks, we could see a drop toward 1.15T. For a bullish breakout, we need to see a break of the trendline and activation of the 1.22T trigger.
📅 USDT.D Analysis
USDT.D is currently trading below 4.62. A break below this level would confirm further downside.
🎲 A break of 4.51 would further confirm a bearish trend in USDT dominance, signaling strength across crypto markets.
❌ Disclaimer ❌
Trading futures is highly risky and dangerous. If you're not an expert, these triggers may not be suitable for you. You should first learn risk and capital management. You can also use the educational content from this channel.
Finally, these triggers reflect my personal opinions on price action, and the market may move completely against this analysis. So, do your own research before opening any position.

TradeCityPro | HNT: Testing Resistance in DePIN Uptrend Structur👋 Welcome to TradeCity Pro!
In this analysis, I’ll review the HNT coin. The Helium project is a U.S.-based Web3 and DePIN initiative.
✔️ This coin has a market cap of $9.26 million and is ranked 97th on CoinMarketCap.
⏳ 4-Hour Timeframe
On the 4-hour chart, HNT has an ascending trendline with a resistance zone near 4.372.
💥 If this resistance is broken, the main upward move may begin, and a breakout above this level confirms a bullish trend for HNT.
📈 So for a long position, you can enter on the breakout or a pullback to this zone. The next resistance level is 5.333.
🔽 For a bearish scenario, the ascending trendline must be broken first to signal a potential reversal. A break below 3.971 would be the first confirmation of that trendline break and can be used as a short trigger.
⚡️ The main short trigger would be a break of 3.642, which could push the price down toward 3.245.
🧩 The RSI oscillator is currently sitting on the 42.91 support; a breakdown here would confirm bearish momentum for a short setup.
📝 Final Thoughts
This analysis reflects our opinions and is not financial advice.
Share your thoughts in the comments, and don’t forget to share this analysis with your friends! ❤️

TradeCityPro | CFXUSDT A Wild Week of Volatility Ahead?👋 Welcome to TradeCityPro Channel!
Let’s dive in and analyze another altcoin in the market, CFX, which is likely to experience a highly volatile week ahead, offering great trading opportunities.
🌐 Overview Bitcoin
Before starting the analysis, I want to remind you again that we moved the Bitcoin analysis section from the analysis section to a separate analysis at your request, so that we can discuss the status of Bitcoin in more detail every day and analyze its charts and dominances together.
This is the general analysis of Bitcoin dominance, which we promised you in the analysis to analyze separately and analyze it for you in longer time frames.
🕒 Weekly Time Frame
CFX stands out as an older coin with prior bull-run experience. It’s trading above last year’s lows and hasn’t experienced steep declines.
Yesterday, we analyzed this coin briefly, but today, we’ll go into more detail. Unlike most altcoins that began their bullish moves from their lowest levels, CFX has already started its upward trajectory from 0.1219.
Fibonacci analysis shows that 0.1219 aligns with the 50% retracement level—a significant support both in Fibonacci terms and Dow Theory. After forming a range around this level and breaking the 0.1810 trigger, the coin moved toward its first target at 0.2596.
However, we were rejected at 0.2596 and even lost the critical support at 0.1087, dropping to the next support at 0.0647. Currently, it appears we’re pulling back to the key 0.1087 level.
📊 Daily Time Frame
On the daily chart, CFX was in a ranging box, forming higher lows. A breakout above 0.1851 was accompanied by a strong entry candle with buyer momentum, an RSI entry signal, and volume confirmation. Stop-loss was set at the daily low of 0.14.
If you followed this trigger, you’re likely in profit despite the current red daily candle. This correction is healthy, as an uptrend without pullbacks or red candles is often unsustainable.
After breaking the daily box between 0.1046 and 0.1230 and losing its support with an engulfing candle, we experienced a downward move to 0.0647. From there, sellers effectively exited the market, and buyers showed strength. After breaking 0.0823, we formed higher highs and lows. Now, after breaking 0.1046, we can consider buying for spot, with the main trigger being a break of 0.1230.
✍️ Final Thoughts
Stay level headed, trade with precision, and let’s capitalize on the market’s top opportunities!
This is our analysis, not financial advice always do your own research.
What do you think? Share your ideas below and pass this along to friends! ❤️

TradeCityPro | Bitcoin Daily Analysis #100👋 Welcome to the 100th Bitcoin Analysis!
I'm really happy we've shared this 100-day journey together, and I hope you've been able to benefit from these analyses along the way.
💥 Every single analysis I've posted so far has been the basis for real trades that I've taken myself. I'm glad to say the overall result of those trades has been profitable, and I hope your results have been positive too.
⚡️ Today, I want to do a full multi-timeframe breakdown of Bitcoin and other major crypto indices. Let’s dive in and see where the market stands.
💰 Bitcoin Analysis
📅 Weekly Timeframe
As you can see, in the weekly chart, Bitcoin reacted to an ascending curved trendline during its recent correction phase and retraced up to around 72,147.
💫 On the RSI, we also have a key support level at 44.75, which has held again. The combination of this support with the curved trendline has created a potential PRZ (Potential Reversal Zone), and price has since resumed its upward move.
✔️ Last week’s candle managed to close above the resistance at 104,919 for the first time ever. Many in the market expected that a weekly close above this level would trigger a sharp rally toward 130,000 or even 160,000.
📊 However, that hasn’t happened—this week’s candle is still small and lacks strong bullish momentum.
✨ We can now view the range between 104,919 and 108,454 as a resistance zone. Although the price has entered this zone, we haven’t yet confirmed a breakout. That confirmation would come with a weekly close above 108,454.
📈 Despite the strong momentum before breaking ATH, price seems to be losing steam now. That’s not necessarily bad—it’s actually expected, since this area is one of the most important supply zones for Bitcoin and won’t break easily.
🔽 If price gets rejected and this move turns out to be a fakeout, there’s a real possibility of a trend reversal. We’ve got a potential double top forming, which is usually the first signal of a reversal. If price then breaks the 72,147 support, it would confirm the end of the current uptrend. A lower high and lower low afterward would confirm a new downtrend.
⭐ At this point, I can’t give you a new spot-buy trigger in this timeframe. The trigger was around the curved trendline. Since price has moved away, we need to wait for a new setup to form.
Let’s check lower timeframes for more detailed price action.
📅 Daily Timeframe
In the daily chart, after getting support at 76,087, price started moving up and with the breakouts of 87,700 and 91,953, the bullish phase began.
🔍 Currently, price is holding above 106,250 with increasing volume since the 91,953 breakout. Everything looks ready for Bitcoin to begin its main move and enter an extension leg up.
🚀 If this happens, price could target 129,000 and even 150,000. RSI will be key for confirmation—if it re-enters Overbought territory and holds above 77.81, higher targets become more likely.
🛒 The previous spot-buy triggers I gave were at 87,700 and 91,900. If you entered with those, I recommend holding for now and waiting for signs of a trend change before taking profits.
🔔 If you didn’t buy earlier, I can’t provide a new entry just yet—we need to wait for a new structure and trigger to form.
🔽 For now, I still see the trend as bullish. A bearish scenario would require a fakeout below 106,250—if price drops and forms a lower high and lower low, the uptrend would be over and a downtrend would begin.
⏳ 4-Hour Timeframe
After breaking 106,250, price rallied to 111,826 and is now pulling back to 106,250.
✔️ RSI is holding above its local support at 44.48, and as long as it stays above that level, market momentum remains bullish.
📈 You can consider entering a long on a pullback to 106,250. A breakout above 111,826 would be the main trigger for a new long.
🔑 Right now, there’s no valid reason to short, so it’s best to wait for a clear bearish structure before considering that.
👑 Bitcoin Dominance (BTC.D)
📅 Weekly Timeframe
After several green weekly candles, BTC.D printed a large red candle, pulling back toward the midline of its ascending channel and rejecting from 64.77. However, it’s now moving back up again.
💥 With this strong momentum, there’s a good chance BTC.D could break out of the channel. If 64.77 breaks, we could see a push toward 71.04.
⚡️ To confirm a bearish reversal in BTC.D, we’d need to see a breakdown below the lower trendline of the channel. That would likely signal the start of an altseason.
📅 Daily Timeframe
BTC.D has been in an uptrend and even broke above its channel briefly. But after hitting 65.31, it started a correction and dropped to the midline at 62.22.
🎲 It quickly bounced from 62.22 and is now moving upward again. Given the bullish structure, it could retest the 65.31 high.
📈 If it forms a lower high and breaks below 62.22, that would confirm a trend reversal. A breakout above 65.31 would confirm continuation of the uptrend.
⏳ 4-Hour Timeframe
BTC.D rallied to 64.31 and is now trying to retest that level. If it breaks above 64.31, the next target is 65.41.
🧲 If it forms a lower high and breaks 63.51, we’d get a confirmation that the bullish leg has ended, increasing the chances of a move to 62.17.
✔️ Total2 (Altcoin Market Cap Excluding BTC)
📅 Weekly Timeframe
After breaking the curved trendline, Total2 fell to around 816B before bouncing alongside Bitcoin.
⚡️ Currently, it’s ranging between 1.15T and 1.26T for the past three weeks.
🧩 If price breaks this range, it could rally toward 1.61T, which is the most important supply zone for Total2. A breakout here would likely trigger a strong altcoin rally.
🛒 If that breakout coincides with a drop in BTC.D, it would be an excellent spot-buy opportunity for altcoins.
📊 If the current rally fails to reach 1.61T and forms a lower high, another drop toward 816B is likely. This time, the chance of breaking that support would be high—confirming a trend reversal.
📅 Daily Timeframe
Price is stuck in a range between 1.15T and 1.26T.
🔼 A breakout from either side would likely lead to a strong move. A break below 1.15T could extend the decline toward 861B, while a break above 1.26T would target 1.62T.
⏳ 4-Hour Timeframe
Same structure as the daily chart. Long trigger = 1.26T breakout. Short trigger = 1.15T breakdown.
🔑 If price forms a higher low and starts moving back up, the likelihood of breaking 1.26T increases. The next target would be 1.33T.
✔️ USDT Dominance (USDT.D)
📅 Weekly Timeframe
USDT.D is ranging between 3.78 and 6.22.
📉 It recently formed a lower high below 6.22 and broke below 5.06, now heading toward 3.78.
🤔 If USDT.D drops to 3.78, we could see a major market rally—Bitcoin might move toward 130,000 or 160,000.
🚀 If 3.78 breaks, the next support is at 2.53, which would mark the start of a major bull run.
📅 Daily Timeframe
USDT.D has hit support at 4.40 and is now approaching a descending trendline that’s been holding since the 6.22 top.
📈 If that trendline breaks, the trigger is at 4.70. A breakout here could lead to a move to 5.02.
🔽 If price gets rejected again, the short trigger is at 4.40, and the next support is at 3.81.
⏳ 4-Hour Timeframe
Support at 4.38 has held, and price is now above 4.50 and approaching the trendline.
🎲 If 4.50 fails and price drops to 4.40, a break below 4.40 confirms a bearish continuation.
📊 If the trendline breaks, use 4.74 as your confirmation trigger.
❌ Disclaimer ❌
Trading futures is highly risky and dangerous. If you're not an expert, these triggers may not be suitable for you. You should first learn risk and capital management. You can also use the educational content from this channel.
Finally, these triggers reflect my personal opinions on price action, and the market may move completely against this analysis. So, do your own research before opening any position.

TradeCityPro | CORE: Watching Trendline and RSI for Next Move👋 Welcome to TradeCity Pro!
In this analysis, I’ll be reviewing the CORE token. This project is one of the DeFi infrastructure developers for Bitcoin and also runs its own Layer 1 blockchain.
💥 The token currently holds a market cap of $826 million and is ranked 86th on CoinMarketCap.
⏳ 4-Hour Timeframe
As seen on the 4-hour chart, CORE is in an uptrend supported by an ascending trendline, with price consistently moving higher along it.
✅ In the last bullish leg, price only managed to retest the previous high around 0.8727 and is now undergoing a pullback.
⚡️ This shows signs of weakness in the bullish momentum. If the price fails to close above 0.8727 and drops back to the trendline, the risk of a trendline breakdown increases.
🔍 There’s also the potential for price to form equal highs and higher lows, forming an ascending triangle, which would favor a bullish breakout scenario.
🔑 Watch the RSI oscillator closely. Historically, every time RSI reached the 70 zone during a bullish move, the trend topped out and reversed. So if RSI manages to break above 70 this time, it could trigger a much stronger bullish leg.
📈 For a long position, potential entries include a breakout above 0.8727 or a bullish bounce off the ascending trendline.
🔽 For a short position, the first trigger would be a break of the trendline and activation of the 0.7560 support zone.
📝 Final Thoughts
This analysis reflects our opinions and is not financial advice.
Share your thoughts in the comments, and don’t forget to share this analysis with your friends! ❤️

TradeCityPro | Bitcoin Daily Analysis #99👋 Welcome to TradeCity Pro!
Let’s go over the Bitcoin and major crypto index analysis. As usual, I’ll cover the key futures session triggers for New York.
⏳ 1-Hour Timeframe
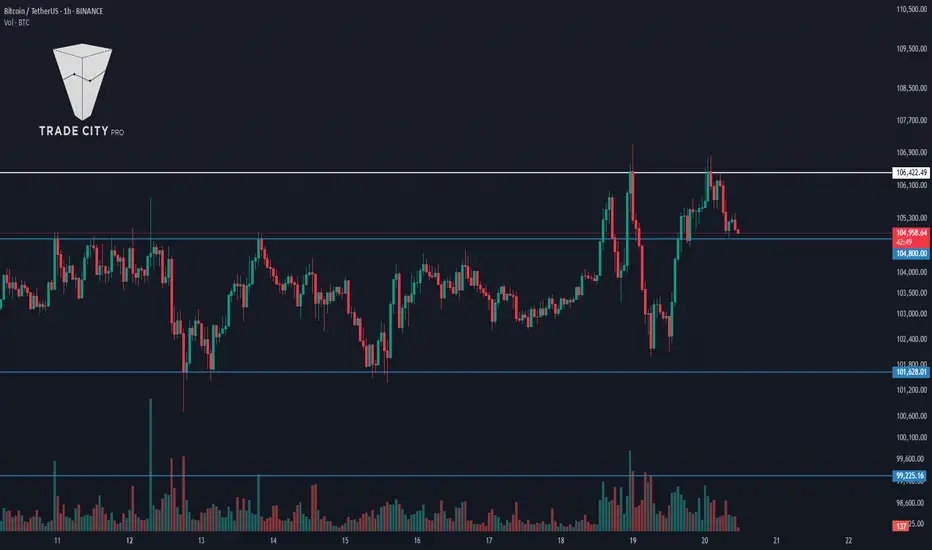
As you can see on the 1-hour chart, Bitcoin is still trading below the 111817 level and has formed a support at 110455 after multiple rejections from that resistance.
✔️ If this 110455 level breaks, we could see a deeper pullback toward 109195, and potentially even down to 106422.
✨ The RSI oscillator is currently sitting at the 50 support level again. If RSI breaks below 50, it would indicate a weakening bullish momentum and increase the likelihood of a bearish scenario.
💥 However, if RSI holds above 50, it would confirm that buyers are still in control, and the probability of the uptrend continuing increases.
⚡️ The 111817 level remains a very clean and strong trigger for a long position. If price breaks this level, the market could make another leg up.
📊 Make sure to watch the volume closely. If buy volume starts to increase, a breakout above 111817 could offer a strong entry for those not already in a position.
👑 BTC.D Analysis
Bitcoin dominance broke below 63.76 yesterday, which helped altcoins rally, but it has since recovered and moved back above that level.
📈 For now, dominance is ranging between 63.76 and 64.30. A breakout from either side would confirm the direction of the next move.
📅 Total2 Analysis
Total2 was rejected from the 1.26 resistance and has now fallen below 1.23. If this downward move continues, the next support levels are at 1.18 and 1.15.
🔑 If price finds support here and moves back up to retest 1.26, a breakout from that level would be a fresh long trigger.
📅 USDT.D Analysis
Tether dominance found support at 4.38 and is now moving upward.
🧩 As long as it remains below 4.51, the overall market momentum is still considered bullish. But if it manages to stabilize above 4.51, the likelihood of a broader market correction increases.
❌ Disclaimer ❌
Trading futures is highly risky and dangerous. If you're not an expert, these triggers may not be suitable for you. You should first learn risk and capital management. You can also use the educational content from this channel.
Finally, these triggers reflect my personal opinions on price action, and the market may move completely against this analysis. So, do your own research before opening any position.

TradeCityPro | Bitcoin Daily Analysis #98👋 Welcome to TradeCity Pro!
Let’s dive into the Bitcoin and major crypto indices analysis. As usual, I’ll walk you through the New York futures session triggers.
⏳ 1-Hour Timeframe
As you can see, the price has finally broken above the 106422 resistance, and after some pullbacks to that level, it continued its bullish move up to 111817. It is now consolidating just below this level.
💥 The RSI oscillator is clearly reflecting price movements. Each time it reaches the Overbought zone, it gets rejected, leading to a price correction. These RSI corrections typically reach the 50 level, which has been acting as a bottom signal.
📈 For today’s long position, if RSI can stabilize above Overbought and a higher low forms above the 50 line, you can enter on a breakout of 111817. This would be a momentum-based trigger.
✨ The reason I’m emphasizing RSI today is that all the primary price-based triggers we’ve talked about—like 106422, 104800, and even levels down near 85000—have already been activated. So, if you’re not already in a position, you’ll need to rely on momentum indicators.
🧩 Another momentum trigger is a pullback to the SMA25 followed by a confirmation candle. However, I still believe breaking above 111817 is the stronger signal.
📊 As for short positions, I think by now it’s clear why I’m not recommending any. My strategy focuses on trading with the trend, and that keeps me from opening unnecessary trades. Like in recent weeks, we’ll wait for a trend reversal before considering shorts.
👑 BTC.D Analysis
Bitcoin dominance has been rising alongside price, hitting the 64.30 resistance. If Bitcoin consolidates or corrects slightly, BTC.D could break below 63.76, signaling a potential altcoin rally.
✔️ The 63.76 level is a key trigger—breaking it confirms continuation of BTC.D’s downtrend. On the flip side, a break above 64.30 would resume BTC.D’s long-term uptrend.
📅 Total2 Analysis
Total2 has resumed its upward move, and after breaking 1.23, it’s heading toward 1.26.
🔼 If BTC.D starts dropping, breaking 1.26 will be a strong long trigger for altcoins.
📅 USDT.D Analysis
Tether dominance has dropped sharply in sync with market gains. After losing the critical 4.51 support, it’s now heading toward 4.37.
⚡️ There’s still some space left before reaching that level. But if 4.37 breaks, it would be another strong long trigger for altcoins.
❌ Disclaimer ❌
Trading futures is highly risky and dangerous. If you're not an expert, these triggers may not be suitable for you. You should first learn risk and capital management. You can also use the educational content from this channel.
Finally, these triggers reflect my personal opinions on price action, and the market may move completely against this analysis. So, do your own research before opening any position.

TradeCityPro | BCHUSDT Bitcoin Fork Ready to Hit New Highs?👋 Welcome to TradeCityPro Channel!
Let’s dive in and analyze the Bitcoin fork, BCH, to understand why this altcoin is performing much better than the broader market and is being supported at higher levels.
🌐 Overview Bitcoin
Before starting the analysis, I want to remind you again that we moved the Bitcoin analysis section from the analysis section to a separate analysis at your request, so that we can discuss the status of Bitcoin in more detail every day and analyze its charts and dominances together.
This is the general analysis of Bitcoin dominance, which we promised you in the analysis to analyze separately and analyze it for you in longer time frames.
📊 Weekly Time Frame
In the weekly time frame, we see that BCH is in a much better position compared to other altcoins and continues to form higher highs and higher lows!
After hitting the 707 resistance and getting rejected, we’ve been ranging in a large box. However, it’s fair to say that buyers have the upper hand in this box because, after touching the critical 268 support, we engulfed the previous three weekly candles and experienced a sharp move up to 424.
Currently, we’re at a critical point: we could either form a lower high relative to the previous resistance or undergo a mid-term correction and re-enter after breaking 424!
📉 Daily Time Frame
In the daily time frame, the situation is similarly favorable, and BCH is continuing its trend with good momentum. The formation of higher highs and higher lows provides a sense of calm to the uptrend.
After the heavy decline in February, it was natural for us to enter a ranging period before forming a new structure. This happened, and after retesting the 268 support, we started forming higher highs and lows, with our first entry at the 345 level.
Currently, after a rejection from 435, we’ve corrected to 386, which was a low-volume move, technically considered a pullback. If we see a supportive candle at this level, it’s a trigger for a buy, and breaking 435 will be the next trigger!
✍️ Final Thoughts
Stay level headed, trade with precision, and let’s capitalize on the market’s top opportunities!
This is our analysis, not financial advice always do your own research.
What do you think? Share your ideas below and pass this along to friends! ❤️

TradeCityPro | Bitcoin Daily Analysis #97👋 Welcome to TradeCity Pro!
Let’s go over the Bitcoin analysis and key crypto indices. As usual, I’ll be reviewing the triggers for the New York futures session.
⏳ 1-Hour Timeframe
As you can see, a Double Bottom pattern activated yesterday, and the price has returned to the 106422 zone.
✔️ We previously had a support at 102882, but since the price wasn’t respecting it consistently, I’ve removed it. If price shows solid support there again, I’ll reintroduce the level.
🔍 Currently, the first trigger for a long position is 106422. This is a highly critical level and represents the main resistance for Bitcoin. If it breaks, there’s a strong chance for a sharp upward move.
✨ The first support in the way is 104800, which isn’t very strong. If a correction occurs, this level is likely to break. The main support remains at 101628.
📈 A break below 101628 would confirm a bearish reversal, and we could even consider opening a short position. The next support below that would be at 99225.
📊 Market volume has significantly increased over the past few days. This spike in volume suggests that a sharp move is likely. Using our trigger levels, we’ll be able to determine whether it’s an upward or downward breakout.
👑 BTC.D Analysis
Bitcoin dominance is still below the 64.04 zone and appears to be consolidating.
💥 The 64.04 level is highly sensitive. A breakout would signal a bullish shift in dominance, while a rejection would suggest the downtrend will resume.
⚡️ We’ll get confirmation of further downside if 63.71 breaks. Below that, the next support levels are at 63.30 and 62.65.
📅 Total2 Analysis
Yesterday, Total2 reacted to the 1.16 support and moved upward to 1.20.
💫 A break above 1.20 today would confirm bullish continuation. A drop below 1.16, however, would confirm the continuation of a broader correction.
📅 USDT.D Analysis
Yesterday, the 4.70 level was faked out, and the chart fell back into the range box.
🎲 I believe the chances of breaking below the range bottom have increased. Key bearish triggers are at 4.57 and 4.51. On the flip side, another break above 4.70 would confirm renewed bullish momentum for USDT dominance.
❌ Disclaimer ❌
Trading futures is highly risky and dangerous. If you're not an expert, these triggers may not be suitable for you. You should first learn risk and capital management. You can also use the educational content from this channel.
Finally, these triggers reflect my personal opinions on price action, and the market may move completely against this analysis. So, do your own research before opening any position.
TradeCityPro | S: Trendline Break Signals Key Support Retest👋 Welcome to TradeCity Pro!
In this analysis, I’m going to review the S coin—one of the Layer 1 coins for the Sonic network.
💥 This coin currently holds a market cap of $1.43 billion and ranks 58th on CoinMarketCap.
⏳ 1-Hour Timeframe
On the 4-hour chart, as you can see, there’s a large range box between the 0.3939 and 0.6147 levels where price has been moving sideways.
🔍 A key support zone also exists between 0.45 and 0.46, which has received strong bullish reactions, pushing the price upward toward the 0.6147 top via a trendline.
✔️ Currently, this trendline has been broken, and a new support level has formed at 0.4888, which has been tested several times.
✨ If this 0.4888 level breaks, a short position targeting the 0.45 zone and 0.3939 becomes viable.
📈 For a long position, the first trigger is the 0.5266 level. A breakout here would confirm support at 0.4888 and open the path toward the 0.6147 resistance.
🎲 The RSI oscillator is hovering near the 50 level. A sustained move above this could increase the likelihood of the bullish scenario playing out.
📝 Final Thoughts
This analysis reflects our opinions and is not financial advice.
Share your thoughts in the comments, and don’t forget to share this analysis with your friends! ❤️

TradeCityPro | INJUSDT Best Position Among Altcoins! 👋 Welcome to TradeCityPro Channel!
Let’s dive in and analyze one of my favorite coins in the cryptocurrency space, INJ, which is showing strong potential. We’ll check the new entry triggers together.
🌐 Overview Bitcoin
Before starting the analysis, I want to remind you again that we moved the Bitcoin analysis section from the analysis section to a separate analysis at your request, so that we can discuss the status of Bitcoin in more detail every day and analyze its charts and dominances together.
This is the general analysis of Bitcoin dominance, which we promised you in the analysis to analyze separately and analyze it for you in longer time frames.
📊 Weekly Time Frame
On the weekly time frame, I see that the seventh period is stable, INJ, and compared to the majority of altcoins that have their own low price levels, it is in a better space and is engaged in its own supports!
After breaking the primary trend ceiling, namely 9.28, we experienced a sharp upward movement and formed a historical ceiling at $53, and after forming a distribution box and breaking the important floor of 16.20 and pulling back to it, we experienced a continued decline.
Currently, we’ve bounced from the key support at 6.54 and experienced a 90% move, which highlights the importance of this resistance. If we form a higher low above 6.54, the 13.54 trigger will be excellent for a spot buy, and I’ll personally add another buy position at that level.
📉 Daily Time Frame
On the daily time frame, our trend is completely bearish as you can see, and the events are completely accompanied by the formation of a downward bottom and top, but we are likely to suffer for a while.
After getting rejected from 34.16 and forming a box between 20.16 and 25.93 and losing the bottom, it made a move and then while pulling back with low volume and the next conversion to red, it became an inverted Sharpe, we experienced a decline!
After breaking the daily trendline and activating its trigger at 8.54, we saw a move and got stuck at the 10.32 resistance. After forming a higher low, we moved up to 13.76. Currently, the 13.76 trigger, and even better, 16.25, can serve as our futures long and spot long triggers, respectively. We’re still holding the position opened at 10.32.
✍️ Final Thoughts
Stay level headed, trade with precision, and let’s capitalize on the market’s top opportunities!
This is our analysis, not financial advice always do your own research.
What do you think? Share your ideas below and pass this along to friends! ❤️

TradeCityPro | Bitcoin Daily Analysis #96👋 Welcome to TradeCity Pro!
Let’s move on to the Bitcoin and major crypto index analysis. As usual, I’m going to review the triggers for the New York futures session.
⏳ 1-Hour Timeframe
As you can see on the 1-hour chart, yesterday we had a bullish move that extended up to the 106247 level.
🔍 However, as I previously mentioned, this is a very sensitive zone for price action, and we might see sharp reactions from it. That’s exactly what happened—price faced a strong rejection after reaching this level and dropped down to 102882.
📊 Market volatility is currently very high, and the risk of getting stopped out in either direction is significant. So we need to be cautious and avoid getting caught in fake moves.
💥 Personally, I recommend avoiding trades right after such volatility and waiting for a new structure to form. But if you’re planning to take a position, keep the risk very low.
⚡️ For a short position, our first trigger is a break below 101628. Alternatively, we could also enter based on how the price reacts to 102882.
📈 For a long position, we currently have no clear setup until price structure forms. The only long triggers I can give for now are the breakouts of 104800 and 106247.
👑 BTC.D Analysis
Bitcoin dominance has started a new uptrend and has even closed above 63.71. Given the healthy structure of this trend, if 64.04 breaks, we can confirm a full bullish breakout for BTC.D.
💫 If BTC dominance continues rising while the market moves up, Bitcoin will likely outperform most altcoins.
📅 Total2 Analysis
Looking at Total2, the 1.17 support broke yesterday, and now this index is set up for further downside correction. For now, it seems the market is in a decision-making phase.
🧲 If we get a lower low and lower high below 1.17, the chance of a move toward 1.1 increases significantly.
📅 USDT.D Analysis
Now for USDT dominance—yesterday it faked out the 4.60 level twice and is currently holding above 4.70, heading toward 4.82.
🧩 If this move turns out to be a fake and price stabilizes below 4.70 again, it would give us a strong signal for a bullish market and a bearish turn for USDT dominance.
❌ Disclaimer ❌
Trading futures is highly risky and dangerous. If you're not an expert, these triggers may not be suitable for you. You should first learn risk and capital management. You can also use the educational content from this channel.
Finally, these triggers reflect my personal opinions on price action, and the market may move completely against this analysis. So, do your own research before opening any position.

TradeCityPro | IOTA: Testing Key Resistance in RWA-DePIN Rally👋 Welcome to TradeCity Pro!
In this analysis, I’m going to review the IOTA coin for you. This project is one of the RWA and DePIN-based initiatives and is among the older projects in this category.
✔️ The coin has a market cap of $822 million and ranks 85th on CoinMarketCap.
📅 Daily Timeframe
As you can see on the daily timeframe, after finding support at 0.1547, the price initiated a bullish leg and moved up to the resistance zone I’ve marked.
💥 This area is a very significant resistance zone, and in this bullish leg, the price has reached it for the first time and got rejected.
🔍 In my view, as long as the price hasn’t confirmed a breakout above 0.1960, the chance of starting a downtrend is higher than continuing the current uptrend. If this resistance zone is broken, we can consider it strong confirmation of buyer strength.
📈 For a long position, we can enter on the breakout of this same zone. For spot buying, this trigger can also be used, but the main long-term triggers are 0.3774 and 0.4918.
⚡️ On the RSI oscillator, there's an important zone at the 50 level. If this level is broken, the probability of breaking 0.1960 increases. If that happens, the next support zone will be 0.1547.
📊 Make sure to pay close attention to volume. If any of our triggers are activated without volume confirmation, the likelihood of a fake breakout increases.
❌ Disclaimer ❌
Trading futures is highly risky and dangerous. If you're not an expert, these triggers may not be suitable for you. You should first learn risk and capital management. You can also use the educational content from this channel.
Finally, these triggers reflect my personal opinions on price action, and the market may move completely against this analysis. So, do your own research before opening any position.

TradeCityPro | Deep Search: In-Depth Of ATOM👋 Welcome to TradeCity Pro!
Today we have a deep research analysis of the ATOM project, and in this report, I’m going to review the project completely. Let’s first go over the project’s fundamentals and then analyze the ATOM chart technically.
🌌 What Is Cosmos?
Cosmos is a blockchain ecosystem designed to solve major challenges in the blockchain industry, such as low speed, high cost, lack of scalability, and the environmental impact of proof-of-work algorithms like Bitcoin. Cosmos enables cross-chain interaction (interoperability) by connecting independent blockchains through a protocol called Inter-Blockchain Communication (IBC).
Cosmos aims to simplify the development of blockchains and decentralized applications (dApps) using a modular framework known as Cosmos SDK, which makes it easier for developers to build blockchain networks.
🛠 How Does Cosmos Work?
The Cosmos network is composed of three main layers:
Application Layer: Handles transaction processing and updates the network state
Networking Layer: Manages communication between blockchains and their transactions
Consensus Layer: Establishes the final state of the blockchain using a consensus algorithm
At the core of this structure is the Tendermint BFT engine, which enables developers to build custom proof-of-stake (PoS) blockchains without coding from scratch.
🔗 Cosmos Hub and Zones
Cosmos Hub was the first blockchain created within the Cosmos network and serves as a central hub for other blockchains—called zones.
These zones are independent blockchains that can interact through Cosmos Hub.
Validators on Cosmos Hub are responsible for maintaining consensus across all zones and are compensated with transaction fees.
The native token of the network, ATOM, is used for transaction fees, governance participation, and staking.
🎯 Key Features of Cosmos
Interoperability: IBC allows blockchains to interact directly
High Scalability: Blockchains run in parallel without overloading a single chain
Ease of Blockchain Development: Cosmos SDK lets developers build customized networks
Decentralized Governance: Users participate in governance by staking ATOM
💡 Interchain Accounts Upgrade
In February 2022, the Interchain Foundation introduced the Interchain Accounts upgrade, allowing blockchains to control accounts on other chains. This enables remote actions like staking, voting, token swapping, and more—without needing full network upgrades.
This significantly enhances interoperability and composability within the IBC ecosystem.
👥 Founders of Cosmos
Jae Kwon
Zarko Milosevic
Ethan Buchman
Cosmos was initially developed by Tendermint Inc. In 2020, Jae Kwon stepped down as CEO and was replaced by Peng Zhong.
🔐 Network Security
Cosmos uses a proof-of-stake consensus algorithm with Byzantine Fault Tolerance (Tendermint BFT):
Validators are selected based on staked ATOM
Malicious behavior results in slashing (loss of tokens)
Rewards are distributed proportionally among validators and their delegators
📍 Where Can You Buy ATOM?
ATOM is available on most major exchanges, including:
Binance
Coinbase
OKX
Kraken
📈 ATOM Token Information
📊 Initial Token Distribution
In 2017, Cosmos raised approximately $16 million through public and private sales. The initial token distribution was as follows:
Public Fundraise:
Share: 44.1%
Unlocked: 35.6%
Block Rewards:
Share: 39.5%
Unlocked: 31.7%
Strategic Investors:
Share: 7.03%
Unlocked: Unknown (likely still locked)
All in Bits, Inc. (Tendermint):
Share: 6.53%
Unlocked: 5.26%
Interchain Foundation:
Share: 6.51%
Unlocked: 5.26%
Seed Investors:
Share: 3.31%
Unlocked: 2.67%
💰 Supply and Inflation
Initial supply: 236,198,958 ATOM
Current supply: ~292 million ATOM
Maximum supply: Unlimited
Inflation rate: Between 7% and 20%, targeting ~2/3 of total supply to be staked
The inflation rate is dynamically adjusted to incentivize staking. If the staking ratio drops below the target, inflation increases, and vice versa.
🔐 Staking and Rewards
Unbonding period: 21 days
Annual reward rate (APR): Between 14% and 20%, depending on network conditions and staking service provider
By staking ATOM, users help secure the network and earn rewards funded through inflation and transaction fees.
🧾 Economic Mechanisms
Burning: If a governance proposal is vetoed, the deposited tokens are burned
Slashing: Validators engaging in malicious or negligent behavior lose part of their staked tokens
🧠 ATOM Tokenomics Models: 1.0 vs 2.0
Recent analysis reveals different impacts of tokenomics models on network sustainability:
ATOM 1.0 with a 10% inflation cap has shown a 10% improvement in token price and treasury health
ATOM 2.0 suffers from stability issues and is often replaced by ATOM 1.0 to maintain network security
Community Treasury in ATOM 1.0: May face depletion within ~24 months due to limited token supply
🔚 Conclusion
Cosmos represents a significant advancement in blockchain infrastructure by addressing some of the core limitations of earlier networks—most notably, interoperability, scalability, and developer accessibility. Through its modular architecture, innovative Tendermint consensus engine, and the IBC protocol, Cosmos has laid the foundation for a truly interconnected web of blockchains.
The network’s native token, ATOM, not only fuels this ecosystem through staking and governance but also underpins its dynamic economic model. While challenges remain—especially around inflation control and treasury sustainability—Cosmos continues to evolve as a leading force in the multichain future of decentralized technologies.
Now that we’ve reviewed the project, let’s move on to the chart for a technical analysis.
📅 Weekly Timeframe
In the weekly timeframe, as you can see, the price has formed a support bottom at the 3.812 level and has tested it multiple times.
✨ This support is very important because if it’s lost, the price could move down toward the 1.863 bottom.
💥 On the other hand, if the price is supported at this level, a bullish cycle could begin. The resistance levels ahead are 6.602 and 10.135.
🔍 The 6.602 zone isn’t very strong, and if the price gets rejected there, it signals that sellers are much stronger than buyers.
✔️ But if the price breaks through this level and moves upward, the 10.135 zone becomes very significant, because if that level is broken, a Double Bottom pattern will be activated and we can get confirmation of a trend reversal.
💫 If this pattern is confirmed, the first target will be 15.704.
📊 Right now, it’s better to pay attention to oscillators like volume and RSI. Volume is currently decreasing, and we need to wait for volume confirmation alongside price movement. If the price starts to move with volume convergence, the likelihood of continuation increases.
🔔 The RSI oscillator also has a small bullish divergence with price. The reason it’s considered small is that the price made an equal low while the RSI made a higher low. If RSI makes a new higher low again, we may start to see the effect of the divergence in the chart.
🎲 A breakout above the 50 level on RSI could also be a confirmation of bullish momentum.
📅 Daily Timeframe
In the daily timeframe, we can see more details of the price action.
🧩 As observed, the price has formed a range box between 3.989 and 5.380, and within this range, RSI has shown a strong divergence.
📈 I think if RSI doesn’t stabilize below the 50 level, and if the price sets a new higher low above 4.588, the chance of breaking the 5.380 resistance on the next test will be much higher.
🔑 If 5.380 is broken, the price could rally to 7.514. The next target after that would be 10.135, a level I also emphasized in the weekly timeframe.
🔽 For a bearish scenario and short positions, the first trigger is a break below 4.588, which can act as a lead-in to a possible break of 3.989. The main short trigger will be the confirmed break of 3.989.
❌ Disclaimer ❌
Trading futures is highly risky and dangerous. If you're not an expert, these triggers may not be suitable for you. You should first learn risk and capital management. You can also use the educational content from this channel.
Finally, these triggers reflect my personal opinions on price action, and the market may move completely against this analysis. So, do your own research before opening any position.

TradeCityPro | Bitcoin Daily Analysis #95👋 Welcome to TradeCity Pro!
Let’s dive into the Bitcoin analysis and key crypto market indicators. As usual, I’ll break down the triggers for the New York futures session.
⏳ 1-Hour Timeframe
As you can see on the 1-hour chart, yesterday the price bounced from the 102882 level and is now moving toward 104204.
🔍 I mentioned yesterday that if the price prints a higher low above 101628, we could open a position on a breakout of 104204. That scenario played out, and now that the price has risen from 102882, we’re approaching 104204. So, a breakout above 104204 is a long trigger.
📈 The next long trigger is at 104800, and breaking that level could push the price toward the main resistance at 106247.
💥 For a short position and bearish confirmation, ideally, we’d want to see a lower high below 104204. If that happens, a break below 102882 becomes a valid short trigger.
🔽 The main short trigger and confirmation of a bearish reversal would come with a break of 101628.
📊 Keep an eye on volume—if volume increases as the price approaches any of these levels, the chances of a breakout increase significantly.
👑 BTC.D Analysis
Bitcoin Dominance moved slightly higher yesterday but got rejected from 63.71 and failed to reach 63.95.
✨ Currently, BTC.D is heading toward 63.30. If this level breaks, it could trigger a new bearish leg down toward 62.65 and 62.07.
📅 Total2 Analysis
Looking at Total2, this index couldn’t hold below 1.17 yesterday and bounced, currently reaching 1.19.
✔️ If the price holds above 1.19, that would be the first confirmation of bullish momentum. However, this move might also just be a pullback to 1.19—so if price gets rejected here, a break of 1.17 becomes the next short entry.
📅 USDT.D Analysis
Tether Dominance was rejected from 4.70 and may be heading back toward the 4.51 support.
🧩 A break below 4.60 could give us an early bearish signal. The main short trigger remains the 4.51 level.
❌ Disclaimer ❌
Trading futures is highly risky and dangerous. If you're not an expert, these triggers may not be suitable for you. You should first learn risk and capital management. You can also use the educational content from this channel.
Finally, these triggers reflect my personal opinions on price action, and the market may move completely against this analysis. So, do your own research before opening any position.

TradeCityPro | Bitcoin Daily Analysis #94👋 Welcome to TradeCity Pro!
Let’s go over the Bitcoin analysis and major crypto indexes. As usual, I’ll cover the New York futures session triggers for you.
⏳ 1-Hour Timeframe
As you can see, yesterday the price was rejected from the 104204 level and formed a lower high compared to 104800. Currently, there's a strong chance the short trigger will activate, so let’s review those triggers.
🔽 For a short position, the area where the price is currently consolidating—102882—is a suitable trigger. If this level breaks, the price could drop to 101628.
📊 One note about this trigger: the zone between 102882 and 101628 is a major support range. Every time the price has entered it, it’s formed long wicks and exited with strong bullish candles.
✨ So, if we enter a position based on this trigger, the volatility of the candles increases the chance of getting stopped out. On the other hand, using a large stop loss isn’t ideal either, since these trades go against the main trend and work better with a tight stop to hit the target faster.
💥 The next trigger is the break of 101628, which seems more reasonable. Breaking this level confirms a deeper correction and opens the path toward levels like 99225.
✔️ For a long position, if the price prints a higher low above 101628, we can confirm a bullish bias with the break of 104204. A higher low indicates strong bullish momentum, allowing us to use a slightly riskier trigger.
⚡️ However, if the price falls to the bottom of the box and then returns to the top, the main long trigger becomes a breakout above 104800.
🔍 Today, most of the market volume is on the sell side, and red candles are getting solid volume, so a correction to the box bottom seems likely. Either way, we have to wait for the triggers to activate.
👑 BTC.D Analysis
Bitcoin Dominance continues its bullish move after breaking the descending trendline. Yesterday, it printed a higher low and broke 63.30, reaching 63.61, and is now consolidating below that level.
🔔 If this level is broken too, we’ll have the first confirmation of a trend reversal in dominance. Full confirmation will come after BTC.D holds above 63.95.
📅 Total2 Analysis
Let’s move to Total2. Yesterday, the 1.19 trigger activated, and the price dropped to 1.17. The reaction to 1.18 wasn’t strong or clean, so I’ve adjusted the support level to 1.17.
📉 Today, we can open a short position if 1.17 is broken. For a long, if the price moves above 1.19, we can go long on altcoins that trigger accordingly.
📅 USDT.D Analysis
Now looking at Tether Dominance. Yesterday, it reacted to 4.70 and is now forming a higher low, heading back toward that level.
☘️ I see strong bullish momentum on the chart, and I believe the probability of breaking 4.70 is high. If it breaks, USDT.D could move up to 4.82.
❌ Disclaimer ❌
Trading futures is highly risky and dangerous. If you're not an expert, these triggers may not be suitable for you. You should first learn risk and capital management. You can also use the educational content from this channel.
Finally, these triggers reflect my personal opinions on price action, and the market may move completely against this analysis. So, do your own research before opening any position.

TradeCityPro | SOL: Key Retest at Support Before Next Breakout👋 Welcome to TradeCity Pro!
In this analysis, I’m going to review the SOL coin—one of the most requested assets and a very popular project in the crypto space.
✔️ This coin holds a market cap of $3.61 billion and is ranked 6th on CoinMarketCap.
⏳ 4-Hour Timeframe
As you can see, a bullish leg started from the 142.25 support and extended up to the 177.51 resistance.
🔍 Currently, after a fake breakout of 177.51 and a rejection from 183.86, the price has dropped back below 177.51 and formed a support level around 166.82.
📈 So far, the price has tested the 166.82 level twice and shown a strong bullish reaction. Recently, a powerful support candle has formed at this level, suggesting it’s being defended.
💥 If the price can move back toward the upper levels, a breakout of either 177.51 or 183.86 would provide a long entry trigger. If a higher low and higher high form before the breakout of 177.51, the trigger becomes even more reliable.
📊 Market volume has declined since the upward move ended. If volume increases as price rises again, it would provide a volume confirmation.
🔽 For a short position, the 166.82 level serves as a valid trigger. In my view, it’s a strong enough level to justify opening a short. The next major support below lies at 142.25.
❌ Disclaimer ❌
Trading futures is highly risky and dangerous. If you're not an expert, these triggers may not be suitable for you. You should first learn risk and capital management. You can also use the educational content from this channel.
Finally, these triggers reflect my personal opinions on price action, and the market may move completely against this analysis. So, do your own research before opening any position.
