TradeCityPro | CAKE: Triangle Squeeze Nears Breakout Decision👋 Welcome to TradeCity Pro!
In this analysis, I want to review the CAKE coin for you. This project is one of the crypto DEXs that operates on the BNB network and is among the most popular projects on that chain.
💫 This project’s token, CAKE, has a market cap of $747 million and ranks 95th on CoinMarketCap.
📅 Daily Timeframe
As you can see in the daily timeframe, a symmetrical triangle has formed, and the price is moving near the end of this triangle.
💥 Personally, I don’t trade when the price is in this area of the triangle and prefer to wait for the triangle to break, because there’s a high chance of random volatility that can cause missed opportunities due to incorrect entries.
✅ I recommend that you also wait for a breakout from this triangle and open a position only after it breaks—whether to the upside or downside.
✨ For a long position, you can enter after a breakout above 2.5. The main trigger will be the 2.847 zone. An RSI move into the Overbuy zone would also be a great confirmation for this position.
🔽 For a short position, our first trigger is the 1.909 level. If this level is broken, the price could start a downtrend toward 1.461. The main confirmation of a bearish trend will be a breakdown below 1.461.
📊 In any case, whichever trigger gets activated, I believe volume confirmation is essential. If volume increases along with price movement, the likelihood of that move being a fakeout decreases.
📝 Final Thoughts
This analysis reflects our opinions and is not financial advice.
Share your thoughts in the comments, and don’t forget to share this analysis with your friends! ❤️
Tradecitypro

TradeCityPro | Bitcoin Daily Analysis #92👋 Welcome to TradeCity Pro!
Let’s dive into today’s analysis of Bitcoin and key crypto indices. As usual, I’ll walk you through the futures session triggers for the New York session.
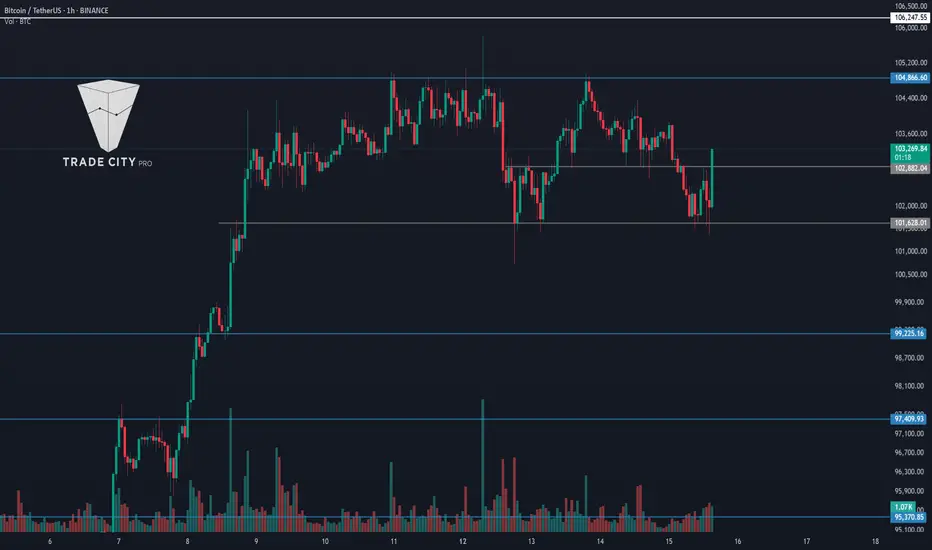
⌛️ 1-Hour Timeframe
As you can see in the 1-hour timeframe, the price has broken below the 102886 support and dropped to 101628, where it found support and is now making its way back toward the 102886 level.
✨ If the 102886 level is broken again, we could open a long position targeting the main recent high of the market at 104886.
🌩 The 104886 zone is a very significant level, and breaking it could initiate the next bullish leg for Bitcoin. However, the all-time high resistance at 106247 remains a solid barrier, forming a key supply zone between 104886 and 106247.
✔️ Since this zone is a major area of supply, it’s best to already be in a position before price reaches it. There’s a strong chance of a sharp move, and the breakout may not provide a clear confirmation candle, making it difficult to catch an entry in real time.
🔽 For short positions, our current trigger is the 101628 level. A breakdown here could begin a deeper correction. Key support levels to watch are 99225 and 97409.
👑 BTC.D Analysis
Moving on to Bitcoin dominance—yesterday, the trendline we had drawn was broken, and now dominance is heading toward 63.12.
🧩 The break of this trendline doesn’t indicate a trend reversal just yet. The bearish momentum in this current leg has been strong, and for a full reversal, we would need to see a higher high and higher low form on higher timeframes.
🔔 For now, the next corrective zones for dominance are at 63.61 and 64.10.
📅 Total2 Analysis
Let’s look at the Total2 index. Like Bitcoin, it has undergone a correction and has reached the 1.18 support level.
🎲 The current short trigger is the 1.18 level, and a breakdown here would confirm a deeper correction.
🔼 For long positions, the 1.24 and 1.26 levels are suitable triggers.
📅 USDT.D Analysis
Now let’s analyze Tether dominance. The index has corrected to the 4.69 level.
☘️ If 4.69 is broken, the market could undergo a deeper correction toward 4.82. On the other hand, if the price gets rejected from this level, the likelihood of a move back down to 4.51 increases.
❌ Disclaimer ❌
Trading futures is highly risky and dangerous. If you're not an expert, these triggers may not be suitable for you. You should first learn risk and capital management. You can also use the educational content from this channel.
Finally, these triggers reflect my personal opinions on price action, and the market may move completely against this analysis. So, do your own research before opening any position.
TradeCityPro | QNT: Range Top Test in RWA Uptrend Structure👋 Welcome to TradeCity Pro!
In this analysis, I’m going to review the QNT coin — one of the RWA projects currently ranked 71 on CoinMarketCap with a market cap of $1.19 billion.
⏳ 4-Hour Timeframe
As you can see, there’s a clear uptrend along with a trendline that has pushed the price up to the 100.7 level.
💥 At the moment, the price has formed a range box between 93.1 and 100.7, with multiple touches on both ends. Currently, the price is testing the top of this range at 100.7 once again.
🔍 If the 100.7 resistance is broken, we can consider entering a long position. This trigger is valid for a long, and if confirmed, the price could potentially move toward the next target at 121.8.
✨ For a short position, we first need to see the trendline break and the 93.1 level get triggered. That would serve as our first confirmation of a possible trend reversal.
📉 A breakdown below the 50 level on the RSI would be the first momentum-based sign of this reversal. If selling volume also increases at the same time, we’ll have confirmation of a volume divergence.
⚡️ On the other hand, a break of the trendline itself might act as an early trigger, but I personally wouldn’t open a position on that alone — it’s too risky. As long as the price holds above 93.1, the overall uptrend remains intact.
📝 Final Thoughts
This analysis reflects our opinions and is not financial advice.
Share your thoughts in the comments, and don’t forget to share this analysis with your friends! ❤️

TradeCityPro | VETUSDT The Best Entry Opportunity Awaits👋 Welcome to TradeCityPro Channel!
Let’s dive in and analyze one of the veteran coins in the cryptocurrency space, VET, which has a high potential for movement. Together, we’ll identify its entry triggers.
🌐 Overview Bitcoin
Before starting the analysis, I want to remind you again that we moved the Bitcoin analysis section from the analysis section to a separate analysis at your request, so that we can discuss the status of Bitcoin in more detail every day and analyze its charts and dominances together.
This is the general analysis of Bitcoin dominance, which we promised you in the analysis to analyze separately and analyze it for you in longer time frames.
📊 Weekly Time Frame
In the weekly time frame, VET is one of the coins that’s in a relatively good position compared to other altcoins. While most altcoins have recorded new lows, VET has never lost the 0.01430 level!
After being supported at 0.01922 and closing a green weekly candle, we experienced an upward move. Currently, we’re stuck at the resistance of 0.03176, and it seems we’re pulling back to this resistance.
📉 Daily Time Frame
In the daily time frame, after an upward wave that didn’t quite reach the 0.09 resistance, a fake candle occurred, and we entered a box between 0.04197 and 0.05253. Seller presence and a rejection from the middle of the box led to losing the 0.04197 support.
After breaking this support, we experienced a sharp decline. When we reached the 0.01925 support, the bearish momentum hit its lowest point, and we saw reactions from buyers, leading to an upward move.
Currently, we’re below the key resistance at **0.03233**. After breaking this level, we can expect a sharp upward move. You can take a position in both **futures and spot**, with the safest stop loss for your buy at 0.01925
✍️ Final Thoughts
Stay level headed, trade with precision, and let’s capitalize on the market’s top opportunities!
This is our analysis, not financial advice always do your own research.
What do you think? Share your ideas below and pass this along to friends! ❤️

TradeCityPro | Bitcoin Daily Analysis #91👋 Welcome to TradeCity Pro!
Let’s dive into the Bitcoin and major crypto index analysis. As usual, I'll go over the key triggers for the New York futures session.
⏳1-Hour Timeframe
As you can see, Bitcoin made a bullish move yesterday after breaking above 102,882 and reached as high as 104,866.
✔️ After hitting 104,866, the price failed to break this resistance and got rejected, pulling back to retest 102,882 with a wick.
✨ As long as the price stays above 102,882, I consider the market momentum bullish. I still hold my long position opened around 85,000 and plan to open another one if we break 104,866.
📈 So the best long trigger is a clean breakout above 104,866. The next resistance is 106,247, which makes the 104,866 breakout a bit riskier due to proximity to that major supply zone.
🔽 For short setups, the first trigger is again 102,882. If the price forms a lower high below 104,866, a breakdown of 102,882 could justify a risky short.
📊 Personally, I’m not opening any shorts yet since higher timeframe trends are bullish. My first valid short trigger would be a breakdown of 101,628.
👑 BTC.D Analysis
Bitcoin dominance continues to fall and has now reached the 62.07 support level and is reacting to it.
💫 If 62.07 breaks, we could see another bearish leg down to 61.34.
🔼 For BTC.D to flip bullish, we first need to see the descending trendline break and then look for confirmation and a long trigger from that.
📅 Total2 Analysis
After breaking through 1.24, Total2 moved up to 1.26 and is now pulling back to retest 1.24.
🧩 If 1.24 holds and the price breaks above 1.26, there’s a strong chance it continues toward 1.31. This would confirm a long setup for altcoins.
🔔 For short positions, the only valid trigger for now is a breakdown of 1.18.
📅 USDT.D Analysis
Tether dominance faked a breakdown below 4.51 yesterday but has now bounced back above it.
💥 Currently, we should wait for the price to retest 4.51 again and reassess that support. If it breaks down cleanly, we’ll get confirmation of bearish momentum for USDT.D, which would support a bullish trend in the broader crypto market.
❌ Disclaimer ❌
Trading futures is highly risky and dangerous. If you're not an expert, these triggers may not be suitable for you. You should first learn risk and capital management. You can also use the educational content from this channel.
Finally, these triggers reflect my personal opinions on price action, and the market may move completely against this analysis. So, do your own research before opening any position.

TradeCityPro | LINK: Eyeing Breakout as RSI Signals Divergence👋 to TradeCity Pro!
In this analysis, I’m going to review the LINK coin. This project is one of the well-known DeFi and Cross-Chain platforms, and it's considered one of the top projects in these categories.
🔍 The LINK token currently has a market cap of $627 million and holds a ranking on CoinMarketCap.
⏳ 4H Timeframe
As you can see, LINK has started a bullish leg, rising from $13.30 to $17.62. After a pullback that reached as low as $15.92, it has returned to test the previous high.
⚡️ If the $17.62 resistance is broken, the price could rally toward $19.42. Therefore, a breakout above $17.62 can be used as a long entry trigger.
📊 So far, volume has aligned well with the upward trend, and there are no signs of weakness from the volume perspective. However, if volume rises during a pullback or drops during a bullish move, it would signal a volume divergence, potentially indicating a trend reversal.
💥 Meanwhile, the RSI oscillator shows a bearish divergence. If RSI closes below the 50 level, this divergence would be confirmed, suggesting the possibility of a corrective move.
✨ To confirm a deeper correction or trend reversal, a breakdown below $15.92 would be significant. The next support after that lies at $15.22, with the main support far below at $13.30.
✔️ For short positions, I recommend waiting for clearer signs of trend reversal, such as volume divergence or confirmed RSI divergence. At the moment, there’s no solid short setup, and we need to wait for a suitable structure to develop.
📝 Final Thoughts
This analysis reflects our opinions and is not financial advice.
Share your thoughts in the comments, and don’t forget to share this analysis with your friends! ❤️

TradeCityPro | Bitcoin Daily Analysis #90👋 Welcome to TradeCity Pro!
Let’s dive into Bitcoin and major crypto indices analysis. As usual, I’ll walk you through the key triggers for the New York futures session.
⏳ 1-Hour Timeframe
As you can see, the price has found support at the 101,628 level and is now moving back up toward the 104,866 resistance.
⭐ The first trigger for a long position was the breakout of 102,882, which confirmed the activation of a double bottom pattern and could’ve been a good entry point for a long.
✔️ The next key triggers are at 104,866 and 106,247. If you don’t already have a position open, you can enter on a breakout above these levels—but keep in mind it’s risky since there’s a strong supply zone nearby.
💥 From the RSI oscillator, a breakout above 57.41 can serve as confirmation of bullish momentum. In that case, you can take on more risk in long positions.
📉 For short positions, the first trigger is the breakdown of 101,628. If the price sets a lower high below 104,866, you can consider entering a short on the break of 101,628.
👑 BTC.D Analysis
Moving on to Bitcoin dominance—yesterday, dominance made a fakeout to the downside but came back above 62.65.
⚡️ To continue its downtrend, we can use 62.65 as the bearish trigger again. For a bullish confirmation, the next trigger is a breakout above 63.61.
📅 Total2 Analysis
Total2 had a pullback to 1.18 and is now heading back toward 1.24.
✨ We’ll confirm bullish continuation on a breakout above 1.24, and this can be used as a trigger for long positions.
🔽 For shorts, if the price prints a lower high under 1.24, a risky short could be considered on a breakdown below 1.18.
📅 USDT.D Analysis
Now looking at Tether dominance—like I mentioned yesterday, we were watching the 4.51 level for confirmation. That level held as support and blocked further Bitcoin upside.
🔔 Currently, a breakdown below 4.51 would confirm bearish continuation. If 4.70 breaks to the upside instead, we get confirmation of a deeper market correction.
❌ Disclaimer ❌
Trading futures is highly risky and dangerous. If you're not an expert, these triggers may not be suitable for you. You should first learn risk and capital management. You can also use the educational content from this channel.
Finally, these triggers reflect my personal opinions on price action, and the market may move completely against this analysis. So, do your own research before opening any position.

TradeCityPro | STX: Watching Triangle Breakout and RSI Reaction👋 Welcome to TradeCity Pro!
In this analysis, I’m going to review the STX coin, which belongs to the Stacks project—a Layer 2 solution for Bitcoin.
🔍 STX, with a market cap of $1.45 billion, is currently ranked 59 on CoinMarketCap.
🔄 In the previous analysis, I drew an expanding triangle and mentioned that if this triangle breaks to the upside, we can enter a long position or even make a spot purchase.
✨ The trigger for the triangle breakout was at the 0.731 level. After breaking out and pulling back to this level, the price moved up to 1.049 and is now once again in a consolidation phase.
📅 Daily Timeframe
Currently, after RSI got rejected from the 73.58 zone and exited the overbought area, the price has undergone some correction. A pullback to the 0.871 level is possible.
🧩 If a pullback or deeper correction occurs, as long as RSI remains above 50, I still consider the market momentum to be bullish and believe the price can continue moving upward.
📈 If we see a solid bullish candle confirming continuation, we can enter a long position. However, the main long trigger is the breakout of 1.049. The RSI trigger for sharper moves would also be a breakout above 73.58.
📊 The next resistance level is at 1.332. If this level breaks, the coin enters a new price zone, and we’ll need to see whether it can establish support above that area.
🔽 For a bearish scenario, we should wait for the market to form a structure and provide a valid trigger to confirm a short position. At the moment, it’s better to wait for that setup.
🔑 If the market turns bearish, the key support zones to watch are 0.731, 0.571, and 0.453, which could potentially halt further decline.
📝 Final Thoughts
This analysis reflects our opinions and is not financial advice.
Share your thoughts in the comments, and don’t forget to share this analysis with your friends! ❤️

TradeCityPro | Bitcoin Daily Analysis #89👋 Welcome to TradeCity Pro!
Let’s dive into the Bitcoin analysis and key crypto indexes. As usual, in this analysis I’ll go over the futures triggers for the New York session.
⏳ 1-Hour Timeframe
In the 1-hour timeframe, as you can see, Bitcoin is still below the 104866 resistance level and is ranging underneath this zone.
💥 Today, an important news update came from Trump: a deal has been made between China and the U.S., and the two countries have agreed to reduce tariffs for 90 days.
✔️ The impact of this news was that Bitcoin made a wick toward 106247 but didn’t reach it, pulled back, and is now again below the 104866 area.
✨ At the moment, the 104866 level is a suitable trigger for opening a position, but be aware that there’s a significant resistance zone at 106247. Personally, I won’t open a position just on the break of 104866 because it's very close to the ATH zone, and the probability of entering a corrective phase is high.
⚡️ If a correction begins, the first support level for price is at 102391. If the RSI stabilizes below 50, the likelihood of a correction increases.
🔽 As for short positions, we should wait until the market shows a trend reversal.
👑 BTC.D Analysis
Now let’s look at Bitcoin dominance. Yesterday, the dominance chart made a slight upward correction and is now breaking below the 62.65 low.
🧩 If the downward move in dominance continues, altcoins could make another leg upward. The next support for dominance is at 62.17.
📅 Total2 Analysis
Now for the Total2 analysis. The 1.24 area, which was our long trigger, is being broken—and if it confirms, the price could rise up to 1.31.
⭐ This confirmation, along with the drop in Bitcoin dominance, could give us good long setups on altcoins.
📅 USDT.D Analysis
Now to Tether dominance. This index hasn’t triggered yet and is currently sitting at the 4.51 support. If this index also confirms a bearish move, the risk of opening long positions will be much lower.
💫 The next support level for Tether dominance is at 4.37.
❌ Disclaimer ❌
Trading futures is highly risky and dangerous. If you're not an expert, these triggers may not be suitable for you. You should first learn risk and capital management. You can also use the educational content from this channel.
Finally, these triggers reflect my personal opinions on price action, and the market may move completely against this analysis. So, do your own research before opening any position.

TradeCityPro | Bitcoin Daily Analysis #88👋 Welcome to TradeCity Pro!
Let’s dive into the analysis of Bitcoin and key crypto indexes. As usual, in this analysis I want to review the futures triggers for the New York session.
⏳ 1-Hour Timeframe
In the 1-hour timeframe, as you can see, Bitcoin has formed a slightly better structure and it seems to be undergoing a trend-aligned correction.
✔️ A trend-aligned correction happens when the market enters a corrective phase, but the sellers are so weak that they can’t even stop the price from rising during the correction, and the price gradually moves upward.
🔑 In this case, since the market is in a corrective phase, if we enter with a tight stop loss, we are likely to get stopped out due to the nature of corrections. So it's better to open positions with a wider stop loss so it doesn't get triggered easily.
📊 One thing to note on the current Bitcoin chart is that we are very close to its most important resistance at 106247. This zone is a very strong supply area, and I think breaking through it won’t be easy.
⚡️ So for now, I suggest not opening any new positions on Bitcoin and instead using dominance charts to open positions on altcoins.
📈 If you already have an open position, I recommend keeping your Bitcoin position open, because if 106247 breaks, your position could become highly profitable.
👑 BTC.D Analysis
Let’s move on to Bitcoin dominance. Yesterday, after breaking the 63.61 level, there was another downward leg down to the 62.65 area, and altcoins made another upward move.
⭐ Currently, the dominance is correcting and has risen to the 63.29 area. I think it’s going through a slight correction since its drop was sharp and needs a bit of a breather.
💥 However, if the 62.65 low gets broken, we can take it as confirmation of the next bearish leg, and if that happens, we can again open positions on altcoins.
📅 Total2 Analysis
Now to the Total2 analysis. Yesterday, this index got rejected from the 1.24 top and slightly corrected, but it hasn’t reached the 1.17 area which overlaps with the 0.236 Fibonacci level, so we still haven’t confirmed the start of a correction.
✨ In my opinion, as long as we stay above the 0.382 level, the uptrend remains strong. Only after breaking below this area will we confirm the start of a deeper correction.
🔼 For continuation of the trend, breaking above 1.24 would allow us to open positions on altcoins.
📅 USDT.D Analysis
Now to Tether dominance. This index also broke below 4.63 yesterday and dropped to 4.51, and is currently correcting.
🧩 To get confirmation from Tether dominance, a break below 4.51 would signal that we can open long positions on altcoins.
🎲 The simultaneous break of 4.51 and 1.24 could be a strong confirmation if dominance continues to decline.
❌ Disclaimer ❌
Trading futures is highly risky and dangerous. If you're not an expert, these triggers may not be suitable for you. You should first learn risk and capital management. You can also use the educational content from this channel.
Finally, these triggers reflect my personal opinions on price action, and the market may move completely against this analysis. So, do your own research before opening any position.

TradeCityPro | FARTCOIN: Watching Trendline & RSI for Next Move👋 Welcome to TradeCityPro!
In this analysis, I’m going to review the FARTCOIN token. This project is one of the meme coins that launched in 2024 and has shown good growth so far.
🔍 This meme coin currently has a market cap of $1.31 billion and ranks 65th on CoinMarketCap.
📅 Daily Timeframe
On the daily timeframe, as you can see, the price recorded a major top at the 2.16674 zone in early 2025 and then entered a correction phase.
✨ This correction phase was quite long and extended down to 0.21562, but after a bottom was formed in that area, bullish momentum returned to the coin and it started moving upward again.
✔️ Currently, the price has moved up to around the 1.53002 level and has a rising trendline that it has touched several times, serving well as a dynamic support level.
📊 For now, the issue with this trend is that the volume has significantly decreased compared to the previous leg, which could indicate weakness in the upward trend. We need to wait and see whether buying or selling volume increases in the next move — either a correction or another bullish leg — to confirm whether the trend will reverse or continue.
📈 For a long position, 1.53002 is the closest trigger to the current price. If this level is broken, the price could move toward 2.16674.
🛒 The main confirmation for a bullish continuation and a strong long position would come after the breakout of 2.16674. That’s also our trigger level for a spot buy.
🔽 To turn bearish, the key trigger is breaking the 0.63121 support. However, a riskier trigger would be breaking the trendline and activating the 1.00301 trigger. If that happens, we can consider it confirmation of the beginning of a correction.
💥 The RSI oscillator is currently forming a clean box between 50 and 70 and is now near the top of this box. If RSI enters the Overbuy zone, it would strongly confirm a long position.
📉 For a trend reversal or the start of a correction, a sustained RSI move below 50 would provide confirmation.
📝 Final Thoughts
This analysis reflects our opinions and is not financial advice.
Share your thoughts in the comments, and don’t forget to share this analysis with your friends! ❤️

TradeCityPro | Bitcoin Daily Analysis #87👋 Welcome to TradeCity Pro!
Let’s get into the analysis of Bitcoin and major crypto indices. As usual, I’ll review the triggers for the New York Futures session.
⏳ 1-Hour Timeframe
On the 1-hour timeframe, Bitcoin moved sideways yesterday as I mentioned, and after the RSI exited the Overbuy zone, it corrected down to the 102391 area.
🔍 This was a very minor correction, mainly due to the RSI leaving the Overbuy zone. Currently, the oscillator has reset, and if it re-enters Overbuy, we can confirm the start of bullish momentum.
✨ Now the candle has closed above the 103642 area, and if the price stabilizes above this level, it could move toward the main resistance at 106247.
📊 In my opinion, the price will move toward 106247 and then enter a correction because the breakout of 103642 was accompanied by increased volume, and if this volume continues, the probability of this move increases.
📉 If the correction starts from the current level, the first support we have is 102391, and after that, there is no solid support until 99337.
🧩 The reason I’m not using Fibonacci to find support zones is that the price hasn’t confirmed the start of a correction yet, and a proper top hasn’t been formed. I’m waiting for that top and confirmation of the correction before identifying key correction levels.
✔️ For now, only these two support levels are important, and as long as the price is above 99337, the trend remains bullish.
📈 For opening a position today, the Bitcoin trigger at 103642 has been activated and is currently getting a pullback. If you get confirmation from this pullback, you can enter a position — but be careful, there's a very important resistance at 106247 and that zone is highly significant.
👑 BTC.D Analysis
Let’s move to Bitcoin dominance. Yesterday, dominance had a slight correction and pause, and today it broke the 63.61 area and is moving toward the 63.23 support.
⚡️ It seems there’s strong bearish momentum in dominance, and if it continues to drop, I believe it could easily break 63.23 and move further down.
📅 Total2 Analysis
Let’s check out Total2. Yesterday, the 1.17 trigger for this index also activated, and you could open positions on altcoins.
💥 The next resistance we currently have is the 1.22 area, and considering the drop in Bitcoin dominance, this index can easily move toward that resistance.
🔔 At the moment, I can’t give you any trigger on this index — you can only enter based on confirmation from individual coins.
📅 USDT.D Analysis
Now let’s look at Tether dominance. This index has also continued its move and after a short pause, broke below 4.65 and is moving downward.
🎲 For now, the trend in dominance is bearish, which pushes the market upward.
❌ Disclaimer ❌
Trading futures is highly risky and dangerous. If you're not an expert, these triggers may not be suitable for you. You should first learn risk and capital management. You can also use the educational content from this channel.
Finally, these triggers reflect my personal opinions on price action, and the market may move completely against this analysis. So, do your own research before opening any position.

TradeCityPro | APT: Testing Momentum After Key Breakout👋 Welcome to TradeCity Pro!
In this analysis, I want to review the APT coin for you. This coin belongs to the Aptos project, which is one of Ethereum’s Layer 2 solutions.
⚡️ APT, with a market cap of $3.6 billion, is currently ranked 32 on CoinMarketCap.
⏳ 4-Hour Timeframe
As you can see in the 4-hour timeframe, after finding support at the 4.687 zone, the price made a very sharp bullish move and reached 5.708. After an initial rejection, it has now managed to stabilize above this level.
🔍 If this bullish move continues, we could see another upward leg, with the next resistance at 6.047. If this level breaks, the price could move up to 6.752.
✔️ There’s a very important RSI ceiling at 80.76, which has consistently caused rejections after sharp upward moves. If the price aims for another bullish wave, this level will be critical and could mark the top of the move.
⭐ A breakout above this level seems unlikely for now, since 80.76 is a very high reading for the RSI oscillator, and the chance of it breaking is quite low. But if it does happen, we could see an extremely sharp and unusual move.
🔽 As for a bearish scenario and short positions, we currently need to wait for a trend reversal. If the breakout above 5.708 turns out to be fake and the price starts moving downward, we can look for a trigger in a lower timeframe to enter.
🔑 But keep in mind that short positions in these market conditions are very, very risky. And if you do open such a position, make sure to secure profits frequently with small risk-to-reward setups.
📝 Final Thoughts
This analysis reflects our opinions and is not financial advice.
Share your thoughts in the comments, and don’t forget to share this analysis with your friends! ❤️

TradeCityPro | Bitcoin Daily Analysis #86👋 Welcome to TradeCity Pro!
Let’s move on to the analysis of Bitcoin and major crypto indices. As usual, in this analysis I want to review the futures session triggers for New York.
✔️ Yesterday the market made another bullish leg and has now reached the 103642 resistance. There’s a chance we might enter a correction phase because the move has been very sharp and I think the market needs a rest.
⏳ 1-Hour Timeframe
As you can see in the 1-hour timeframe, we had a bullish move that continued after a pullback to the 99337 zone, climbing all the way to 103642.
💥 The RSI trigger I gave you also got activated and yesterday you could open a momentum-based position. I personally already have a long on Bitcoin from near 88000, so I didn’t open another one yesterday.
⚡️ Currently, RSI is exiting the Overbuy zone, and if that happens, the chance of entering a correction phase increases. As long as the price is above 99337, the main market momentum is still bullish and we’re not confirming a trend reversal just yet due to this strong momentum.
📈 Over the past few weeks, I emphasized a lot that you should definitely have at least one long position open, and not to open short positions unless a trend reversal is confirmed. I hope you’ve used the analyses and opened proper positions on either Bitcoin or altcoins.
📊 Today, it’s a bit late to open new positions because I think the market has made its main move and now we’re waiting for a correction phase to start. However, if you don’t have a position, you can enter a very risky trade on the breakout of the 103642 level.
🚨 This position is very risky and I personally won’t open it because we’re near the ATH and I think even if Bitcoin moves up to 106247, it’ll likely take a breather and won’t go straight up.
🔼 In any case, if you want to open a long position, I personally suggest waiting for a new structure to form and then look for a trigger. Otherwise, the only current trigger we have is 103642.
📉 As for a short position, you definitely know by now that with this strong bullish momentum, I’m not going to give you a short trigger. You have to wait for a proper structure for short entries.
👑 BTC.D Analysis
Let’s go to Bitcoin dominance. Yesterday dominance finally made a bearish move. It was a very sharp and one-sided drop to the 63.61 level without any corrections.
🧩 Currently, dominance is very bearish and altcoins have moved up strongly. Especially Ethereum, which after a long time made a sharp bullish move. I think as the market starts to correct, dominance will also move up and correct.
⭐ For altcoin entries, I personally wait for dominance to make a short-term upward correction and if it continues the second leg downward, I’ll enter altcoins.
📅 Total2 Analysis
Let’s move on to Total2. This index also had a sharp bullish move and after breaking 1.05, it managed to climb to 1.17.
🔔 I’ve talked a lot about the 1.05 zone and repeatedly told you to make sure you have a long position if it breaks. With that trigger activated, the Total2 uptrend has started and reached the 1.17 resistance.
✨ Currently, the only available trigger is the breakout of the 1.17 zone, and if it’s broken, we can enter another position.
📅 USDT.D Analysis
Let’s move to USDT dominance. Yesterday the 4.82 trigger was activated and dominance continued to fall. I also emphasized the 4.99 breakdown a lot and once again, I hope you’ve used the analysis and opened a position.
👀 Currently, the price has reached the 4.65 zone, which is very important and could trigger a correction. But if this zone breaks, we can open short positions.
💫 Overall, today if you notice, all the charts we analyzed seem to have made enough moves and now it’s time for a correction. However, if their triggers are activated and you don’t already have a position, you can still enter.
❌ Disclaimer ❌
Trading futures is highly risky and dangerous. If you're not an expert, these triggers may not be suitable for you. You should first learn risk and capital management. You can also use the educational content from this channel.
Finally, these triggers reflect my personal opinions on price action, and the market may move completely against this analysis. So, do your own research before opening any position.

TradeCityPro | Bitcoin Daily Analysis #85👋 Welcome to TradeCity Pro!
Let’s move on to the analysis of Bitcoin and key crypto indices. As usual in this analysis, I’ll review the futures triggers for the New York session.
📰 Yesterday, the U.S. interest rate decision came out, which remained unchanged and didn’t have much impact on the market—this was expected for some time. Now that the news had no real effect, the market can continue its previous trend.
⏳ 1-Hour Timeframe
As you can see in the 1-hour timeframe, after the news came out yesterday, the price ranged a bit and then moved upward, triggering the 97409 level. I hope you entered a position with that trigger because I had emphasized it strongly.
✔️ Currently, the price has reached the 99337 zone and is stabilizing above it. If this holds, the next resistance level is 101965.
💥 The RSI oscillator is also in the Overbuy zone, which is helping the price maintain its bullish momentum. There’s a resistance at 75.77 on the RSI, and if that breaks as well, we could see a very sharp move in the chart.
📊 Buy volume has been strong in this leg and aligns with the trend. If volume starts decreasing, divergence will appear, and we’ll get the first sign of trend weakness. Just remember—weakness doesn’t mean trend reversal.
📉 As for short positions, I think by now you know my trading style. In a market like this, where momentum is strongly bullish and price is breaking resistance one after another, I don’t think opening a short position makes sense. We should wait for proper structure to form before considering a short.
👑 BTC.D Analysis
Moving on to Bitcoin dominance—yesterday the 65.28 zone was broken and price moved up near the top of the channel, but then reversed and has now dropped to the midline of the channel.
🔑 Currently, the dominant trend is still bullish, but short-term momentum is bearish, and there’s a good chance it drops further to 64.91.
⚡️ Since the higher timeframes are still bullish, we could see bullish momentum return at any time. Technically, the 64.91 zone is the next major support.
📅 Total2 Analysis
Let’s look at Total2—finally, the 1.05 trigger was activated, and Total2 started moving upward. I had strongly emphasized this trigger as well, and I hope you took advantage of it.
🧩 Price has now reached the 1.07 level, and if that breaks, it could move up to 1.1.
🔼 If this bullish move turns out to be a fakeout, the next valid triggers for short positions are a break of 1.03 and then 1.01.
📅 USDT.D Analysis
Now to Tether dominance—this index also broke the 4.99 level and is now trending downward.
🔍 If this move continues, we could see a drop to around 4.82. That would allow the market to continue its upward movement even further.
❌ Disclaimer ❌
Trading futures is highly risky and dangerous. If you're not an expert, these triggers may not be suitable for you. You should first learn risk and capital management. You can also use the educational content from this channel.
Finally, these triggers reflect my personal opinions on price action, and the market may move completely against this analysis. So, do your own research before opening any position.

TradeCityPro | HYPE: Bullish Momentum Builds Near Resistance👋 Welcome to TradeCity Pro!
In this analysis, I’m going to review the HYPE coin for you. The Hyperliquid project is one of the DEX projects in the crypto space that also functions as a Derivatives platform, and it currently holds the highest 24-hour volume among all DEXs.
🔍 The token for this project, with the symbol HYPE, has a market cap of $7.23 billion and is ranked 20th on CoinMarketCap.
⏳ 4-Hour Timeframe
In the 4-hour timeframe, as you can see, this coin is in an uptrend with an ascending trendline, and it’s currently encountering resistance at 21.48.
📈 If the price stabilizes above this zone, a new bullish wave can begin, with the next resistance being at 22.799.
✔️ You can enter a long position using the 21.48 breakout trigger. Buying volume has increased significantly, which raises the chances of this level breaking.
📊 For short positions and a potential bearish trend in this coin, the first trigger would be a rejection from the 21.48 resistance. If the price gets rejected at this level, the likelihood of breaking the trendline increases.
⭐ A break of the trendline itself can also serve as a trigger. Breaking this trendline would eliminate bullish momentum in the market, and a breakdown below the 39.29 level on the RSI would further support bearish momentum.
🔽 The main short position can be opened upon breaking the 19.552 level. This is a very strong support, and if the price closes below it, it could drop further to 17.88.
👀 Overall, the long setup on this coin looks quite logical, and if the 4-hour candle closes as is and doesn’t turn out to be a fakeout, it could be a great entry opportunity.
📝 Final Thoughts
This analysis reflects our opinions and is not financial advice.
Share your thoughts in the comments, and don’t forget to share this analysis with your friends! ❤️

TradeCityPro | Bitcoin Daily Analysis #84👋 Welcome to TradeCity Pro!
Let’s dive into the analysis of Bitcoin and major crypto indices. As usual, I’m going to review the New York futures session triggers for you.
⏳ 1-Hour Timeframe
As you can see in the 1-hour timeframe, yesterday after news of tensions between India and Pakistan, Bitcoin moved upward and made a sharp rally to the 97409 zone, returning once again to this high.
📰 This news created fear in the market, and the buying that occurred was driven by fear and news impact. In my opinion, this bullish leg won’t be sustainable in the long term unless the price stabilizes above the 97409 level and starts a new upward leg.
✨ If the 97409 level is broken, we can enter a long position since it aligns with the current bullish trend, and we can position ourselves for the breakout with a wide stop-loss.
✔️ But make sure your stop-loss is wide and placed below the market’s main support because a significant resistance is being broken, and there's a high chance of volatility before the market actually moves upward. A tight stop-loss may get triggered before the actual rally begins.
💥 A momentum confirmation for today’s long position could be RSI entering the Overbuy zone, and if that happens, the chances of breaking 97409 increase significantly.
📉 For a short position, we should wait and see how the news impact plays out in the market. If it turns out to be driven by FOMO, naturally in the next few days, the price may move back down, and we could enter short positions on breaks of levels like 95370 or 93626.
👑 BTC.D Analysis
Let’s move to Bitcoin Dominance. Yesterday, dominance stabilized above the 64.91 level and managed to move up to 65.25.
🎲 Currently, Bitcoin is a much better option for long positions since dominance is rising, and even breaking 65.28 would confirm another bullish leg in dominance, potentially pushing it toward the top of the channel.
📅 Total2 Analysis
Let’s analyze Total2. Yesterday, this index faked a breakdown below 1.01 and simultaneously moved upward with the news, now reaching the 1.03 zone. A break of this zone could confirm a bullish move toward 1.05.
⭐ The main trigger for a long position remains the break of 1.05, and I strongly recommend being positioned if that level is broken.
🔽 For a short position, you can still enter on a break of 1.01 — I still think it’s a valid trigger.
📅 USDT.D Analysis
Now for USDT Dominance: yesterday, this index also faked a move above the 5.20 level and has since dropped to 5.04.
💫 Activation of the 5.04 trigger could be confirmation for a long position and a sign of USDT dominance starting to decline. The main trigger remains the break of the 4.99 bottom.
❌ Disclaimer ❌
Trading futures is highly risky and dangerous. If you're not an expert, these triggers may not be suitable for you. You should first learn risk and capital management. You can also use the educational content from this channel.
Finally, these triggers reflect my personal opinions on price action, and the market may move completely against this analysis. So, do your own research before opening any position.

TradeCityPro | SUI: Bullish Push Faces Key Resistance Test👋 Welcome to TradeCity Pro!
In this analysis, I want to review the SUI coin for you. It's one of the DeFi layer-1 projects that was highly hyped in 2024 and has recently gained renewed attention due to some news from the project.
🔍 This project's coin, with the symbol SUI, has reached a market cap of $11.3 billion, ranking it 11th on CoinMarketCap.
📅 Daily Timeframe
As you can see in the daily timeframe, since the last analysis I shared in this channel, the price has rebounded from the support zone I highlighted and, after breaking the trendline, made a bullish leg up to 3.6402.
📊 A significant amount of buying volume has entered the market, and the RSI has entered Overbuy territory. These two factors drove the bullish move, and the 3.6402 resistance is a key level that has temporarily held off further price increases.
✔️ Currently, we’re seeing a few corrective candles that caused the price to reject from this resistance, but it's holding up well and still looks poised to move back toward this level.
🛒 For spot buying, if the price moves back toward this area, you can enter a position on a break of 3.6402. The next trigger is the break of 4.0866, and the main resistance ahead is 5.2689.
🔽 If a correction occurs, support levels are 2.7830 and 2.2495. If price retraces, these can serve either as short targets or long entry zones depending on the price reaction.
📉 Confirmation of trend reversal would come if the price fails to make a higher high above 3.6402 and breaks the current low. After that, we can consider opening a short position.
📝 Final Thoughts
This analysis reflects our opinions and is not financial advice.
Share your thoughts in the comments, and don’t forget to share this analysis with your friends! ❤️

TradeCityPro | Bitcoin Daily Analysis #83👋 Welcome to TradeCity Pro!
Let’s dive into the Bitcoin analysis and key crypto indices. As usual, I want to review the triggers for the New York futures session.
🔍 Today, I’ll provide the analysis in the 4-hour timeframe, since not much has changed on the 1-hour chart compared to yesterday, and it's better to take a slightly longer-term look at the chart.
⏳ 4-Hour Timeframe
As you can see in the 4-hour chart, we have an upward leg that started from the 84,000 zone and extended to 97,108. Currently, it's ranging between 93,626 and 95,370.
✔️ The main market top lies at 97,108, but the price has formed a range slightly lower, with 93,626 acting as support.
⚡️ There's a strong divergence visible in the RSI — while Bitcoin has formed three consecutive higher highs, RSI has printed lower highs. This divergence was activated when RSI broke below 50, and the price corrected to 93,626.
📊 In my opinion, the market has now digested the divergence, but the impact it had was a correction down to this level. If 93,626 breaks, deeper corrections could follow.
✨ The 93,626 zone overlaps with the 0.236 Fibonacci retracement and forms a PRZ. If this level breaks, we can open a short position. I open this kind of trade in lower timeframes as a scalp and take quick profits, since it’s counter-trend.
🔽 The maximum short-term target I expect for this trade is the 91,945 area. It's possible that the price corrects further or even reverses trend, but it's not logical in my strategy to hold these kinds of trades longer.
🔑 The key supports ahead are 91,945 (which overlaps with 0.382 Fibonacci), and further down are the 0.5 and 0.618 Fibonacci levels.
📈 For a long position, breaking 95,370 is currently the best trigger. You can also enter on a break of 97,139, but there's strong resistance at 98,828 that could halt the upward move.
🔼 If the price corrects and reaches 91,945, you can consider a long entry based on the price’s reaction to the supports I mentioned.
👑 BTC.D Analysis
Let’s move on to Bitcoin dominance. On the 4-hour chart, there’s an ascending channel where price is moving, with multiple touches. Right now, it’s testing resistance at 64.91.
☘️ If this level breaks, dominance could move up to the top of the channel. There’s also a very important static resistance at 65.59. If price reaches this area, we need to watch its reaction.
📅 Total2 Analysis
Now onto Total2. Similar to Bitcoin, it had a bullish leg, but corrected more deeply — down to the 0.382 Fibonacci retracement, and now it’s at the 1.01T support.
⭐ If this zone breaks, the next supports are at the 0.5 and 0.618 Fibonacci levels. There’s also a strong support at 980B, and the major bottom is at 932B.
📉 For a short position, breaking 1.01T is suitable. For a long position, a bullish reaction from this same area is a good trigger. The main long trigger is the break of 1.05T.
📅 USDT.D Analysis
Let’s move to Tether dominance. This indicator has reached a major top at 5.19. If this level breaks, it can move upward.
👀 If it breaks, the next resistance is 5.37. This move would coincide with a market correction or drop.
📊 To confirm a bearish Tether dominance (bullish market), rejection from 5.19 is a good trigger. The main trigger is still the break of 4.99.
❌ Disclaimer ❌
Trading futures is highly risky and dangerous. If you're not an expert, these triggers may not be suitable for you. You should first learn risk and capital management. You can also use the educational content from this channel.
Finally, these triggers reflect my personal opinions on price action, and the market may move completely against this analysis. So, do your own research before opening any position.

TradeCityPro | SAND: Critical Support Test After Pullback👋 Welcome to TradeCity Pro!
In this analysis, I want to review the SAND coin for you. It’s one of the most popular Metaverse projects, widely recognized and among the top in its category.
✔️ This project’s coin currently holds a market cap of $693 million and ranks 91st on CoinMarketCap.
⏳ 4-Hour Timeframe
As you can see on the 4H chart, after a bullish leg that pushed the price up to 0.3140, a correction phase began. Following the break of 0.2903, the price has now corrected down to 0.2714.
🔍 If this 0.2714 level breaks, the price could continue down to the support at 0.2437 — so a break below 0.2714 would be a valid short entry.
👀 Personally, I prefer waiting for the price to first bounce off 0.2714, move upward, and print a lower high relative to 0.2903, then break 0.2714 on a second attempt. In that case, the short setup becomes much more reliable.
🔽 That said, even if the level breaks now without a bounce — since RSI is already near the oversold zone — I’ll still open a short. If RSI enters oversold, it could lead to a sharp drop.
⚡️ One negative factor for short positions is that volume has been decreasing since the price started correcting from 0.3140, which isn't a good signal for further downside — there’s a divergence between price and volume.
📈 However, that’s a positive signal for potential long positions. When volume drops during a correction in an uptrend, it shows buyers still have control. As long as this divergence persists, the uptrend is more likely to continue than to reverse.
📊 For long positions, if buying volume enters the market and the price holds above 0.2714, you can enter based on lower-timeframe structure breaks. The main long entry will be confirmed once the price breaks above the 0.3140 high.
📝 Final Thoughts
This analysis reflects our opinions and is not financial advice.
Share your thoughts in the comments, and don’t forget to share this analysis with your friends! ❤️

TradeCityPro | INJUSDT Ready for a Big Move?👋 Welcome to TradeCityPro Channel!
Let’s dive in and analyze one of the popular crypto projects, INJ, which has a high likelihood of movement, and check our entry triggers together.
🌐 Overview Bitcoin
Before starting the analysis, I want to remind you again that we moved the Bitcoin analysis section from the analysis section to a separate analysis at your request, so that we can discuss the status of Bitcoin in more detail every day and analyze its charts and dominances together.
This is the general analysis of Bitcoin dominance, which we promised you in the analysis to analyze separately and analyze it for you in longer time frames.
📊 Weekly Time Frame
On the weekly time frame, I see that the seventh period is stable, INJ, and compared to the majority of altcoins that have their own low price levels, it is in a better space and is engaged in its own supports!
After breaking the primary trend ceiling, namely 9.28, we experienced a sharp upward movement and formed a historical ceiling at $53, and after forming a distribution box and breaking the important floor of 16.20 and pulling back to it, we experienced a continued decline.
We have now reached support again, which was previously a very important resistance, and now, as a result, it is probably not lost, but the weekly candle is a very good and bearish candle! Don’t forget to save your profit, your strategy booklet, and your positions, otherwise, you will have made a 450% move without adding anything to your capital!
📉 Daily Time Frame
On the daily time frame, our trend is completely bearish as you can see, and the events are completely accompanied by the formation of a downward bottom and top, but we are likely to suffer for a while.
After getting rejected from 34.16 and forming a box between 20.16 and 25.93 and losing the bottom, it made a move and then while pulling back with low volume and the next conversion to red, it became an inverted Sharpe, we experienced a decline!
After breaking the daily trendline, which was also an important trendline, its trigger at 8.48 was broken, and we are currently engaged with the resistance at 10.47, and the next and most important trigger, so to speak, is after breaking 10.47, and you can even have a spot buy with this level!
🕓 4-Hour Timeframe
In the 4-hour time frame, we are also ranging between the box of 9.24 to 10.41, and practically, whichever side we break, we can say we can take its position and go along with it!
📈 For a long position, the trigger is completely clear, and after breaking 10.41, make sure to take a long position, and you can even open a position before this trigger breaks with the presence of momentum in lower time frames!
📉 For a short position, we have just formed the support at 9.24, and if we bounce from this support and hit a lower high, or better yet, get rejected before 10.41, we go for a short position and a break of 9.24!
✍️ Final Thoughts
Stay level headed, trade with precision, and let’s capitalize on the market’s top opportunities!
This is our analysis, not financial advice always do your own research.
What do you think? Share your ideas below and pass this along to friends! ❤️

TradeCityPro | Bitcoin Daily Analysis #82👋 Welcome to TradeCity Pro!
Let’s dive into the analysis of Bitcoin and key crypto indicators. As usual, I’ll walk you through the futures triggers for the New York session.
⏳ 1-Hour Timeframe
As you can see, yesterday the price stabilized below 95370 and completed a downward leg to 93626, reacting exactly to the level I pointed out in the previous analysis.
✔️ I mentioned earlier that you could enter a short position after breaking 95370 — but remember, this position is against the higher timeframe trend, so the downward move will likely end once it hits the first support, since the market momentum remains bullish on larger timeframes.
💥 Currently, the price has reacted to 93626 and seems to be resting from the previous downward move. I believe a new range box may form between 95370 and 93626 — if that happens, I’ll go long on a break above 95370.
🔽 For short positions, given the bearish momentum in this timeframe, we can look to re-enter on a break below 93626 in the next retest.
📊 Watch volume and RSI today. The volume of red candles has been much higher than bullish ones, which increases the chance of a deeper correction. If you’re shorting, keep a tight stop-loss, take profits quickly, and treat it as a scalp trade.
📈 For long positions, since it’s against the short-term trend, you’ll need a wider stop — but if the correction ends and a new bullish leg begins, the trade may stay open longer.
🧩 As for RSI: as long as it stays below 50, market momentum is bearish. A break below 30 and entry into oversold increases the likelihood of more downside.
👑 BTC.D Analysis
Bitcoin dominance broke 64.77 yesterday and retraced to 64.60. If this downward move continues, we could see early signs of a trend shift.
✨ Important note: dominance has been in an uptrend on higher timeframes, so a break of 64.60 only confirms a short-term correction. Don’t take it as a trend reversal just yet.
💫 If dominance continues to drop and the market rises, altcoins could outperform Bitcoin. Conversely, if dominance rises again, Bitcoin will rally more than altcoins.
📅 Total2 Analysis
Total2 broke below 1.03 yesterday, retested it, and now looks set to continue downward. The next support is at 1.00 — if you’re already short, consider taking profits at that level.
☘️ We’ll get full trend reversal confirmation with a break below 1.00. For long positions, the 1.05 breakout is extremely important. I strongly recommend not missing that trigger if it happens.
📅 USDT.D Analysis
USDT dominance stabilized above 5.10 yesterday, moving further away from 4.99, and is now testing 5.19. A break above 5.19 would be a strong signal that a deeper market correction is starting.
🔑 On the flip side, a break below 4.99 is still the best and most important trigger to confirm the market’s return to a bullish trend.
❌ Disclaimer ❌
Trading futures is highly risky and dangerous. If you're not an expert, these triggers may not be suitable for you. You should first learn risk and capital management. You can also use the educational content from this channel.
Finally, these triggers reflect my personal opinions on price action, and the market may move completely against this analysis. So, do your own research before opening any position.

TradeCityPro | TIA: Key Support Test in Cosmos-Based Token👋 Welcome to TradeCity Pro!
In this analysis, I want to review the TIA coin for you. This project is one of the protocols in the Cosmos ecosystem and currently ranks 53 on CoinMarketCap with a market cap of $1.51 billion.
📅 Daily Timeframe
As you can see on the daily chart, there's a descending trendline, and the price has been moving down along with it. Currently, the price has reached its main support zone at 2.274.
✨ This is the most critical support for this coin, and if it breaks, the price will move toward a new all-time low. So, buyers will do everything they can to protect this support.
💥 If the price gets supported at this level, the first trigger for opening a long position would be the breakout of the descending trendline. That trigger level is the break of 2.956.
🛒 You can also use this trigger for spot buying. The main trend reversal confirmation comes with a break above 4.324. However, in any case, if any of these triggers are activated, I personally will wait for Bitcoin dominance to show a trend reversal before buying altcoins on spot using the first solid trigger I find.
🔽 For short positions, the key point to remember is that the trend is already downward, so we don’t need a trend reversal confirmation to go short.
⭐ The short trigger is very clear and straightforward — if the 2.274 level breaks, you can enter a short position. Additionally, a pullback to the trendline can also be used as an entry point.
📝 Final Thoughts
This analysis reflects our opinions and is not financial advice.
Share your thoughts in the comments, and don’t forget to share this analysis with your friends! ❤️
