TradeCityPro | Bitcoin Daily Analysis #80👋 Welcome to TradeCity Pro!
Let’s dive into the Bitcoin analysis and key crypto market indicators. As usual, I’ll review the triggers for the New York futures session.
⏳ 1-Hour Timeframe
Yesterday, price made a bullish move and broke the 97139 zone, but later it turned out to be a fake breakout, and now it’s moving downward.
🔍 It’s likely that this downward move is just a pullback toward the SMA99 zone, and price may bounce back up afterward. If SMA99 breaks, deeper corrections down to 95370 are possible.
✔️ In my view, as long as price stays above the 95370 zone, Bitcoin remains in an uptrend. Only once price drops below this level can we start identifying potential bearish triggers.
📈 For now, we need to wait for more structure to develop before entering any positions. The 97139 level still remains a strong bullish trigger, but it’s best to wait for a reaction to it first so we can pinpoint the exact line, and then enter upon its breakout.
⚡️ Nothing more to add about Bitcoin for now — it’s Saturday, a weekend, and the chances of ranging price action are high.
👑 BTC.D Analysis
Looking at BTC dominance, yesterday it made a slight corrective move and pulled back to 64.77, where it seems to have found support.
📊 The next bullish trigger is the breakout of 64.91. Overall, the trend is still bullish, so if you're considering multi-day or swing positions, Bitcoin remains a better choice than altcoins.
📅 Total2 Analysis
Turning to the Total2 chart, this index was rejected from the 1.05 resistance once again yesterday and failed to hold above it. Until that changes, altcoins likely won’t see any significant upward momentum.
🔑 For downside movement in Total2, the trigger remains a break below 1.03.
📅 USDT.D Analysis
Now to Tether dominance — yesterday, this index finally closed a candle below the 4.99 level, but it was a fakeout, and it moved back above, once again preventing the broader market from turning bullish. This fakeout could inject bearish momentum into the market, potentially leading to deeper corrections.
⭐ For now, the 4.99 level still serves as a strong trigger for a bearish USDT dominance and thus a bullish signal for the market. A break above 5.10, however, would be a solid trigger for USDT dominance to trend higher.
❌ Disclaimer ❌
Trading futures is highly risky and dangerous. If you're not an expert, these triggers may not be suitable for you. You should first learn risk and capital management. You can also use the educational content from this channel.
Finally, these triggers reflect my personal opinions on price action, and the market may move completely against this analysis. So, do your own research before opening any position.
Tradecitypro

TradeCityPro | LDO: Watching for Breakout in DeFi Leader’s Range👋 Welcome to TradeCity Pro!
In this analysis, I’m going to review the LDO coin — one of the well-known DeFi projects within the Ethereum ecosystem with a significantly high TVL.
✔️ This project’s token currently has a market cap of $748 million, placing it at rank 86 on CoinMarketCap.
⏳ 4-Hour Timeframe
As you can see on the 4-hour chart, after a downtrend, LDO formed a bottom around the 0.676 zone and managed to rally up to 0.868.
🔍 Currently, the price is consolidating below that resistance in a ranging box. A breakout from either direction of the box could determine the next trend.
⭐ If the box breaks upward and the 0.868 level is breached, we can consider the prior downtrend over, and the price would be forming a new bullish structure. However, there is another resistance at 0.904 right above, and there’s a possibility of rejection from that level after the 0.868 breakout.
📈 For a long position, I personally plan to enter upon the breakout of 0.868. While it’s possible that the price might reverse from 0.904, I prefer having an earlier entry and using a more accessible trigger.
🔽 On the other hand, if the box breaks to the downside, the price might revisit the 0.676 support and potentially start a new bearish leg in line with the longer-term downtrend.
📉 The first short trigger is the break of 0.818 (the lower boundary of the box), but there’s another minor support at 0.795, which may cause a bounce.
👀 I personally prefer to wait for the 0.795 level to break for a short entry, given that market momentum is currently bullish, and I prefer a more reliable trigger for shorts.
📊 Volume within this range has been decreasing, which is normal in such consolidation phases. The longer the price stays in this range, the lower the volume tends to be — and typically, a breakout will lead to a sharper move.
The RSI oscillator also has a support zone at 43.17. If this level is broken, it could signal incoming bearish momentum and increase the probability of a downside breakout.
📝 Final Thoughts
This analysis reflects our opinions and is not financial advice.
Share your thoughts in the comments, and don’t forget to share this analysis with your friends! ❤️

TradeCityPro | Bitcoin Daily Analysis #79👋 Welcome to TradeCity Pro!
Let’s dive into Bitcoin and key crypto index analysis. As usual, in this analysis, I’ll walk you through the futures session triggers for the New York session.
⏳ 1-Hour Timeframe
On the 1-hour timeframe, as you can see, yesterday the price stabilized above the 95370 zone and continued its movement up to 97139.
✔️ The reason the price couldn’t move higher is that the RSI failed to stay above the 70 level and didn’t enter the Overbuy zone — it got rejected there. As a result, the price also got rejected from the 97139 resistance and is currently in a corrective phase.
🧩 The SMA25 indicator has now caught up to the price, and this could bring upward momentum into the market. If that happens, the price might resume its upward move, and breaking the 97139 high could lead to a continuation toward the 98828 zone.
📊 Volume increased during the bullish candles, but after reaching the 97139 high, volume returned to previous levels, and the price has been ranging.
⚡️ Today, if RSI enters the Overbuy zone, a bullish move is very likely — in that case, I recommend definitely holding a long position.
🔽 As for short positions and bearish sentiment on Bitcoin, as I’ve been saying for a while, we should wait for a proper trend reversal before entering short trades.
📈 If the price doesn’t respond to the SMA25 and keeps ranging, the next parameter that could drive bullish momentum is the SMA99.
👑 BTC.D Analysis
Moving to Bitcoin Dominance — BTC.D is still trending upward. Yesterday, after breaking the 64.72 ceiling, it started a new bullish leg, and so far, there’s no sign of trend weakness.
🎲 I suggest waiting for a new structure to form. For now, it’s still rising, and if this continues, Bitcoin will likely outperform altcoins.
📅 Total2 Analysis
Looking at Total2, this index was rejected from the 1.05 resistance yesterday. The reason is that Bitcoin dominance surged, meaning not much money flowed into altcoins, and Total2 couldn’t break its ceiling.
🔼 If BTC.D reverses and pulls back, a lot of capital could move into altcoins — in that case, we can consider opening long positions on altcoins.
📅 USDT.D Analysis
Now to Tether Dominance — another reason Bitcoin couldn’t extend its bullish leg yesterday was this indicator. Support at 4.99 held, preventing money from entering the market, and causing the correction phase.
💫 Currently, the 4.99 level remains a crucial trigger. If it breaks, the main bullish trend in the market could begin. On the other hand, a break above 5.10 would likely push the market into a deeper correction.
❌ Disclaimer ❌
Trading futures is highly risky and dangerous. If you're not an expert, these triggers may not be suitable for you. You should first learn risk and capital management. You can also use the educational content from this channel.
Finally, these triggers reflect my personal opinions on price action, and the market may move completely against this analysis. So, do your own research before opening any position.

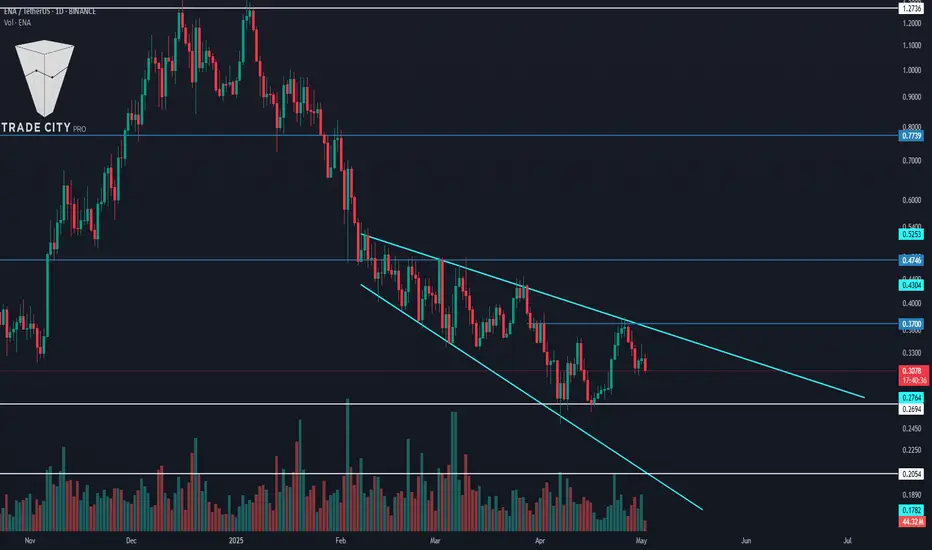
TradeCityPro | ENA: Expansion Pattern Near Critical Break Levels👋 Welcome to TradeCity Pro!
In this analysis, I want to review the ENA coin for you. The Ethena project is one of the DeFi projects in crypto that has attracted a lot of hype in this category.
💥 ENA coin, with a market cap of $1.7 billion, ranks 50th on CoinMarketCap.
📅 Daily Timeframe
As you can see on the daily chart, there is an Expanding Triangle, and the price is fluctuating within this pattern.
📚 One key characteristic of an Expanding Triangle is that while the price is within the triangle, it tends not to respect static levels such as supports and resistances. Currently, the price is within the triangle and, as you can see, it doesn’t respond significantly to static zones.
📈 For this coin to become bullish, the triangle must break to the upside and the triangle trigger at 0.37 should be activated. In that case, the price can move upward and begin a bullish trend. Full confirmation of the bullish reversal will come with price stabilization above 0.4746.
✔️ For continued downward movement, the first trigger is the break of 0.2694. If you already hold this coin, you can use this level as a stop-loss — and once the price closes below it, you can trigger your stop-loss.
📊 For short positions, the break of 0.2694 is a valid trigger, but the issue is that it activates before the triangle breaks, and I personally prefer not to open a position within an Expanding Triangle — I’d rather wait and enter after it breaks.
🔽 Another trigger for a bearish move is the break of 0.2054. This is the main support for ENA, and if it breaks, the price will register a new All-Time Low.
📝 Final Thoughts
This analysis reflects our opinions and is not financial advice.
Share your thoughts in the comments, and don’t forget to share this analysis with your friends! ❤️
TradeCityPro | Bitcoin Daily Analysis #78👋 Welcome to TradeCity Pro!
Let’s get into the analysis of Bitcoin and key crypto indices. As usual, in this analysis I’ll review the triggers for the New York futures session.
⏳ 1-Hour Timeframe
As you can see in the 1-hour timeframe, Bitcoin is finally stabilizing above the 95,370 level. If this movement continues and the price stays above this level, the likelihood of a move up to 98,828 increases.
✔️ Over the past few days, I’ve strongly emphasized that you should open a position once 95,370 breaks. I hope you did, because that entry point was very significant, and breaking it could mark the beginning of Bitcoin’s next bullish leg.
💥 Currently, RSI is entering the Overbought zone, and if that happens, the chances of a sharp upward move increase. Buying volume is also rising, which is expected when a resistance level is broken.
📊 At the moment, opening new positions doesn't make much sense. If you already have an open position, I recommend riding the market momentum and taking profits whenever you notice momentum fading.
👑 BTC.D Analysis
Bitcoin dominance dropped slightly yesterday and returned below the 64.60 level. If this level is broken again, we can reconfirm the bullish sentiment.
🧩 If dominance gets rejected from the 64.60 ceiling, it’s likely to drop back down to the 64.22 support level.
📅 Total2 Analysis
Let’s look at Total2. Yesterday we saw a downward correction that extended to the 1.00 level. If you recall, I previously said I wouldn’t consider a trend reversal confirmed just from the 1.03 break — I’d wait for a break of the 1.00 support.
🔑 That’s why I didn’t close any of my positions at 1.03 and instead waited to see how the price would react at 1.00. As shown, the price reacted strongly at that level and quickly returned above 1.03.
✨ If the 1.05 level breaks, altcoins — just like Bitcoin — could begin a new bullish leg.
📅 USDT.D Analysis
Now let’s look at USDT dominance. Yesterday, it made a bullish move and broke above the 5.10 level, but the entire move turned out to be a fakeout, and the price dropped back below 5.10.
⭐ Currently, dominance is heading toward the 4.99 support. The main trigger for a bullish market shift is the break of this 4.99 level in Tether dominance. If this happens, altcoins will likely begin their bullish moves.
❌ Disclaimer ❌
Trading futures is highly risky and dangerous. If you're not an expert, these triggers may not be suitable for you. You should first learn risk and capital management. You can also use the educational content from this channel.
Finally, these triggers reflect my personal opinions on price action, and the market may move completely against this analysis. So, do your own research before opening any position.

TradeCityPro | FET: AI Token Eyes Breakout After Sharp Rebound👋 Welcome to TradeCity Pro!
In this analysis, I’m going to review the FET coin for you. This project is one of the top AI-related projects in the crypto category.
💫 With a market cap of $1.8 billion, it currently ranks 48th on CoinMarketCap.
📅 Weekly Timeframe
In the previous analysis, I mentioned that if the ascending trendline in this timeframe is broken, the price would make a higher high beyond 3.099, and with the activation of the trendline trigger, we could confirm a trend reversal in this timeframe.
✔️ As you can see, that scenario has played out. After breaking the trendline and the 0.382 Fibonacci level, the price dropped sharply down to the 0.786 level.
✨ The price reaction at this level was very quick, and after hitting this zone, it gained bullish momentum again with a bullish engulfing candle and has now reached the 0.797 area.
📈 If the 0.797 level breaks, the price could experience another sharp upward move. The next resistance levels are 1.095, 2.068, and 3.099 — with 1.095 overlapping with the 0.382 Fibonacci level.
📊 The main confirmation of trend reversal will be given by forming a higher high and higher low above the 0.797 level — confirming Dow Theory.
🔽 For a bearish continuation, the confirmation comes with a break of the 0.786 Fibonacci level. The main support levels are 0.185 and 0.058.
📅 Daily Timeframe
In the daily timeframe, we can better see the details of this bullish move. As observed, the price has had a sharp leg up from the 0.379 bottom to 0.791 without any real correction.
🧩 Given the strength of the 0.791 resistance, a correction is more likely here. If the price moves upward without correction, it’s usually not a good sign for trend sustainability. A healthy trend includes corrections.
🎲 However, if 0.791 breaks and RSI enters the Overbought zone, the price could continue rising toward the 1.128 resistance. While this might not be ideal for trend health, the risk-to-reward ratio makes opening a position worthwhile.
🛒 In my opinion, a correction followed by a new bullish wave would be a more ideal setup, increasing the chances of a breakout. Breaking this level could be a strong trigger for both spot buying and futures positions.
📉 For a bearish scenario, we need to wait for the price reaction to 0.791 and then enter after confirmation of trend reversal. Lower-level triggers would be the breaks of 0.567, 0.455, and 0.379.
📝 Final Thoughts
This analysis reflects our opinions and is not financial advice.
Share your thoughts in the comments, and don’t forget to share this analysis with your friends! ❤️

TradeCityPro | ENSUSDT Huge Breakout Coming? 👋 Welcome to TradeCityPro Channel!
Let’s dive in and analyze one of the DeFi coins, ENS, together. It’s been performing well recently and has some exciting news!
🌐 Bitcoin Overview
Before starting the analysis, I want to remind you that, as per your request, we’ve moved the Bitcoin analysis from the main section to a separate daily analysis. This allows us to discuss Bitcoin’s status in more detail and analyze its charts and dominance together.
This is the general analysis of Bitcoin dominance, which we promised to cover separately and analyze in longer timeframes.
📊 Weekly Timeframe
In the weekly timeframe, ENS is one of the bullish coins in the market with a promising outlook. It began its main upward movement before the start of 2025, back in late 2023.
After breaking the 9.99 level, we entered the main uptrend, and we can say that we broke the market cap ceiling, achieving a new ATH market cap.
We’re also riding a bullish curved line that acts as support. If this line is broken, it signals a weakening of the main uptrend. A drop below 15.90 would indicate a trend change in the MWC (Market Wide Correction).
Currently, our key weekly support has shifted. We were supported at 13.15, easily moving past this level. Our spot exit trigger is now 13.15, whereas last week it was 15.90.
📈 Daily Timeframe
In the daily timeframe, after a rejection from the ATH at 47.68, we entered a range box between 30.75 and 37.77. After some weak movements toward resistance, we saw a corrective wave.
Following a daily engulfing candle that covered the previous three candles, we experienced a sharp downward wave to 13.49. After that, seller pressure seemed to fade, and buyers stepped in. After a fake breakout at 13.49, we saw a move up to 18.41.
Additionally, the trendline formed during the recent declines in this chart was broken after the support at 13.49. However, since the trigger hasn’t been activated yet, we’re not acting on this trendline for now. But if 18.41 is broken, you could consider a risky spot buy.
✍️ Final Thoughts
Stay level-headed, trade with precision, and let’s capitalize on the market’s top opportunities!
This is our analysis, not financial advice always do your own research.
What do you think? Share your ideas below and pass this along to friends! ❤️

TradeCityPro | Bitcoin Daily Analysis #77👋 Welcome to TradeCity Pro!
Let’s dive into the analysis of Bitcoin and key crypto indexes. As usual, I’ll walk you through the triggers for the New York futures session.
⏳ 1-Hour Timeframe
As you can see in the 1-hour timeframe, Bitcoin is still ranging, and volume has decreased compared to yesterday. In times like these when market volume is low, you need to pay closer attention.
✔️ Today, I’ve drawn an ascending trendline on the chart. When price performs very shallow corrections after an uptrend and each low is higher than the previous one, it indicates a very strong bullish trend. So if this trend continues, it can lead to some very attractive trade setups.
💥 As mentioned, volume is quite low today, and volatility is also lower than before. This means that most market participants are waiting to see what will happen before reacting. We should take the same approach and wait for our triggers to be activated.
📈 For a long position, it’s pretty clear that Bitcoin has a very important resistance at the 95370 level, which is currently the only long trigger. If you don’t have a position from lower levels, this is a very logical and attractive entry, and I suggest having a position ready if this level breaks.
📊 For a bearish scenario, we haven’t yet received confirmation, and we need to wait until at least the trendline is broken. After that, with the activation of a trendline trigger like the 93626 level, we can enter a short position.
👀 As I’ve said in previous analyses, I personally won’t open a short position unless Bitcoin reaches the 91945 level, as that’s my first confirmation for a trend reversal.
👑 BTC.D Analysis
Let’s check Bitcoin Dominance. The dominance range box continues, and yesterday it again moved upward from the 64.22 support and reached the range top at 64.60.
☘️ If you had opened a position on altcoins like ETH after their triggers activated yesterday, you probably hit stop-loss because of this dominance move. As dominance moved up after those triggers, capital flowed out of altcoins, causing many of them to fake out and fall back below their resistance.
📅 Total2 Analysis
Now for Total2. Just like Bitcoin, Total2 is forming a range box, but it has significantly less bullish momentum. While Bitcoin has some upward slope during its range, Total2 is completely flat and oscillating between 1.03 and 1.05.
⚡️ Triggers for Total2 remain unchanged: breakout of 1.05 for bullish confirmation and 1.03 for bearish. But just like I mentioned that I won’t act on Bitcoin’s 93626 break and will wait for 91945, here I also won’t act on a 1.03 break—I’ll wait for confirmation below 1.00.
📅 USDT.D Analysis
Let’s move to Tether Dominance. A new lower high has formed just below 5.14, and for now, I’ve adjusted the resistance level to 5.10, because as you can see, the price is reacting well to this area and we can use it as a trigger.
🧩 For a bearish USDT.D scenario (which would mean bullish for the market), breaking below 4.99 remains the key trigger. For a bullish USDT.D scenario, breaking above 5.10 would be the first confirmation of a shift in dominance upward.
❌ Disclaimer ❌
Trading futures is highly risky and dangerous. If you're not an expert, these triggers may not be suitable for you. You should first learn risk and capital management. You can also use the educational content from this channel.
Finally, these triggers reflect my personal opinions on price action, and the market may move completely against this analysis. So, do your own research before opening any position.

TradeCityPro | QNT: Ranging Near Key Resistance in RWA Favorite👋 Welcome to TradeCity Pro!
In this analysis, I want to review the QNT coin for you. This project is one of the RWA projects that has been heavily hyped in recent months.
✔️ Currently, this coin has a market cap of $908 million and ranks 72 on CoinMarketCap.
⏳ 4-Hour Timeframe
On the 4-hour timeframe, as you can see, there is an upward trend along with a curved trendline that has caused the price to move from the bottom of 59.9 to 76.8.
💫 After the price reached the resistance at 76.8, a ranging box has formed, and volume has also been decreasing. A temporary support bottom has formed at the 73.8 area, and the price is ranging between these levels.
📊 Now, with the ranging box that has formed, the price has reached the curved trendline, and this trendline can potentially lead to bullish momentum entering the market.
💥 On the other hand, the RSI oscillator is also on important support at the 50 level, and if the price is supported by this trendline, the RSI moves upward again, and volume increases, we can enter a long position with the breakout of 76.8.
🔍 An important point about this entry is that there is a very strong resistance at the 80.1 area, and if you enter a position on the breakout of 76.8, you probably won't see much profit until the price reaches 80.1.
🎲 So basically, the 76.8 trigger is a preliminary trigger for the breakout of 80.1, and if I open a position on the breakout of 76.8, I won’t close it at 80.1 and will wait to see if the price breaks through the 80.1 area or not. In my opinion, this position is worth the risk because if 80.1 breaks, a very large reward could result from this position.
🔽 But if you want to take less risk, you can wait and open your position with the breakout of 80.1 itself. Naturally, since this area is a major resistance and the entry point is higher than 76.8, opening a position at that level will be harder and the likelihood of getting a proper confirmation candle is lower than with 76.8.
📉 For a short position, if we want to get a trigger from the chart itself, considering the decreasing volume and price reaching the curved trendline, if this trendline breaks and the 73.8 trigger is activated, we can enter a position. RSI confirmation would also be the break of the 50 area, and with that break, we could also get momentum confirmation.
🔑 But the point is that we must also consider market conditions. For example, in the current market conditions, the overall trend of Bitcoin and indexes like Total and Total2 has been bullish in recent weeks, and we can’t get bearish confirmation from these indexes.
✨ So it's possible that with the break of 73.8, the price moves downward, but because the indexes I mentioned also affect altcoins, with the continuation of their bullish trend, the downtrend of QNT may come to an end and its trigger may become a fakeout. That's why it’s better to wait for Bitcoin and the indexes to confirm a trend reversal before looking for short triggers.
📝 Final Thoughts
This analysis reflects our opinions and is not financial advice.
Share your thoughts in the comments, and don’t forget to share this analysis with your friends! ❤️

TradeCityPro | Bitcoin Daily Analysis #76👋 Welcome to TradeCity Pro!
Let’s dive into the Bitcoin analysis and key crypto indices. As usual, in this analysis I’ll review the futures triggers for the New York session.
⚡️ Not much has changed since yesterday, so without reviewing the previous analysis, let’s get into today’s setup to see what positions we can open.
⏳ 1-Hour Timeframe
As you can see on the 1-hour timeframe, the price is still within its range box. Even though yesterday it tested the lower range once and we expected a breakout to the upside, that didn’t happen, and the price was rejected from the 95370 resistance and continued to range.
✔️ After the rejection from this level, volume began to decline, which is a good sign. The lower the volume gets, the sharper the breakout move from the box is likely to be.
💥 If 95370 is broken, I definitely recommend having an open position, as the risk of hitting the stop loss is worth the potential gain. The target in case of a breakout will be the 98828 resistance.
⭐ The SMA99 is also providing good support and is currently sitting below the candles, which adds to the positive bias for this scenario.
🎲 If the price gets rejected from the resistance again, we’ll likely see more range-bound action today. But due to the strong bullish momentum, I don’t think the price will lose its support levels, and it’s likely to test 95370 again.
💫 That said, if I observe structural changes and see support levels like 91945 breaking, I’ll also be ready to take short positions.
🔽 However, for shorting, I think we should wait for more structure to form. Once the price shows more reaction to the 93626–95370 range box, and if 93626 breaks, we can enter a short. But right now, I’d personally wait for a break of 91945 before going short.
👑 BTC.D Analysis
Moving on to Bitcoin dominance, the range box is still intact, and price is above the 64.22 level. If Bitcoin breaks the 95370 resistance and BTC.D continues to rise without breaking below 64.22, then Bitcoin will outperform altcoins. If 64.41 is broken, we can expect a sharp bullish move in Bitcoin.
📊 To enter positions on altcoins, the best confirmation remains the break of the 64.22 level on BTC.D.
📅 Total2 Analysis
As for Total2, the 1.05 resistance still hasn’t been broken. To confirm the beginning of a bullish move in altcoins, we need a breakout of this level. The first target of this move would be the 1.07 resistance.
📉 To turn bearish, the first trigger is at 1.03. We’ll need to wait for the price to test it, so we can determine the precise level and react accordingly in future retests and breakouts.
📅 USDT.D Analysis
USDT.D behaves slightly differently from Bitcoin and Total2. While Bitcoin and Total2 are both near resistance and poised for a breakout, USDT.D is still some distance from the 4.99 support.
☘️ The probability of this support break coinciding exactly with Bitcoin and altcoin triggers is low. However, I believe this is a more significant trigger than Total2’s.
❌ Disclaimer ❌
Trading futures is highly risky and dangerous. If you're not an expert, these triggers may not be suitable for you. You should first learn risk and capital management. You can also use the educational content from this channel.
Finally, these triggers reflect my personal opinions on price action, and the market may move completely against this analysis. So, do your own research before opening any position.

TradeCityPro | RENDER: AI Token at Breakout or Breakdown Point👋 Welcome to TradeCity Pro!
In this analysis, I want to review the RENDER coin for you. This project is one of the crypto AI projects that gained a lot of hype after AI projects started trending.
🔍 The coin of this project currently has a market cap of $2.36 billion and ranks 45th on CoinMarketCap. Let’s move on to the analysis to see the technical condition of this coin.
📅 Daily Timeframe
As you can see in the daily timeframe, after the drop shown in the chart, with the price falling to the 2.774 area, a ranging structure has formed, and the top of this box is at the 4.52 level.
⭐ Currently, the price has reached the top of the box and is interacting with this level. If the box top is broken, the main bullish trend can begin, and the price may move toward the 6.682 area.
🎲 If this happens, pay attention to the volume, because the volume should increase alongside the price movement and be in convergence. If a large buying volume enters the market, the probability of this scenario increases.
📈 So for spot buying or opening a long position, you can enter on the breakout of 4.520.
🔽 To confirm the market turning bearish, we need to confirm the end of the current bullish leg. If the price gets rejected from the box top or if a fake breakout happens, a break of 4.119 confirms the rejection, and in that case, the price can move back down to the box bottom.
💥 The support levels ahead for the price are 3.513 and 2.774, which can be used as targets for short positions.
📊 The main trigger for the beginning of the next bearish leg is the 2.774 area. If this level is broken, the price will likely make a sharp downward move.
📝 Final Thoughts
This analysis reflects our opinions and is not financial advice.
Share your thoughts in the comments, and don’t forget to share this analysis with your friends! ❤️

TradeCityPro | Bitcoin Daily Analysis #75👋 Welcome to TradeCity Pro!
Let’s move on to Bitcoin and major crypto index analysis. As usual, in this analysis, I want to review the triggers for the New York futures session for you.
🔄 Yesterday's Analysis
In yesterday's analysis, I told you that if the price stabilizes below 93626, I expect a correction down to 91945.
However, this didn’t happen and the price faked below this area and moved back up, and now its trigger has been activated.
Let’s move on to today’s analysis to see what triggers are suitable for today.
⏳ 1-Hour Timeframe
In the 1-hour timeframe, as I said, the price faked downwards and moved up again, activating the first trigger at 94421.
The 94421 trigger was a preliminary trigger for the breakout of 95306, so if you opened this position, I suggest you wait to see if the price breaks the 95306 resistance or not.
✔️ The main trigger for a long position is still the breakout of 95306, which can start the next bullish leg for Bitcoin.
If you plan to open a position upon the breakout of this area, pay attention to the volume, and if volume increases at the same time, I suggest you definitely have a position.
💥 In the RSI oscillator, as you can see, the divergence we had in the previous bullish leg has been activated, and we can see its effect in the market, and now a new structure is forming, getting close to the Overbuy area.
⚡️ If RSI enters Overbuy and the 95306 resistance is broken, we could see a sharp and fast move toward the 98828 resistance.
📉 For a short position and for Bitcoin’s trend to turn bearish, yesterday I told you we have a risky trigger at the break of 93626, but I personally wouldn’t open a position with this trigger because it’s risky and I prefer to wait for a confirmed trend change.
🔍 Currently, the trigger I have for a trend change in Bitcoin is the break of 91945 and forming a lower high and lower low below this level. Otherwise, we should wait to see if a new structure for a trend change forms in the coming days.
👑 BTC.D Analysis
Let’s move on to Bitcoin Dominance analysis.
As you can see, Dominance has finally exited the range it had formed between 64.19 and 64.41, breaking 64.19 and moving downward.
🧩 If this decline continues, the next major support area for Dominance is 63.67, and Dominance could fall to this level.
If this happens simultaneously with Bitcoin’s rise, altcoins could experience a lot of sharp bullish moves.
📅 Total2 Analysis
Let’s move on to Total2 analysis.
As you can see, this index also faked the floor it had formed, and this fake breakout has brought bullish momentum into the market, and now it has managed to stabilize above 1.05.
⭐ The reason Bitcoin is still struggling with its resistance and hasn’t broken it yet is because Bitcoin Dominance is decreasing, causing Bitcoin to move upward slower than Total2.
📊 Currently, the next resistance for Total2 is the 1.07 area, and the probability of the price reaching this level is high.
If this bullish move gets faked, breaking 1.03 will be a good short trigger.
📅 USDT.D Analysis
Let’s move on to Tether Dominance analysis.
I believe the market is still waiting for Tether Dominance to move out of the range box formed between 4.99 and 5.14.
🚀 If the 4.99 level is broken, it can confirm that the market is turning bullish.
I think this trigger could start Bitcoin’s move toward a new ATH.
🎲 If 5.14 is broken instead, we can confirm the end of the bullish trend that the market has had in recent days.
❌ Disclaimer ❌
Trading futures is highly risky and dangerous. If you're not an expert, these triggers may not be suitable for you. You should first learn risk and capital management. You can also use the educational content from this channel.
Finally, these triggers reflect my personal opinions on price action, and the market may move completely against this analysis. So, do your own research before opening any position.

TradeCityPro | Deep Search: In-Depth Of ONDO👋 Welcome to TradeCity Pro!
In this analysis, I want to fully review the ONDO project for you. First, I’ll go over the project’s information, and then we'll move on to its technical analysis.
🔹Introduction to Ondo Finance (ONDO)
Ondo Finance is an open and decentralized investment bank designed to bridge the gap between traditional finance and decentralized finance (DeFi). Founded in 2022 and based in the Cayman Islands, Ondo's mission is to democratize access to institutional-grade financial services. Its ecosystem is built to serve a wide range of stakeholders including DAOs, institutional players, and retail investors. Ondo's key innovation lies in tokenizing real-world assets, thereby making them accessible to a broader audience via blockchain technology.
🔹ONDO Token and Governance
The ONDO token plays a central role in the governance of the Ondo decentralized autonomous organization (DAO). Token holders have specific rights within the DAO, particularly over the governance of Flux Finance, which is one of the main platforms in the Ondo ecosystem. ONDO holders are empowered to propose and vote on changes, allocate funds for projects, and influence the platform’s direction, ensuring community-driven governance. The ONDO token sale occurred in mid-2022 and was purchased by over 18,000 individuals.
🔹Technology and Infrastructure
Ondo leverages blockchain technology to offer decentralized financial services. It operates on a secure and transparent distributed ledger system, which ensures that transactions are immutable and resistant to tampering. The platform uses Proof-of-Stake (PoS) as its consensus mechanism to validate transactions, offering both security and energy efficiency. Ondo is also integrated with various DeFi protocols and utilizes techniques from traditional finance to repackage DeFi exposures into institutional-grade risk-return profiles. Strategic partnerships with firms like BlackRock, Morgan Stanley, and Coinbase enhance its interoperability and credibility.
🔹Real-World Use Cases
Ondo's primary application is in the tokenization of real-world assets such as real estate or treasuries. This allows users to invest in fractionalized assets, lowering the barrier to entry for institutional-quality financial products. The platform is used for intellectual property management through blockchain-based records, enabling secure and transparent tracking. Ondo also engages in community events and educational initiatives to raise awareness about blockchain technology. Furthermore, it offers technical and business development services such as smart contract deployment and treasury management to startups and institutions.
🔹Key Developments and Milestones
In 2022, the Ondo DAO was officially launched, providing a decentralized governance framework. Following that, the foundation introduced Flux Finance, a major protocol under Ondo DAO governance. The Ondo Foundation has formed several partnerships to expand its ecosystem and drive innovation. One of the important initiatives includes Ondo USDY LLC, which issues the USDY stablecoin. Ondo has also focused on education, contract deployment, and treasury management, solidifying its operational backbone and long-term strategic vision.
🔹Team and Founders
Ondo Finance was founded by Nathan Allman and a team of former Goldman Sachs digital asset professionals. Nathan Allman brings a strong background in engineering and financial operations, serving as a key driver of the project’s vision. The founding team’s experience in traditional finance has been instrumental in shaping Ondo’s hybrid model, which integrates DeFi tools with institutional-grade strategies.
🔹Fundraising and Token Sale
Ondo Finance has conducted multiple fundraising rounds. An initial coin offering (ICO) took place on CoinList on May 12, 2022, raising $22 million. The token was priced at $0.055, with a minimum purchase of $100 and a maximum of $20,000. Another funding round was the IEO on Gate.io Startup, conducted from January 17 to January 18, 2024, which raised $40,000.
In total, Ondo has raised $46.04 million, including $22.04 million from public sales and $24 million from private and institutional funding rounds.
🔹Tokenomics
The ONDO token has a maximum supply of 10 billion tokens. Distribution is divided as follows: 52.1 percent for ecosystem growth, 33 percent for protocol development, 12.9 percent for private sales, and 2 percent for community access sales. As of now, 33.9 percent of the total supply is unlocked, with another 19.4 percent scheduled for future unlocks. Approximately 46.7 percent remains locked.
🔹Vesting Schedule
The vesting of ONDO tokens is structured into distinct categories. Ecosystem growth tokens are released linearly over five years, with 24 percent unlocked as of January 2024 and 39.2 percent expected to unlock gradually. Protocol development tokens have a one-year cliff, followed by a three-year linear unlock, with 25 percent becoming available in April 2025. Private sales follow the same schedule as protocol development, while community access sales were 90 percent unlocked from the beginning with full linear unlock over one year.
—
Certik: 87.50✅
🔹Top Ondo Wallets
Trust Wallet
imToken
MetaMask
Torus
Coinbase
TokenPocket
iToken Wallet
Binance web3 wallet
🔹Liquidity Pools
Uniswap
Balancer
🔹Top Holders
0x677fd4ed8ae623f2f625deb2d64f2070e46ca1a1
0x460ae5a6666fcb9635ba99b541b31279e59665370x
524083970c7a1e62fbaa61d38781f87a4f191fd0
0xa63eace47618b9677261b09b32e3ca2b5c0a0182
0xd2e6e930e25456ffcd4df0124563cc334f3284f4
🔹Significant TVL Growth in Ondo Despite Sharp Liquidity Decline
Since mid-January 2025, the total value locked (TVL) in Ondo has increased from 157,000 ETH to 631,000 ETH, reflecting significant growth in its TVL. However, in terms of liquidity, Ondo has experienced a sharp decline since late March, with a drop of nearly 50% compared to the previous month.
🔹On-Chain Analysis of ONDO
Looking at ONDO’s on-chain data, the $0.833 level stands out as a key support zone based on the concentration of tokens currently in profit. On the flip side, the $0.856 area acts as a resistance level, with approximately 124 million ONDO tokens currently held at a loss. However, the volume of tokens in profit remains higher overall, which can be interpreted positively — these zones represent value and may attract increased demand.
From a network activity perspective, there has been a noticeable decline, particularly in the number of new addresses being created.
Analyzing supply and demand, approximately 75% of ONDO tokens are held by whales, indicating strong whale dominance. Address-level data shows that wallets holding between 10 and 100 million tokens have shown minor demand, while older holders are contributing meaningful inflows. Additionally, wallets identified as "investor" addresses have also demonstrated renewed buying interest.
👀 Now that we’ve reviewed the project's details, let’s dive into ONDO’s technical analysis.
📅 Weekly Timeframe
In the weekly timeframe, as you can see, there aren't many candles yet, so we can’t perform a complete analysis on this timeframe.
✔️ However, you can observe that after the project launched in January 2024, there was an upward movement up to the 1.3927 area, followed by a correction down to 0.5871.
💥 After this correction, the next bullish leg continued up to the 2.0565 area.
📈 During this bullish cycle, there’s also an ascending trendline that the price has reacted to multiple times, and now it has touched it again.
⚡️ The main support on this timeframe is at 0.5871, and the main resistance is at 2.0565. So, if you already hold ONDO and are considering setting a stop-loss, breaking 0.5871 could be a good point to activate it.
🔽 This level can also be used as a trigger for a short position. Breaking 0.5871 could create a downtrend in ONDO.
🛒 For spot buying, the main trigger is breaking 2.0565, and if this level is broken, the price could register a new ATH.
📅 Daily Timeframe
In the daily timeframe, as you can see, the price has been supported by the trendline and has shown a very quick reaction, with bullish momentum pushing it above the 0.9253 resistance.
📊 Currently, the price has reached the SMA99 and reacted to it. The volume of the candles reacting to the SMA99 has increased, and if the price stabilizes above the SMA99, the main bullish leg could begin.
💫 The next resistance the price faces is at 1.1933, and if the SMA99 is broken, I believe the price can easily rise to this level.
☘️ Moreover, if this level is also broken, the price could climb up to 2.0565.
📉 For ONDO to turn bearish on this timeframe, the first trigger would be a fake breakout above 0.9253.The main bearish trigger would be breaking both the trendline and the 0.7122 level.
📝 Final Thoughts
This analysis reflects our opinions and is not financial advice.
Share your thoughts in the comments, and don’t forget to share this analysis with your friends! ❤️

TradeCityPro | Bitcoin Daily Analysis #74👋 Welcome to TradeCity Pro!
Let's move on to Bitcoin and major crypto index analysis. As usual in this analysis, I want to review the triggers for the New York futures session for you.
⏳ 1-Hour Timeframe
In the 1-hour timeframe, as you can see, after the price was rejected from the 95306 area, it formed a short-term box between 93898 and 95306, and currently, the price is moving out of this box.
✔️ As you can see, after a large red candle and a second rejection from 95306, a lot of bearish momentum and selling volume entered the market, and now the price has broken the 93898 support. If the price stabilizes below this level, there is a possibility of a deeper correction down to 91945.
💥 The SMA99 indicator overlaps with the 93989 area, and if this PRZ (Potential Reversal Zone) formed by the price is broken, the probability of a further drop will increase.
⚡️ The RSI oscillator has also activated its divergence, and now we are seeing the effect of this divergence in the market. For a short position, if the 93898 area is broken, we can enter.
📈 For a long position, if the 93898 area gets faked out, we can enter a long with a fake breakout trigger in lower timeframes. The main trigger for a long is the break of 95306.
👑 BTC.D Analysis
Let's move on to Bitcoin Dominance. There is still a ranging box between 64.19 and 61.60, and the price is fluctuating between these two levels.
✨ Currently, confirmation for bullishness comes with a break of 64.60 or 64.41, and bearish confirmation comes with a break of 64.19.
📅 Total2 Analysis
Moving on to Total2, a ranging box has formed in this index between 1.03 and 1.05. These areas are suitable triggers for opening positions.
🧩 For a long position, a break of 1.05 could start the next bullish leg, with a target of 1.07.
🔽 For a short position, with a break of 1.03, the price could make a corrective move.
📅 USDT.D Analysis
Moving on to Tether Dominance, it is still struggling with the 4.99 support area and hasn't been able to stabilize below it.
📊 As long as this support holds, the next bullish leg in the market will not start. On the other hand, as long as dominance is below 5.14, the market trend remains bullish.
❌ Disclaimer ❌
Trading futures is highly risky and dangerous. If you're not an expert, these triggers may not be suitable for you. You should first learn risk and capital management. You can also use the educational content from this channel.
Finally, these triggers reflect my personal opinions on price action, and the market may move completely against this analysis. So, do your own research before opening any position.

TradeCityPro | Bitcoin Daily Analysis #73👋 Welcome to TradeCity Pro!
In this analysis, I want to give you a complete review of Bitcoin. There are just a few days left until the monthly candle closes, and it’s been a while since I analyzed higher timeframes for you, so it’s a good time to do that now.
📅 Monthly Timeframe
In the monthly timeframe, it’s very clear that Bitcoin has a long-term uptrend, which is still ongoing. The new leg of this trend started from the 16162 bottom and has so far extended to 104857.
⚡️ In the past few candles, the price has entered a phase of correction and consolidation, which is perfectly natural and necessary for the trend’s health. However, because this is happening on the monthly timeframe and takes months, some traders and market participants might think the uptrend has ended.
✔️ First of all, Bitcoin’s uptrend has not ended yet. We’ve just seen two red monthly candles, and now with this month's candle, bullish momentum is reentering the market. I believe the price can register a new all-time high (ATH). Even if that doesn’t happen, remember that Bitcoin’s dominance is very high, and this bullish cycle won’t last forever—eventually, Bitcoin dominance will start to fall.
🔍 If that happens and the percentage of money inside Bitcoin decreases, this capital will shift into altcoins. With this large inflow of capital, an altcoin season will begin.
📊 My personal view is that Bitcoin will have one more bullish leg toward 130,000 or 180,000, and after that, dominance will start to drop and the altcoin season will begin. Initially, Bitcoin will move upward, followed by strong, large-cap altcoins like Ethereum, BNB, XRP, etc. After these big players rally, capital will shift into good low-cap projects, leading to the crazy crypto pumps we've seen in previous bull runs.
🔽 This is the scenario I find most likely. But if the market moves against this scenario and dominance shifts earlier or later, I will adapt accordingly without being rigid in my analysis.
✨ As for Bitcoin turning bearish, I think that’s very unlikely for now, and the triggers for that are still far away from the current price. If that scenario becomes more probable, I’ll update my analysis and discuss it.
In short, for Bitcoin to turn bearish, it would need to make a lower high and a lower low compared to 104000, and if a sharp downtrend is to happen, the price must establish below 58000.
📅 Weekly Timeframe
In the weekly timeframe, we can see the bullish movement in more detail. A bullish move started from the 16162 bottom and after three bullish legs, the price reached the 104857 resistance.
💫 Currently, the price is in the correction phase of the third bullish leg and had pulled back close to the previous high of 71520. After forming a bullish engulfing candle, bullish momentum has returned, and the price is moving back toward 104857.
🎲 The 104857 area overlaps with the 0.618 Fibonacci Extension, creating a strong PRZ (Potential Reversal Zone). If this high breaks, the next resistance levels are the 0.786 and 1 Fibonacci levels, roughly around 125000 and 155000.
👀 There’s also a visible trendline in this timeframe that the price has touched three times, and each time the trendline bottom coincided with RSI support. However, the last time the price touched the trendline, it made a fakeout, which can be observed both on the price chart and on RSI.
⭐ This fakeout could inject even stronger bullish momentum and drive the price higher. But for this to happen, the current bullish leg must break above 104857—otherwise, the scenario fails, because if buyers truly have strength after a trendline breakout, they should be able to break the previous high.
☘️ If this doesn’t happen, it signals weakness, and the price could move back toward the 71000 support, with an increased probability of breaking it.
💥 In previous analyses, I also mentioned that during this bullish cycle, RSI has accurately indicated market bottoms each time it touched the 45.17 support level. This has happened again, and I hope you were able to benefit from it.
📅 Daily Timeframe
In the daily timeframe, as you can see, using the bullish leg up to 106247, we can draw a Fibonacci Retracement.
🔑 In the initial correction phase after reaching 106247, a box was formed between the 0.236 Fibonacci level and the 106247 top. After the 0.236 Fibonacci level, which overlapped with 90958, was broken, a deeper correction occurred down to the 0.5 Fibonacci level.
🔄 A descending trendline can also be drawn on the chart. As I mentioned in Bitcoin analysis #52, I advised spot buying upon the breakout of this trendline. I hope you were able to take full advantage of that opportunity.
📚 After the price reached the 0.5 Fibonacci level, a strong reaction occurred, and after activating the 87360 trigger, the price began a bullish move with strong buying volume and sharp candles, climbing back above 90958. If it holds above this level, it could move back toward the 106247 top.
💥 The RSI oscillator has increased significantly during this bullish move and is now near the Overbuy zone. If RSI enters the excitement zone, the likelihood of a sharp move toward the main resistance increases, and if RSI stabilizes above this zone, the probability of breaking the 106247 top will be very high.
📉 Currently, strong bullish momentum has entered the market, so we can expect a solid uptrend to continue. However, if the price falls back below 90958 before reaching the 106247 top, it would suggest that the entire bullish move was a fakeout, and bearish momentum could enter, pushing the price lower toward the 0.618 or even 0.786 Fibonacci levels.
⏳ 4-Hour Timeframe
Let’s check the 4-hour timeframe for futures triggers.
✔️ As you know from previous analyses, we had two main entry points for long positions at 85697 and 88289, and I hope you managed to open positions based on those.
💣 Currently, the price has reached the 95173 resistance and is being rejected. The RSI oscillator also shows a divergence, and if the 64.4 level breaks on RSI, temporary bullish momentum could fade.
🔼 In case of correction, the supports we currently have are at 92109 and 88289. For more levels, we’ll need to wait for a proper correction to use Fibonacci tools.
📈 For a long position, you can enter on the breakout of 95173. The next price target will be 98828.For a short position, we still need to wait for a proper trend reversal.
❌ Disclaimer ❌
Trading futures is highly risky and dangerous. If you're not an expert, these triggers may not be suitable for you. You should first learn risk and capital management. You can also use the educational content from this channel.
Finally, these triggers reflect my personal opinions on price action, and the market may move completely against this analysis. So, do your own research before opening any position.

TradeCityPro | Bitcoin Daily Analysis #72👋 Welcome to TradeCity Pro!
Let’s move on to Bitcoin analysis and the major crypto indexes. As usual, in this analysis, I’ll be reviewing the New York futures session triggers for you.
🔄 Yesterday’s Analysis
In yesterday’s analysis, I gave you a long trigger and said that if the price is supported at the 92007 area and moves toward 94283, you can enter the position after the breakout. This has happened now, and a few hours ago a candle closed above this area. Now we’ll have to see whether the price movement will continue or if it was a fakeout.
⚡️ Nothing else special has happened and for now, only the trigger is active. Personally, since I already had a Bitcoin position open, I opened this one on an altcoin instead, but Bitcoin was a better choice because dominance is rising again, and if you didn’t already have a position on Bitcoin, it would’ve been better to open one there.
Let’s get into the analysis to see how the market looks today.
⏳ 1-Hour Timeframe
As you can see, I placed a Fibonacci Extension over the bullish leg that started after the breakout of the 85550 level, and the 0.236 Fibonacci level overlaps with the 92007 level, where the price was supported.
💥 When the price rises from the 0.236 Fibonacci level, it means the trend strength is very high, and the price can easily start the next bullish leg. As you can see, that’s exactly what happened—the price quickly moved up to 94283 and is now above that level.
📚 So when the trend is this strong, rising from 0.236 and breaking the previous high, the next leg should start. If that doesn’t happen, it means there’s significant weakness in the uptrend. So if the price doesn’t move upward today and falls back below 94283, it would indicate strong trend weakness, and the likelihood of deeper corrections to lower Fibonacci levels like 0.382 or 0.5 will increase.
📈 For longs, as I told you yesterday, you can enter on the breakout of 94283, which is now active, but the price hasn’t started its move yet. So if you haven’t entered on this trigger, you can enter on a pullback to this level.
🔽 For shorts, even though I said a move back below 94283 would indicate significant weakness, always remember that weakness doesn’t mean trend reversal—it’s just a sign.
We confirm the trend reversal with a break of 92007 and the formation of lower lows and highs under this support. This would be the first short trigger and is considered quite risky.
📊 If you look closely, market volume has increased after the breakout. This shows a battle between buyers and sellers, and we need to see which side wins so we can join the winning team.
🧩 Also, pay attention to the RSI oscillator today. If RSI enters Overbought again, there’s potential for another sharp bullish move.
👑 BTC.D Analysis
Let’s look at Bitcoin dominance. BTC.D finally tested the 64.12 level and was supported there. Because of this volatility and the V-pattern formed in dominance, most altcoins activated their long triggers. But as dominance started rising again, altcoins fell back below their resistance levels, and if you had opened positions, there was a high chance you hit stop-loss. We can see this more clearly in the Total2 chart.
✔️ For BTC.D to continue rising, confirmation of the V-pattern through a breakout of 64.41 could act as a good trigger, with a move up to at least 64.60. However, the main trigger for the next bullish leg in BTC.D is a breakout above 64.60.
📅 Total2 Analysis
Let’s look at Total2. As I mentioned, most altcoin triggers were activated but didn’t follow through, and some even dropped and returned to their lows. This can be seen in Total2 as well.
✨ The reason for this is that money initially flowed into altcoins, activating their triggers. But simultaneously, Bitcoin’s trigger was also activated, and since BTC dominance rose, not much volume flowed into altcoins. That’s why Total2 is currently ranging around its 1.04 trigger level.
🔍 Regarding Total2, just like Bitcoin, this index was supported at the 0.382 Fibonacci level and activated its trigger at 1.04. A bounce from 0.382 indicates strong bullish trend momentum. (Bitcoin bounced from 0.236, which means BTC has an even stronger uptrend than Total2.)
🎲 So once the 1.04 trigger is activated, considering the strong trend momentum, a strong uptrend should start. If this doesn’t happen in the next few candles, the price will likely fall back below 1.04, and bearish momentum could enter the market.
📅 USDT.D Analysis
Let’s look at Tether dominance. As I’ve said in previous analyses, I believe the market is still moving in sync with USDT.D, and now it’s waiting for the 5% level to be broken.
🔑 That’s why Bitcoin and Total2 have both activated their triggers but haven’t started their major moves yet. In this bullish cycle, USDT dominance appears to have more weight than other indicators. I think the entire market is waiting for the 5% level in this index to break so that capital flows into Bitcoin and altcoins.
🔼 I recommend that if the 5% level breaks, be sure to have at least one long position open.
❌ Disclaimer ❌
Trading futures is highly risky and dangerous. If you're not an expert, these triggers may not be suitable for you. You should first learn risk and capital management. You can also use the educational content from this channel.
Finally, these triggers reflect my personal opinions on price action, and the market may move completely against this analysis. So, do your own research before opening any position.

TradeCityPro | ALGO: Key Levels in RWA Coin’s Bullish Revival👋 Welcome to TradeCity Pro!
In this analysis, I’m going to review the ALGO coin for you. This project is one of the RWA (Real World Assets) crypto initiatives, which saw significant growth during the recent hype around this category.
💫 Currently, the market cap of this project stands at $1.99 billion, placing it at rank 47 on CoinMarketCap among crypto projects.
📅 Daily Timeframe
As you can see in the daily timeframe, ALGO has had a notable bullish leg that started from the 0.1085 level and continued up to 0.5138, marking a significant upward move.
💥 However, after reaching that level, the first corrective phase took place down to the 0.3267 support. After breaking this zone, the price continued falling to the 0.1602 support, which also overlaps with the 0.786 Fibonacci level.
🔍 After finding support there, a new high formed at 0.2147, and thanks to the strong buying volume and bullish candles, this resistance has been broken, and price is now heading upward.
📊 The RSI oscillator is currently very close to the Overbought zone, and if it enters that area, we might see some high-volatility moves, increasing the likelihood of sharp bullish candles.
📈 The next resistance levels above are 0.2553 and 0.3267, which align with the 0.5 and 0.382 Fibonacci levels respectively. If price can break through these levels and return to 0.5138, the chances of breaking that top will be significantly higher this time.
✨ On the other hand, if this breakout turns out to be a fake move and price falls below 0.2147, heavy bearish momentum could enter the market, greatly increasing the risk of breaking the 0.1602 level.
🎲 If the market continues to drop, the next major support to watch is 0.1085, which stands as the most critical support for ALGO.
📝 Final Thoughts
This analysis reflects our opinions and is not financial advice.
Share your thoughts in the comments, and don’t forget to share this analysis with your friends! ❤️

TradeCityPro | Bitcoin Daily Analysis #71👋 Welcome to TradeCity Pro!
Let’s dive into the Bitcoin analysis and key crypto indicators. As usual, I’ll review the futures triggers for the New York session.
🔄 Yesterday’s Recap
In yesterday's analysis, I mentioned that the main triggers had already been activated, and it might be too late to enter a position. However, you could still enter trades using momentum triggers such as RSI and SMA.
⚡️ As we can see, the RSI oscillator, after exiting the Overbought zone, triggered a bearish divergence and has now dropped below level 50. This means the RSI trigger has not yet been activated, and the price didn't pull back to the SMAs either — instead, it broke below them and entered a short-term correction.
⏳ 1-Hour Timeframe
In the 1-hour timeframe, we can see that the price was rejected from the key resistance at 94,283 and dropped to the 92,007 zone.
✔️ The SMA99 is getting closer to the price, and we might see a pullback to this level. If this happens and the price builds a structure after the pullback, it could offer a good long entry during the correction.
📈 The main long trigger remains the breakout above 94,283, which would signal the start of the next bullish leg.
✨ For a healthier trend structure, the price might undergo a deeper correction, increasing the chances of a pullback to the SMA99 scenario playing out.
📊 However, note that during the drop to 92,007, selling volume increased, which is not favorable for the bullish trend. So, if you're planning to enter a long during this correction, make sure selling volume is decreasing and buying volume is rising.
🔽 For short positions, as mentioned in previous analyses, we must wait for a confirmed trend reversal. Currently, there is no trigger indicating a downtrend, and we need to wait for a new structure.
👑 BTC.D Analysis
BTC dominance is still climbing and moving toward the 64.60 resistance level. If it stabilizes above this level, it could initiate the next bullish leg for BTC dominance.
💥 For a bearish BTC.D scenario, either rejection from 64.60 or a breakdown below 64.12 would be appropriate triggers.
📅 Total2 Analysis
Total2 is showing a deeper correction compared to BTC, aligning with the increasing BTC dominance. It has corrected down to the 0.382 Fibonacci level.
🔼 For long positions, a breakout above 1.04 is a good trigger — but be sure to watch BTC.D to decide whether to go long on Bitcoin or altcoins.
⭐ As for shorts, like other charts, we need to wait for a confirmed trend reversal before considering a short position.
📅 USDT.D Analysis
This chart is also correcting, and after finding support at 4.99, it is now retracing upward and sits near 5.13.
💫 For the downtrend in USDT.D to continue, a break below 4.99 is crucial. If it holds below that level, the overall crypto market can continue moving upward.
❌ Disclaimer ❌
Trading futures is highly risky and dangerous. If you're not an expert, these triggers may not be suitable for you. You should first learn risk and capital management. You can also use the educational content from this channel.
Finally, these triggers reflect my personal opinions on price action, and the market may move completely against this analysis. So, do your own research before opening any position.

TradeCityPro | ICP: Breakout Watch in Web3 Veteran’s Price Range👋 Welcome to TradeCity Pro!
In this analysis, I’m going to review the ICP coin for you. The Internet Computer project is one of the older projects in the crypto space, focused on Web3 and gaming.
⚡️ The coin currently has a market cap of $2.65 billion, placing it at rank 36 on CoinMarketCap.
⏳ 4-Hour Timeframe
As you can see in the 4-hour timeframe, a range box has formed between the levels of 4.648 and 5.239, and the price has currently reached the top of the range.
✔️ During this upward leg from the bottom of the box, market volume has been increasing, which indicates that the probability of breaking through 5.239 is high.
🔍 If 5.239 is broken, we can enter a long position. The next resistance levels are at 5.558 and 6.313.
✨ There’s also a larger range box between 4.648 and 6.313, and as long as the price stays above 4.648, we can say that this broader range is valid and price is fluctuating within it.
📉 To open a short position, wait for the break of 4.648. The momentum in higher timeframes for this coin is bearish, so if this level breaks, the trend may continue downward with another leg to the downside.
📊 For that to happen, selling volume must increase, so that when 4.648 breaks, there is no volume divergence, ensuring a healthy continuation of the trend.
📝 Final Thoughts
This analysis reflects our opinions and is not financial advice.
Share your thoughts in the comments, and don’t forget to share this analysis with your friends! ❤️

TradeCityPro | Bitcoin Daily Analysis #70👋 Welcome to TradeCity Pro!
Let’s dive into Bitcoin and major crypto index analysis. As usual, in this analysis I’ll review the futures triggers for the New York session.
🔄 Yesterday’s Analysis
Yesterday, the price broke through the 88502 level, which was our main trigger for a bullish move. The price then made a very sharp upward move and even broke the next resistance at 92000, now heading toward 95307.
✔️ I also mentioned the RSI, saying if it enters the Overbought zone again, we could see a sharp leg toward 92000—and that’s exactly what happened, with strong upward movement.
🧲 I hope you opened a position, because all the triggers of my strategy were activated yesterday: the fake break of 84363, the breakouts of 85126, 85550, and 88502. These were the key trend-starting triggers, and I made sure to be in a position as those sharp candles formed to profit from the move.
🎲 So today it’s a bit harder to open new positions, which is natural, because 4 main triggers have already been activated. But I’ll try to share any new ones if they appear.
⏳ 1-Hour Timeframe
As you can see, we witnessed a very sharp move, with price consistently in Overbought, and now just exiting that zone.
⚡️ The triggers I can give today aren’t really based on support/resistance breaks. If you’re going to open a position, you should enter with minimum risk and based on momentum. That is, if you see bullish momentum coming in, go long.
☘️ You can use the SMA indicator or RSI oscillator for this. The price has pulled back multiple times to SMA7, and moved again with confirmation candles. You can also use this strategy with pullbacks to SMA25 or SMA99.
💥 The RSI is also a momentum oscillator, and if it re-enters Overbought, we could see more upside just like yesterday.
📊 In both strategies, make sure buying volume is increasing, and there is no volume divergence. Again, note that the main triggers have already been activated, and I believe the market needs to create a new structure before new entries. So today’s trigger is quite risky, and I personally won’t open a new position because I’m already in from lower levels.
🚀 If you, like me, have one or more open positions from lower levels, I recommend taking partial profit. If you have one position, take 40–50% off. If you have more than one, maybe close one entirely but keep at least one open.
👑 BTC.D Analysis
Let’s check Bitcoin dominance. Yesterday, with Bitcoin’s strong price action, dominance dropped slightly and was rejected at the 64.60 ceiling. That’s why some altcoins—especially in the DeFi category—saw strong rallies, and you could’ve opened positions on them.
💫 The next support is around 64.12, and I think BTC.D could drop to that level. A bullish trigger for dominance remains a break above 64.60.
📅 Total2 Analysis
In previous updates, I emphasized the 980 resistance level. I told you to try and have a long position ready if this level broke. As you can see, that’s exactly when the sharp move began. Now, even 1.02 has been broken, and Total2 is moving toward 1.04.
🔼 For long entries, confirmation from Bitcoin’s chart is more reliable since this index is highly correlated with BTC and is better for identifying targets or entries.
📅 USDT.D Analysis
As mentioned before, if 5.39 breaks in USDT.D, you should have a position ready. That level broke cleanly, gave entry triggers on the breakout, pullback, and break of pullback’s low, and then dropped sharply to 4.99.
🧩 Right now, USDT.D has reacted to 4.99 support, and I think the psychological 5% level has a strong impact here. I still believe the market is heavily dependent on Tether dominance, and if this support breaks, we could see another bullish leg in the market.
❌ Disclaimer ❌
Trading futures is highly risky and dangerous. If you're not an expert, these triggers may not be suitable for you. You should first learn risk and capital management. You can also use the educational content from this channel.
Finally, these triggers reflect my personal opinions on price action, and the market may move completely against this analysis. So, do your own research before opening any position.

TradeCityPro | TON: Eyeing Breakout in Telegram’s Hottest Token👋 Welcome to TradeCity Pro!
In this analysis, I want to review the TON coin for you. This coin is for the Telegram social network, and in 2024, due to airdrops like Notcoin and Hamster that trended, it became very hyped and widely talked about, and the TON blockchain experienced significant growth.
🔍 Currently, the NFT market has also launched on this network, which has prevented this coin from dropping. This coin, with a market cap of $7.78 billion, is ranked 18th on CoinMarketCap.
⏳ 4-Hour Timeframe
In the 4-hour timeframe, as you can see, after the downtrend that the price had, there was a bullish move following the news of Pavel Durov going to Dubai and leaving France, and now the price is in a correction phase again.
⚡️ Currently, a 4-hour range box has formed, with the bottom of this box at the 2.851 zone and the top at 3.216. There's also a mid-line within this box at 3.044, which the price has broken and is moving toward the 3.216 ceiling.
✔️ If the price movement continues toward the top of the box with this momentum and high buying volume, the likelihood of breaking the 3.216 area will increase significantly. So I suggest that with the breakout of this level, you try to have a long position open.
📉 For a short position, if the price gets rejected from the top of the box, you can enter a trade with a trigger on a lower timeframe. Otherwise, the first trigger is the break of 3.044, and the second trigger is the break of 2.851.
🔼 For a long position, the RSI oscillator is near the Overbought area, and if it enters Overbought, we can expect a sharp bullish move.
📊 Market volume is currently in favor of buyers and is increasing. If volume increases and RSI enters Overbought, you can place a stop buy order above the 3.216 level so that if there is a sharp breakout of this level, your position gets triggered as well.
📝 Final Thoughts
This analysis reflects our opinions and is not financial advice.
Share your thoughts in the comments, and don’t forget to share this analysis with your friends! ❤️

TradeCityPro | Bitcoin Daily Analysis #69👋 Welcome to TradeCity Pro!
Let’s dive into the Bitcoin analysis and key crypto indices. As usual, I’ll walk you through the futures session triggers for New York.
🔄 Yesterday’s Analysis
In yesterday’s analysis, the 87562 trigger was activated and could have been used to open a long position. Initially, this trigger was faked out with a large candle pulling the price back below the level. However, after a pullback to the SMA25, strong bullish momentum entered the market, and 87562 was broken.
⚡️ The next resistance that the price reacted to was 88502, where several candles stalled just below this level. Now it looks like the price is attempting to stabilize above it.
⏳ 1-Hour Time Frame
As you can see, after the breakout of 87562, a solid bullish momentum entered the market, and volume also increased. The RSI oscillator has been hovering near 70, which has supported a gradual upward move. Currently, the price has broken above 88502.
✔️ At the moment, the price trigger is considered active, and there are no significant resistances immediately ahead. However, since RSI hasn’t yet entered Overbuy, the kind of strong momentum that can push the price toward 92000 hasn't fully kicked in — and that’s why we haven’t seen a big sharp candle yet.
💡 For a long position, keep a close eye on the break of RSI 70. If RSI breaks this level, it could trigger a strong upward move to 92000, and you’ll want to be positioned for that.
🔽 For a short position, as I’ve mentioned before, we still need to wait for a clear trend reversal and the emergence of bearish momentum. Personally, I won’t open any shorts until that happens — no active short triggers at the moment.
👑 BTC.D Analysis
BTC dominance continues its upward move. If it breaks above 64.60, it could extend its bullish leg further.
📈 As a result, today a Bitcoin long looks more logical than long positions on altcoins.
📅 Total2 Analysis
The Total2 index is currently breaking above 980, and alongside this move, you might consider opening a position on one of the altcoins. If the index stabilizes above 980, it could signal an opportunity for a long-term long position.
🧩 As for bearish setups, we’ll need to wait until there’s a momentum shift in the overall market.
📅 USDT.D Analysis
As I mentioned before, the entire market was waiting on the break of 5.39 in USDT.D — and that level was finally broken. Yesterday, the price pulled back to this level and then continued downward, breaking below 5.32 and even 5.24, a significant support level.
📉 Right now, I don’t have a specific trigger to offer, as the market is moving sharply. But keep an eye on altcoins, because many of them still haven’t activated their triggers yet.
❌ Disclaimer ❌
Trading futures is highly risky and dangerous. If you're not an expert, these triggers may not be suitable for you. You should first learn risk and capital management. You can also use the educational content from this channel.
Finally, these triggers reflect my personal opinions on price action, and the market may move completely against this analysis. So, do your own research before opening any position.

TradeCityPro | WLD: Waiting for Reversal in Altman’s Web3 Coin👋 Welcome to TradeCity Pro!
In this analysis, I want to review the WLD coin for you. This project is one of the notable Web3 and Identity projects, founded by Sam Altman, who is also the CEO of OpenAI — and that adds a layer of trust to the project.
🔍 Currently, this coin has a market cap of $984 million, placing it at rank 64 on CoinMarketCap.
📅 Daily Time Frame
As you can see in the daily time frame, the price has dropped significantly since the previous analysis. After breaking below the 1.349 level, the main bearish leg began, and the price fell to the 0.603 area.
🧩 Currently, the price is in a correction phase, moving slowly upward on low volume, and has broken above the SMA25, now trading above this moving average.
🎲 Keep in mind: even though the price is above the SMA25, the slope of the moving average is still downward, which indicates that bearish momentum is still present in the market. However, since the price is now above the SMA, bearish strength is weakening.
📈 To confirm a bullish reversal for WLD, the key trigger right now is the breakout of the 0.947 level. If the price stabilizes above this level, we can say the trend has shifted to bullish.
✔️ A sooner confirmation of the trend change would be a positive slope on the SMA25 combined with increasing volume and green candles — this would be an early sign of a reversal.
🛒 For spot buying, the first trigger is the break of 0.947, and if the price holds above that, the bullish trend could begin.
🔽 The next resistance levels — which could act as targets or secondary buy triggers — are at 1.349 and 2.5776 respectively.
📊 If you already hold this coin and are looking to set a stop-loss, a break and confirmation below 0.603 would be a good level to activate your stop.
📝 Final Thoughts
This analysis reflects our opinions and is not financial advice.
Share your thoughts in the comments, and don’t forget to share this analysis with your friends! ❤️
