Is Bitcoin Repeating Its 2021 Price Action? | TRADEDOTSWe’ve observed that Bitcoin CME:BTC1! appears to be repeating a previous wave pattern. If it follows its historical price action yet again, here’s what we might expect:
2021 Comparison
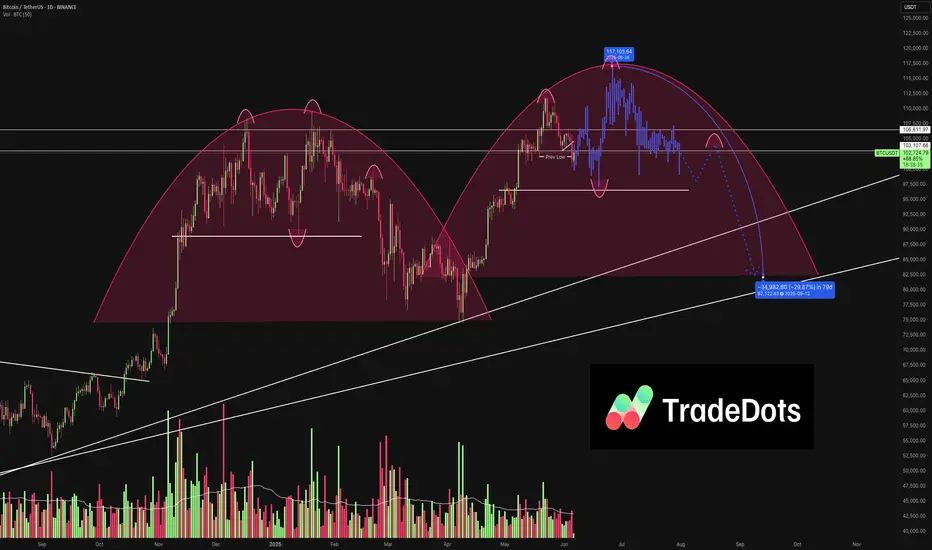
Back in 2021, Bitcoin formed two large rounded wave structures where the second wave exceeded the first, forming two consecutive all-time highs followed by a huge drawdown. This year’s price action looks very similar to the beginning of the second 2021 waves. If it continues to unfold in the same way, we anticipate a new all-time high before the end of this year, followed by a notable pullback into early next year.
Key Support at $96,000
As long as BTC holds above $96,000, the bullish trend remains intact. This level has shown great demand and volume support, reinforcing its role as the floor for the short-term uptrend.
Upside Potential to $117,000
If buyers continue to support the market above $96,000, BTC could reach the $117,000 region, setting another all-time high. This expectation follows the earlier wave pattern seen earlier this year and completes a close parallel to the 2021 bull run.
Deeper Pullback Expected
After a potential new high, a larger correction is likely. Drawing on previous pullback price action, a 30% dip toward $82,000 could align with a higher-time-frame trendline and significant support area—mirroring the wave structure from 2021.
Final Thoughts
BTC remains structurally bullish above $96,000
A pullback to the $82,000 region could present a key buying opportunity if it occurs.