S&P 500 extends rally despite macro concernsThe 5% Apple rally aside, it is all about rate cut bets vs. strong earnings. So far, the latter has helped to keep US markets supported near all-time highs. But if macro concerns increase further, investors' perception about future earnings growth will weaken. And with that, we could see some cracks in expensive stocks.
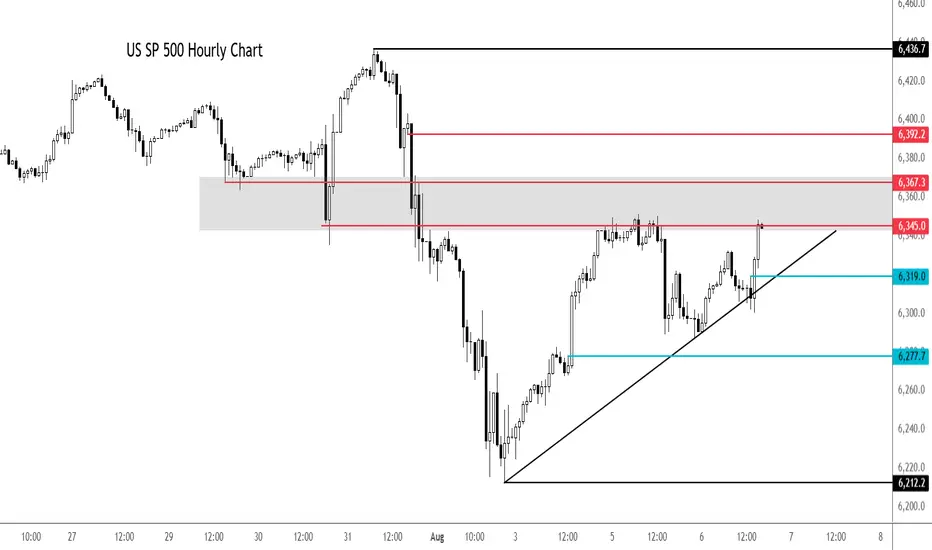
Looking at the hourly chart of the SPX500, the US benchmark was testing a potential resistance zone in the shaded region between 6345 to 6367, an area which was previously support. Above this zone, 6392 is the next level of potential resistance and then the all-time high of 6436 comes into focus next.
earlier, the index bounced after a failed breakdown below the trend line shown on the chart. Another potential test of the trendline could see the index break lower. Short-term support is seen around 6319 then 6277.
By Fawad Razaqzada, market analyst with FOREX.com
Tradeideas
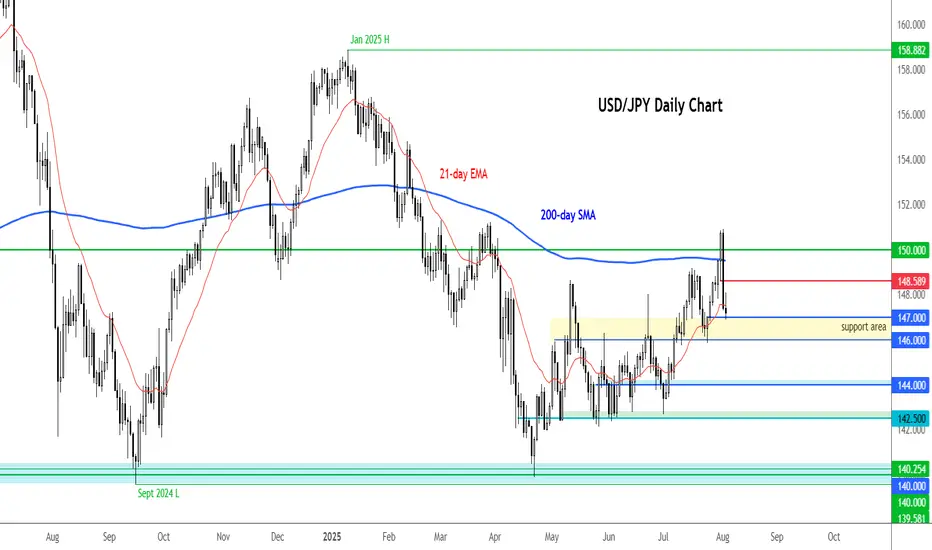
USD/JPY testing key support after Friday's dropThe USD/JPY fell sharply Friday in reaction to the weak US jobs data. But it is now testing the upside of a massive short-term support area, between 146.00-147.00. Can we see a bounce here towards 148.60 zone initially?
By Fawad Razaqzada, market analyst with FOREX.com
EURUSD Analysis – Supply Zones & Reversal Opportunities (MMC)Today’s EURUSD analysis focuses on identifying major supply zones, potential reversal points, and directional bias using the Mirror Market Concept (MMC) on the 8-hour timeframe.
1️⃣ Market Structure & Channel Supply Zone
The market recently formed a descending channel 📉, acting as a full supply zone where sellers dominated.
Every time price touched the upper boundary of this channel, we saw bearish reactions, proving this zone as a strong liquidity grab area.
Breakdown from the channel: After repeated attempts to break the channel to the upside, sellers regained control, pushing EURUSD lower and confirming bearish momentum.
2️⃣ Central Reversal Zone (Decision Point) ⚖️
Currently, price is consolidating around the Central Reversal Zone.
This zone is crucial because it can act as:
Reversal Point 🟢: If buyers step in aggressively, we might see a bullish leg toward previous swing levels, targeting resistance zones.
Continuation Zone 🔻: If sellers maintain pressure and break below this level, momentum will shift strongly bearish, aiming for deeper support.
Price behavior here will define short-term direction. Traders must wait for confirmation before committing to large positions.
3️⃣ Next Major Reversal Zone (High-Probability Demand) 🟩
Marked in green, this zone is expected to attract buyers if the current level fails.
Historically, these areas show high liquidity grabs and institutional activity.
If price reaches this zone, we expect significant bullish interest, making it a high-probability reversal area for medium-term buy setups.
4️⃣ Trade Scenarios
Scenario 1 (Bullish Reaction 🟢):
Price bounces from the Central Reversal Zone.
Possible targets: Previous structure highs inside the channel break zone.
Scenario 2 (Bearish Continuation 🔻):
Price fails to hold above and breaks lower.
Target: Next Major Reversal Zone for fresh liquidity accumulation.
5️⃣ Trading Approach & Risk Management 🛡️
Aggressive Approach: Intraday traders can scalp inside the Central Reversal Zone but must keep tight stop-losses to avoid fake-outs.
Conservative Approach: Wait for a clean break and retest confirmation, especially near the Next Reversal Zone for high-probability trades.
Maintain risk-to-reward (RR) ≥ 1:2 and avoid emotional trading during reversal attempts.
Summary:
EURUSD is at a critical juncture. The current market structure shows a bearish tone, but the Central Reversal Zone can still cause a temporary bullish reaction. A failure to hold will open the path toward the green reversal demand zone, where major buyers are likely to appear.

$IREN could be next...100%+ UpsideNext Retail Darling... NASDAQ:IREN TA looks the part! 👀
Breakout 🎯$22 then $31
CupnHandle almost breaking out here with measured moves a lot higher!
Volume shelf acting as a launch pad.
WR% is uptrnding as well!
This one's looking good based on the TA.

$TEM - GET READY! 30%+ UpsideNASDAQ:TEM - GET READY!
✅ Inverse H&S Breakout
✅ Falling Wedge Breakout
🎯 Targets: $77.43 & $90.63 Before August!

$NVTS is up 125%, but they might not be done yet!NASDAQ:NVTS Could see more upside if...
We close the week above $4.66 Double Bottom Breakout. This would lead us to the following targets...
🎯$6📏$7.76
- Bullish cross on H5_L indicator
- Volume shelf launch with GAP
- NASDAQ:NVDA Partnership
- Small Cap
- High Short Float

MNQ Trade Idea Continuation (3)Continuation into the trade idea we were sharing, we traded through the Daily high level we were targetting of 21,404.75 then rushed lower under the Trendline Phantom line and under the IFVG that was used as support for price to reach 21,419.75.
Will this be another manipulation below 21,362.00 lows before continuation higher, or should I have set a TP at the 21,404.75 highs and called it a day?

Tyree Thomas Jr USD/JPY Bias 4/7/25I believe that U/J will sell to my take profit at the green Fib extension. I will be posting my trade ideas every evening. I use the Fibonacci Retracement tool, the Fibonacci Extension tool, Six EMA's, Market Structure, and the TDIGM in my trading strategy to create my Bias.

Ready to $DASH! H5 Swing TradeReady to NASDAQ:DASH 🏃💨
🎯$215📏$227⏳May2025
Falling Wedge Breakout ✅
Breakout Retest ✅
Bullish WCB ✅
Volume Shelf ✅
Bullish H5_S Indicator ✅
Not Financial Advice

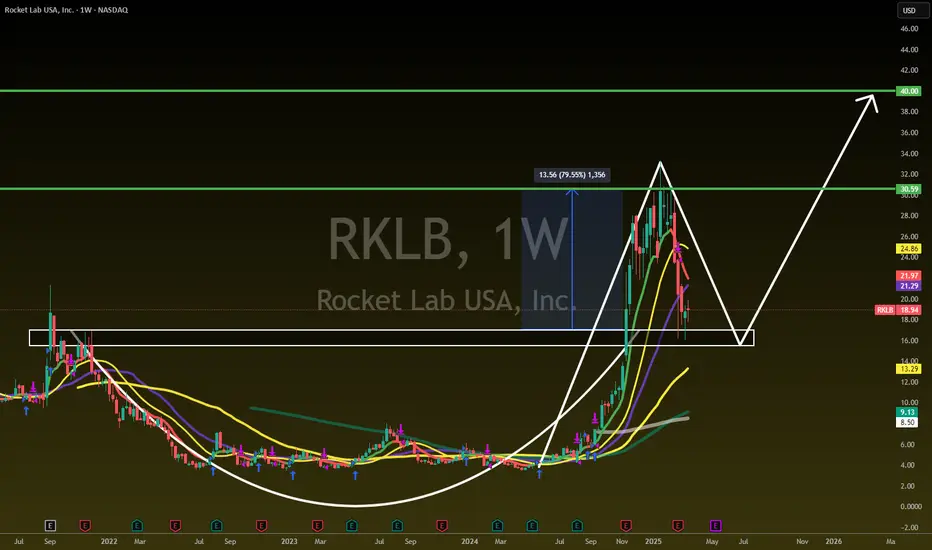
$RKLB - Has landed back at the launchpad! Ready to Re-LaunchNASDAQ:RKLB - Has landed back at the launchpad🚀
Rounded Bottom = $30.59 MM 🎯🏹
Retested and Confirmed with 2 Wick-Offs
Market goes higher = $40 🎯
Not financial advice
META is coming back to life!NASDAQ:META
As we discussed before a breakdown out of this Bullish Trend since 2022 would be very bearish and take META to the $400's.
Well, they said, hold my beer, and bounced hard exactly at the bottom of the channel and Anchored VWAP.
It's not over yet, as we need to follow through next week with a nice engulfing candle to make people into believers!
Not financial advice.

H5 Trade of the Week! 21% UpsideNASDAQ:BIDU Swing Trade is Primed!
In this video, I'll give you:
- Full Trade Idea
- Entry & S/L
- Options Taken
- Profit Targets
Check it out!
Not financial advice

Reddit has more downside! 26% Potential GainNYSE:RDDT is going to $83...🤷♂️
- H&S MM is $83
- Price GAP fill from earnings is $83
- Anchored VP GAP is $83
Don't shoot the messenger, take advantage!
Not financial advice

META to the $400s?! I hope so!!!NASDAQ:META
Is the show over or will the show go on?
At the bottom of the Bullish Channel that started in October 2022.
A breakdown of this channel could lead NASDAQ:META back to a stock price in the 400's...
A Breakdown retest of the lower Anchored VWAP band could be a false breakdown and bounce area as well. If we break through that though then this name is going to the $400's area.
Not financial advice

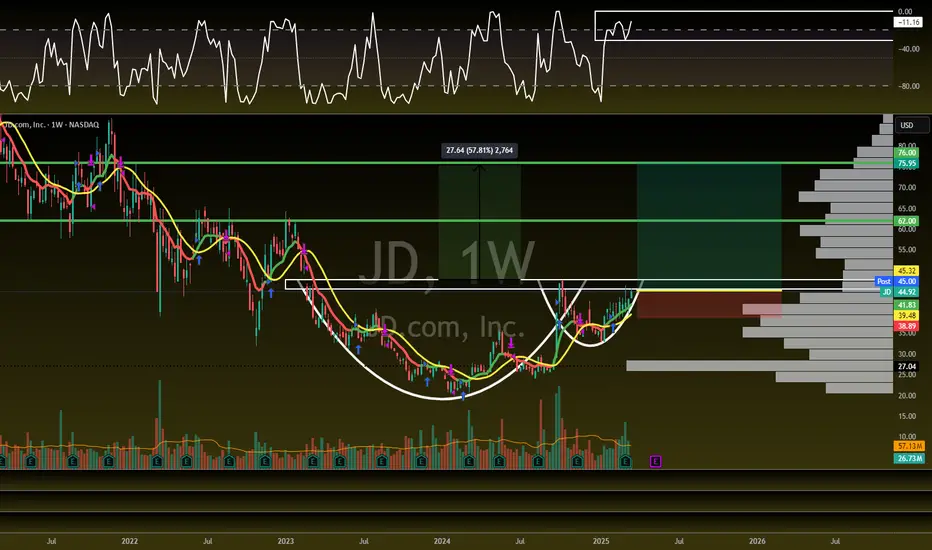
China Trade Setup with 67% Upside!NASDAQ:JD - H5_W Trade Setup: 🚨
CupnHandle Breakout =
🎯$62
📏MM: $76
- Multi Year CupnHandle
- Green H5_W
- Volume Shelf with GAP
- Thriving WCB
- China is HOT!
Not financial advice
BABA: Swing Trade Setup with 14% Upside🚨Swing Trade Setup: NYSE:BABA
Breakout = 🎯$162
Entry: $142.20
S/L: $135.65 (3to1 R/R)
Target: $162 (14% Higher)
NOT FINANCIAL ADVICE

OKTA - CupnHandle Trade Setup! 61% Upside🚨 H5_L Trade Setup NASDAQ:OKTA 🚨
NOT EVERYTHING IS IN FREEFALL!
🍵BREAKOUT = 🎯$139 🎯$185
Entry: $117.29
5/1 RR - S/L: $103.55
Not in a straight line though friends!
NOT FINANCIAL ADVICE

XAG/USD Bearish Reversal Incoming? | Silver 4H Analysis📉 XAG/USD (Silver) 4H Chart Analysis – Bearish Setup 🚨
🔍 Key Observations:
Supply Zone (POI - Point of Interest) 🟪: The price is approaching a strong resistance area around $33.23 - $33.50.
Liquidity Grab (LQ) & Rejection Expected ❌: The previous major liquidity zone (LQ) suggests a possible fake breakout or rejection.
Bearish Projection ⬇️: The chart outlines a potential reversal after reaching resistance, leading to a drop towards $31.00 - $30.50.
📌 Trading Plan:
Short Entry 🎯: Around $33.20 - $33.50 (if price rejects this area).
Target 🎯: Major demand zone at $31.00.
Stop Loss 🚨: Above $33.60 (to avoid fakeouts).
Confirmation Needed 📊: Look for bearish candlestick patterns (e.g., engulfing, wicks, or double top formations).
⚠️ Final Thoughts:
Bearish Bias ⚠️ unless price breaks and holds above $33.50.
Monitor market conditions 🧐—news and fundamentals could shift momentum.
🔥 Trade smart! What do you think?

AUD/USD at Critical Support – Breakout or Breakdown? 🔍 AUD/USD Daily Chart Analysis – March 9, 2025
Key Observations:
Ascending Channel 📈
The price is moving within an upward channel, indicating a short-term bullish trend.
Support & Resistance Zones 🟦🟥
Support: Around 0.6231 - 0.6200 (blue zone). A breakdown below this could push the price lower toward 0.6129 (orange zone).
Resistance: The 0.6460 - 0.6584 level is the next major hurdle for bulls.
200-Day Moving Average (Red Line) 🔴
The price is currently below the 200-MA, indicating a long-term bearish sentiment. However, a breakout above this level could signal a trend reversal.
Potential Scenarios 📊
✅ Bullish Case: If the price sustains above 0.6231, we could see a bounce towards 0.6460 - 0.6584 in the coming weeks.
❌ Bearish Case: A break below 0.6231 could push the price toward the 0.6129 - 0.6100 region before finding support.
Trade Plan 🎯
Buy Zone: Around 0.6231 with a stop-loss below 0.6200.
Sell Zone: If price rejects 0.6460, a short position could be considered with a stop above 0.6584.
📊 Conclusion: AUD/USD is at a key decision point. Bulls need to hold support for further upside. A breakdown could trigger a bearish move.

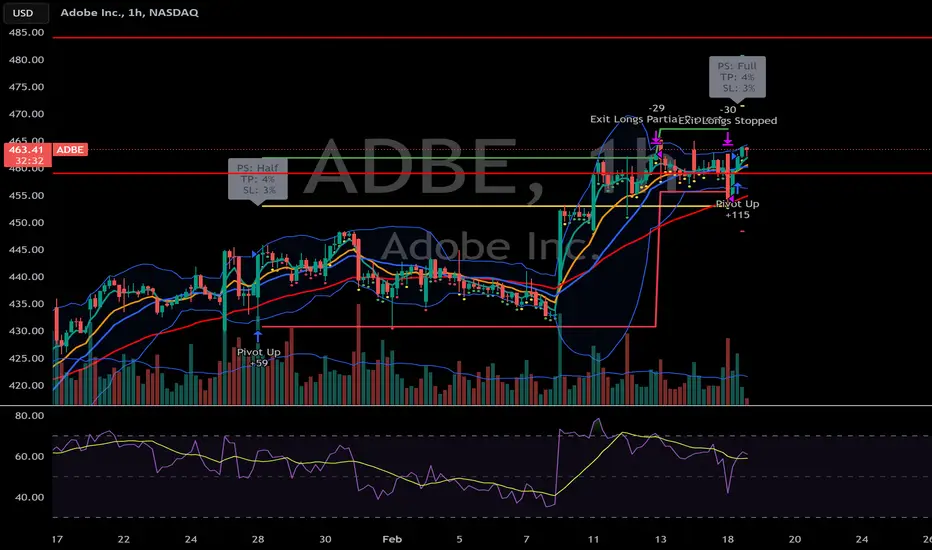
Going Long with ADBE!ADBE after hitting take-profit, sold off during first hour of day and got stopped, only to reverse. Typically when trades start to win, they continue doing so, which is why I went long when the signal fired earlier.
The King Trading Momentum Strategy combines the 5 EMA crossing above the 13 EMA, RSI strength, favorable momentum as measured by ADX plus evaluating recent volume changes and even something that measures breakout momentum called Beta for this one! ARKK and over 100 equities are built into this script with optimal backtest take profits and stop losses and can be toggled on by simply checking a box (default they are turned off).
$GRAB yourself some GAINS!NASDAQ:GRAB yourself some GAINS!
The longer the base, the higher the space!
Lots of retail and super investors buying this name.
A train that goes in motion stays in motion...
- Wr% is in motion to the Green Support Beam.
Typically, this name would probably pull back with the direction of the Wr%, BUT... this stock is getting hyped up by a lot of super investors and retail investors right now. I think this week we will see a large move upward as HYPE creates FOMO which takes the stock HIGHER!
Staying patient here...
Not financial advice

A 51% upside trade idea watchlist add before we moon!NASDAQ:MNMD
Inverse H&S
$10.44 BREAKOUT =🎯$12.25🎯$15.60
Called this one out a few months ago and how RFK Jr. would send the Psychedelic's Stock flying...He did just that after his inauguration. It could keep flying now with momentum!
Not financial advice

$PAYC: Can we hit another earnings LOTTO?!NYSE:PAYC : Can we hit another earnings LOTTO?!
Bought some March calls here.
Tech Services/ SaaS has been hot
🎯$227🎯$253
Not financial advice
